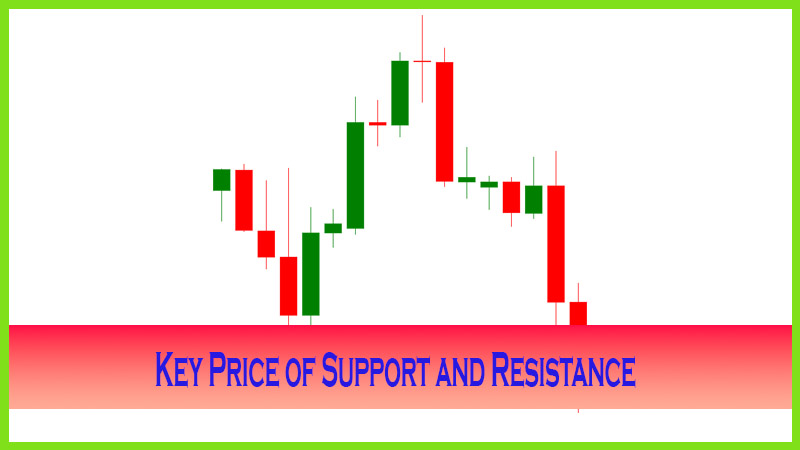
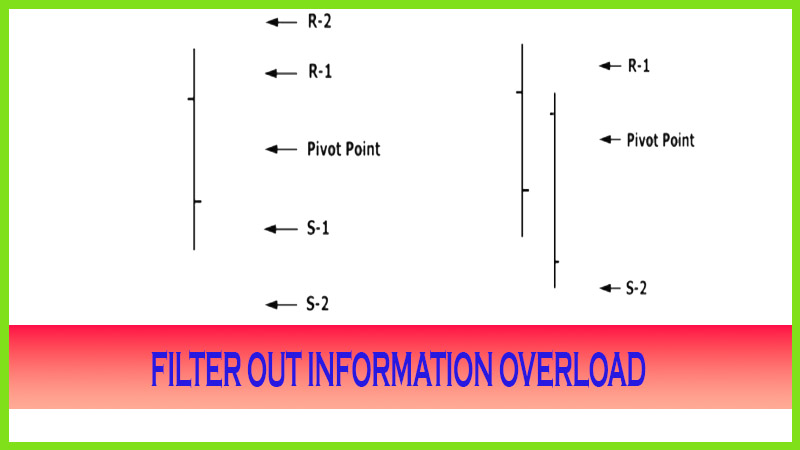
Filtering out Information Overload
Support and Resistance levels, Pivot Points Levels, Best Trading strategy, Trading triggers
Course: [ The Candlestick and Pivot Point Trading Triggers : Chapter 5. Pivot Points ]
Technically speaking, in a bearish market, the highs should be lower and the lows should be lower than those of the preceding time frame. If they are, then I use that information to help me filter out unnecessary data or excessive support and resistance numbers on my charts.
FILTER OUT INFORMATION OVERLOAD
I have developed a method
to filter out the pivot numbers; this is just one facet that I explain to
attendees of my trading seminars and to students. Keep in mind that this methodology
applies to all markets, including stocks, futures, and especially spot foreign
currency markets, or forex. This method can work for a short-term application
for identifying a potential range for a day, a week, or a month. By having a
good idea, well in advance, of what the high or the low for a given time period
might be, you are able to use this information to apply the right trading
vehicle or strategy, such as whether it is simply selecting an entry level or
getting in or selecting a profit objective or getting out of a trade. You could
also determine whether to apply an option strategy or when to use an exchange
traded fund, as we discussed in Chapter 1.
Predicting
Highs and Lows Using the Calculations
What I do
to determine the potential range for a given session is to take the R-1 and the
S-1 initially for my analysis, especially in low-volume consolidating trading
sessions.
I use the
actual pivot point for many things; one that is useful is understanding that it
can be used as an actual trading number in determining the high or the low of a
given time period, especially in strong bull or bear market conditions. In an
extremely bullish market condition, the pivot point can become the target low
for the trading session. This number represents the true value of a prior
session. In an up-trending market, if the market gaps higher above the pivot
point, then a retracement back to the pivot will attract buyers. Until that
pivot point is broken by prices trading below that level, traders will step in
and buy the pullback. The opposite is true in an extremely bearish market
condition; the pivot point will act as the target high for the session. If a
news-driven event causes the market to gap lower, once traders access the news
and discover it is not as bearish as thought, prices may trade back up to test
the pivot point; if the market fails to break out above that price level and
trades higher, sellers will enter the market and take action, pressing the
market lower again.
Filtering the Numbers
Technically
speaking, in a bearish market, the highs should be lower and the lows should be
lower than those of the preceding time frame. If they are, then I use that
information to help me filter out unnecessary data or excessive support and
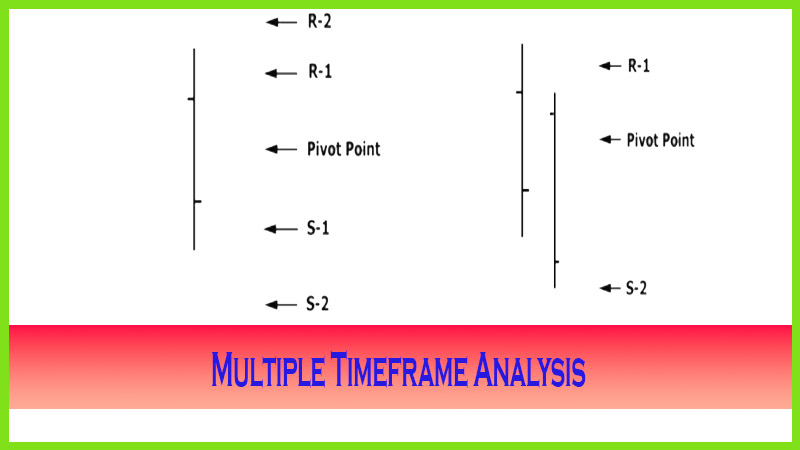
resistance numbers on my charts. I use the actual pivot point up to the R-1
number for resistance, and then I target the S-2 for the potential low or for
that time period’s trading range.
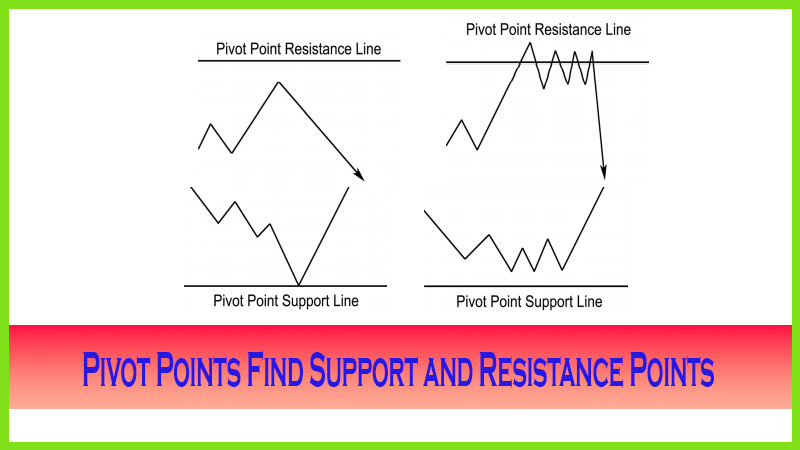
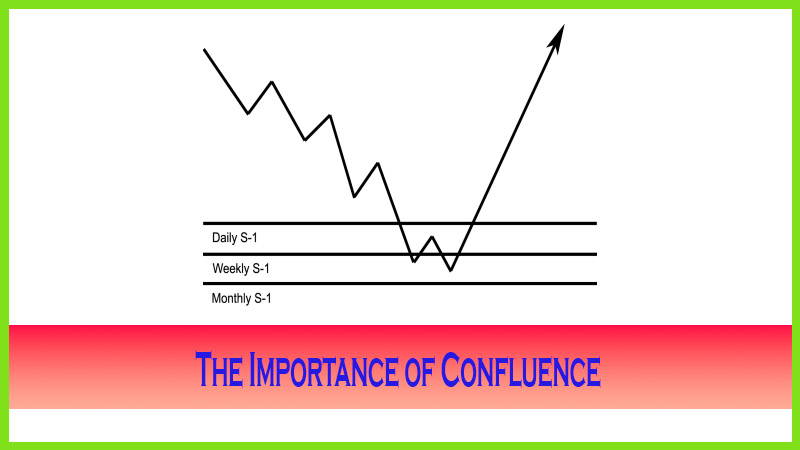
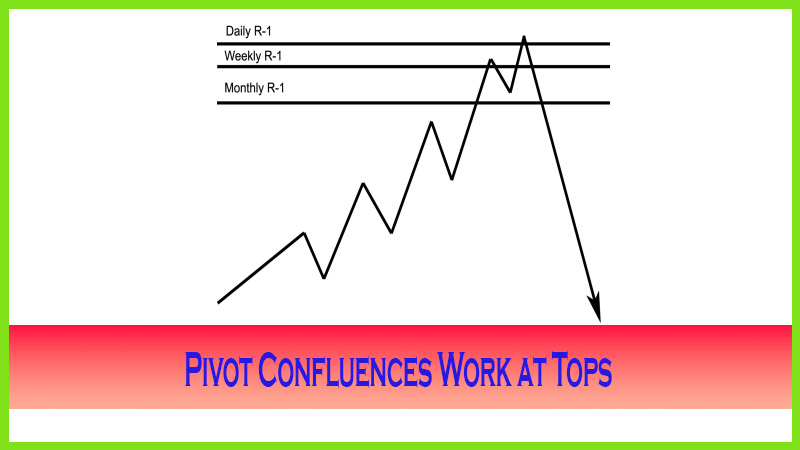
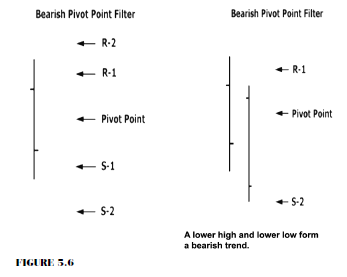
As you can see in Figure 5.6, if I determine the market is bearish and if I understand the relationship of the geometric distance of the resistance and support targets, I can eliminate the R-2 number, since in a bearish environment we should see a lower high. If I am looking for a lower low, then I can eliminate the S-1 support number as well; and now I have reduced the field to just three numbers.
If I
apply the same methodology on daily, weekly, and monthly charts, instead of 39
numbers, I am now working with just 9 numbers. Once again, I am not using the
numbers to place orders ahead of time (even though you could); I use the
numbers as a guide. These numbers work so well and often act as a
self-fulfilling prophecy because so many institutions and professional traders
do use them. Many have different size positions on. Some traders may not wait
for the exact number to hit and may start scaling out of positions (as I do);
and so should you. With this method, you can use these numbers as exit areas on
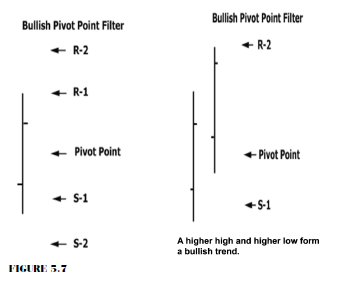
your trades. As Figure 5.7 depicts, in a bullish market environment, by
definition you may agree that the highs should be higher and the lows should be
higher than those of the preceding time period. When I have determined that we
are in a bullish trend, I target the S-1 up to the pivot point for the low of
the session and the R-2 for targeting the high; and that will give me an idea
of what the potential trading range will be.
Lining Up the Numbers
When the
market goes through the projected daily target numbers, I then use the next
time periods for a better gauge or reliability as to the next price objective.
That is where the significance of the weekly and the monthly numbers comes into
play.
Back in
the late 1990s when I owned a brokerage firm, I developed a method to help me
line up the pivot point levels as shown in Figure 5.8; I had all my brokers use
these numbers, and many still do to this day. The table of information was for
the trading session of 1/18/2006.
My method
categorizes the pivot point levels to the various market conditions, such as
neutral (Target Key) bullish, and bearish. I like to know what the prior time
period’s range and close were for fast access, so I included that in as well.
Since the pivot point is important, I include that on the sheet, as shown in
the last column on the right. The third column from the right states Market
Direction. That is a moving average of the actual pivot point.
If the
pivot point and the close or settlement price are below the market direction
number, then the market condition is deemed to be in a bearish mode; and it
helps me to line up the R-1 and S-1 numbers as the projected target range for
that next session.
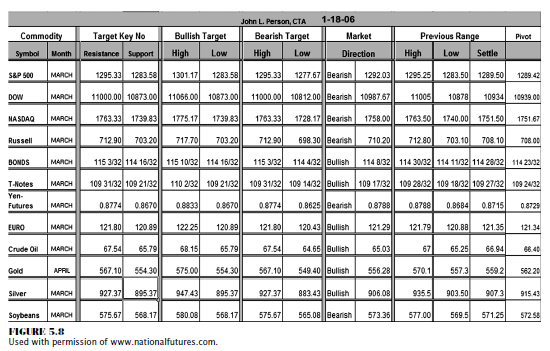
If you look down the far-left column to where
you see “Bonds,” you will see that the market direction number classified the
market condition as bullish due to the location of the previous settlement and
that the pivot point was above the pivot point moving average.
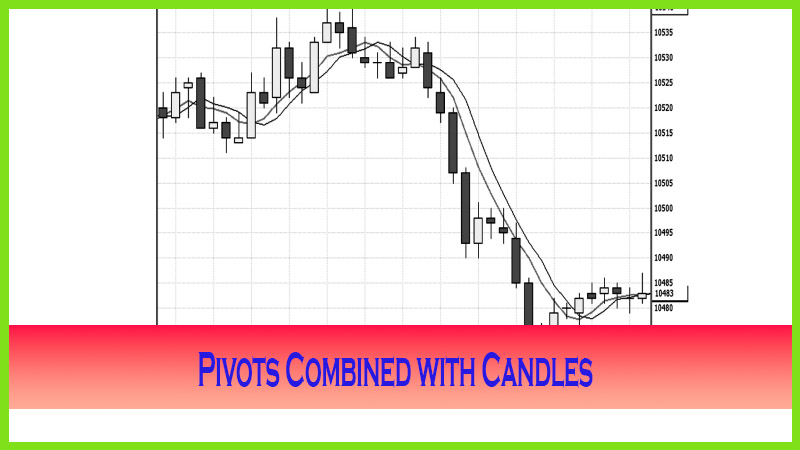
The
numbers targeted the high in bonds to be 115% (R-2) and the low to be 114%
(S-1). The pivot point was 114%.
Since the
market closed at 114%, there was a strong chance to see 115%, as well as a low
of 114%. Figure 5.9 shows the exact trading session activity on a 15-minute
candle chart. If you are a candle chart aficionado, you will have spotted that
the high was formed by a shooting star pattern and that the low was made by a
bullish engulfing pattern. While the market broke out above the targeted
resistance, it certainly did not stay there long. Notice how the price
penetrated the low but reversed off the projected low as well. We will use this
chart later in the book as we share statistical in-formation on which candle
patterns have high frequency of forming tops and bottoms. At this point, just
heighten your awareness that there was a doji after the star at top and a doji
near the bottom.
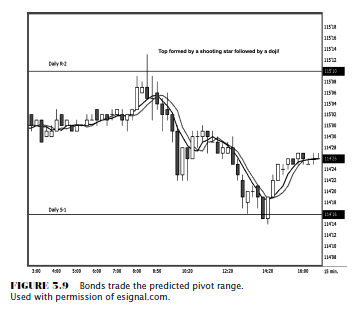
This
chart also has another component—a moving average method that we will discuss a
variation of as well. By using the true value of the market, which I refer to
as the pivot point, we can help determine the market condition and the
projected price ranges as well as potential turning points as market conditions
change from bullish (uptrend) to bearish (downtrend).
The Candlestick and Pivot Point Trading Triggers : Chapter 5. Pivot Points : Tag: Candlestick Pattern Trading, Forex, Pivot Point : Support and Resistance levels, Pivot Points Levels, Best Trading strategy, Trading triggers - Filtering out Information Overload