Pivot Points Find Support and Resistance Points
pivot points support and resistance lines indicator, pivot points support and resistance calculation, what is pivot support resistance
Course: [ The Candlestick and Pivot Point Trading Triggers : Chapter 5. Pivot Points ]
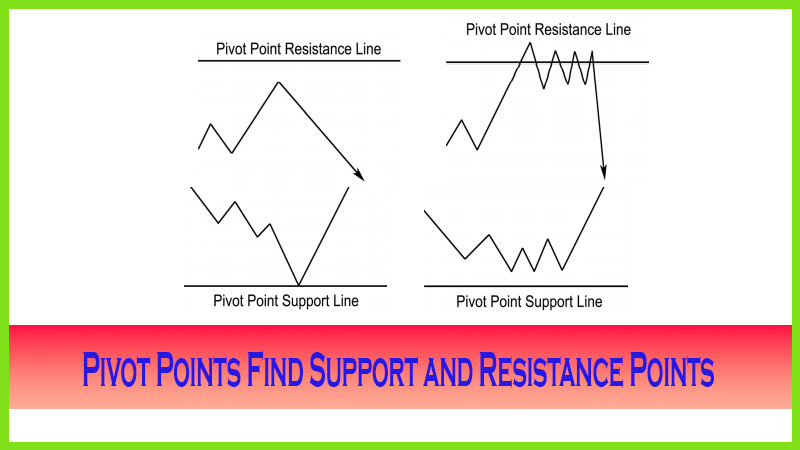
The patterns we see and the way a market behaves at or near a pivot point support or resistance level will be different. Therefore, the velocity and the magnitude of a price move will vary every time.
POSSIBLE OUTCOMES WHEN PRICES ARE NEAR PIVOT AREA
You need
to stay in the “now,”
to focus on the current market condition or environment. Keep telling yourself
that what happened in the past or perhaps even your last trade is of no concern
to the current trade you are in. Remember that each trade will have a different
outcome. The patterns we see and the way a market behaves at or near a pivot
point support or resistance level will be different. Therefore, the velocity
and the magnitude of a price move will vary every time. For example, as shown
in Figure 5.1, prices could come close to but not exactly hit the pivot level.
That does not mean prices will do that every time. As Figure 5.2 shows, prices
can exceed resistance by a small margin; this may invite you to buy a breakout
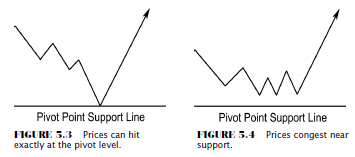
of the resistance level and trap you into buying the high. Then, as Figure 5.3
illustrates, prices can hit the pivot support number exactly, which does happen
frequently. But if you program yourself to anticipate, that will be the outcome
every time; you will be in for a rude awakening due to the potential that
Figure 5.4 represents the occurrence that sometimes prices just come close and
consolidate or congest near the pivot point support or resistance levels for a
period of time before reacting off those levels. Once again, the market’s past
performance is not indicative of future results; so we need more information in
the thought process to initiate a trade and to exit a trade. The pivot point
levels will allow you to set up a particular game plan; therefore, when you
apply more layers of analysis, such as candle patterns and a moving average
approach of the pivot point, that is where you will improve on your trading
decisions, from both your entries and your exits.

DETERMINE THE RANGE
Data
should be used for the all session trading markets with the close of business
as the settlement price. In the futures markets, I do not use just the U.S.
markets’ open outcry trading session. Here is why: The night sessions of most
markets include the Asian and the European markets; and those participants do
trade in U.S. financial markets. If an event took place that caused a market to
move and a trade price was recorded, then it is a valid price point and will be
put in the history books as a trade occurring. Therefore, I consider that
information as accurate from a valid trading session. Most U.S. retail or
individual speculators may not be up at 3 a.m. (CT) trading off a market move;
but potentially, professional traders are, and therefore the information is
considered valid. Gosh, even the exchanges seem to believe it’s valid since
money moves into and out of an account if a trade is made; so the high or low
of that period should be considered.
The Candlestick and Pivot Point Trading Triggers : Chapter 5. Pivot Points : Tag: Candlestick Pattern Trading, Forex, Pivot Point : pivot points support and resistance lines indicator, pivot points support and resistance calculation, what is pivot support resistance - Pivot Points Find Support and Resistance Points