Support and Resistance in Disguise
Support resistance indicator, support and resistance zones, Support zone, Resistant zone
Course: [ The Candlestick and Pivot Point Trading Triggers : Chapter 5. Pivot Points ]
If a market departs too far from the mean or moving average, there are two sides to consider: one from a profit perspective, and the other from a risk perspective. Institutions and professional traders know this and will have a predetermined price level calculated to either enter or exit a position.
SUPPORT AND RESISTANCE IN DISGUISE
If
a market departs too far from the mean or moving average, there are two sides
to consider: one from a profit perspective, and the other from a risk
perspective. Institutions and professional traders know this and will have a
predetermined price level calculated to either enter or exit a position. In
laymen’s terms, if a market went too far too fast, it is time to get out and
take a profit or to take advantage of an extreme price move by initiating a
countertrend trade. So in order to gauge what the standard deviation is, many
professional traders use pivot point analysis because it is based on a testable
method.
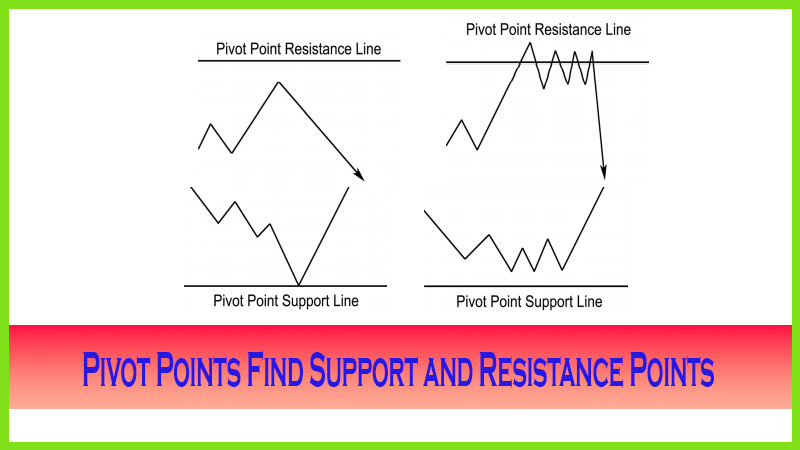
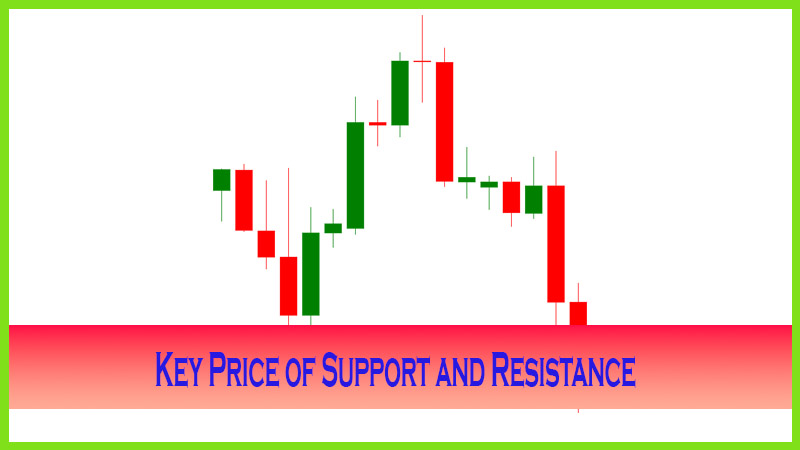
Pivots
are disguised price points because they cannot be detected most times using
such conventional technical analysis techniques as traditional support and
resistance trend lines, Fibonacci levels, and Gann fan angles, and indicators
like moving averages and such oscillators as the CCI (commodity channel
indicator), stochastics, and the MACD (moving average convergence/divergence)
studies. It is imperative that you know how to determine where the pivots are
so you are aware at what time and price level the market will most likely
change direction. That does not mean to say that at times pivot points coincide
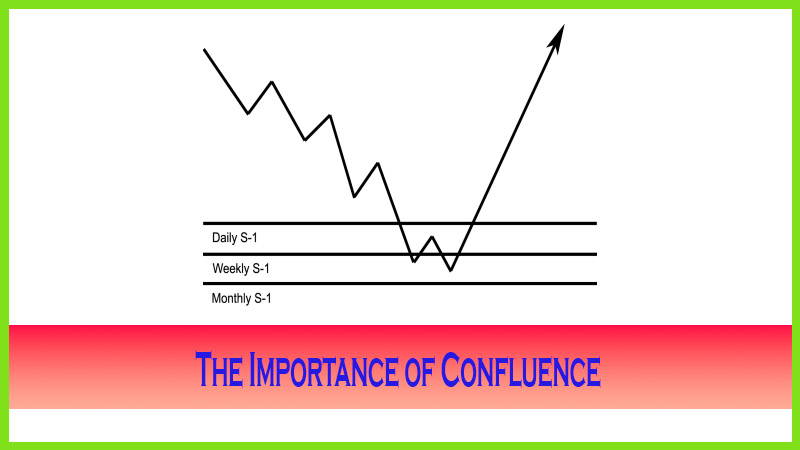
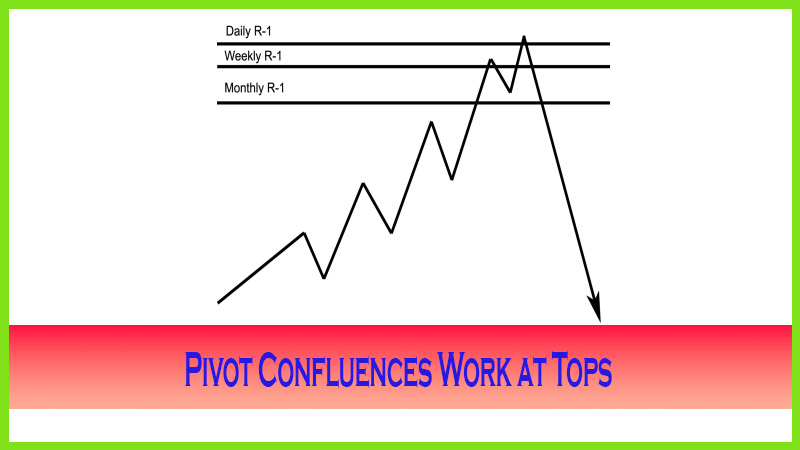
or line up near one of these other technical studies. In fact, pivot point levels
coincide frequently with Fibonacci extension correction levels, which are
referred to as confluence or coincidental factors. I will explain that in more
detail as well.
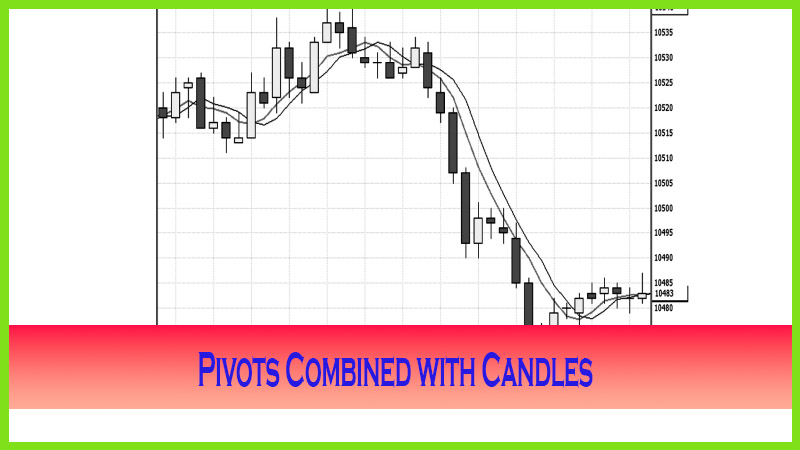
Pivot
point analysis is the best “right side” of the chart indicator, as I like to
call it, due to its predictive accuracy. It is a mathematical formula, as I
understand, originally developed by Henry Wheeler Chase in the 1930s. Chester
W. Keltner used part of the formula to develop the Keltner bands as described
in his book, How to Make Money in Commodities (Keltner Statistical Service,
1961). However, it was really Larry Williams who was credited with re-popularizing
the analysis in his book How I Made One Million Dollars Last Year Trading
Commodities (Windsor Books, 1979). Don Lambert, the creator of the commodity
channel indicator, uses the pivot point formula that makes the CCI work.
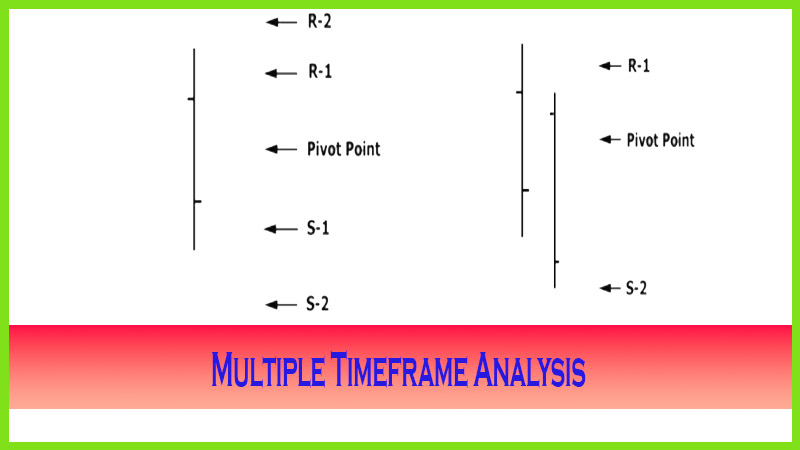
In my
first book, A Complete Guide to Technical Trading Tactics (Wiley, 2004), I
illustrated many trading methods that you can apply using pivot point analysis,
including the power of multiple time frames or what is know as confluence of
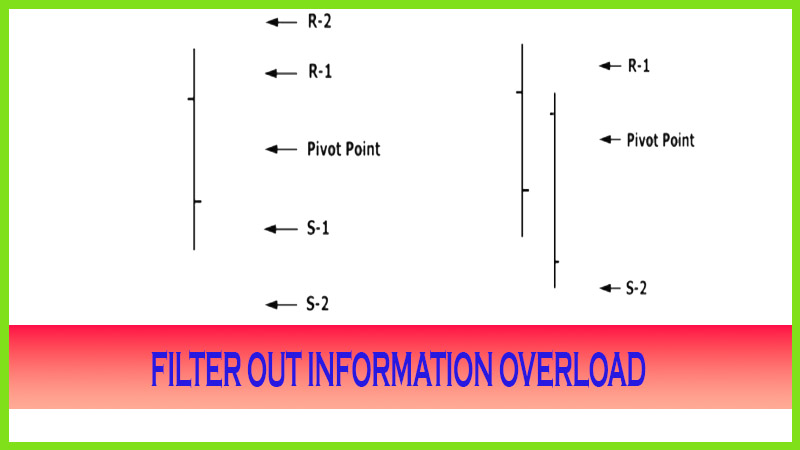
various target levels. This book will highlight those techniques, as well as
explain how to incorporate the pivot point as a moving average trading system
and how to filter out and narrow the field of the respective support and
resistance numbers, and will divulge various formulas that are popular today.
The Candlestick and Pivot Point Trading Triggers : Chapter 5. Pivot Points : Tag: Candlestick Pattern Trading, Forex, Pivot Point : Support resistance indicator, support and resistance zones, Support zone, Resistant zone - Support and Resistance in Disguise