Indicators Mathematical Calculations
Pivot Point indicators, Support level calculations, Resistance level calculations, pivot point analysis
Course: [ The Candlestick and Pivot Point Trading Triggers : Chapter 5. Pivot Points ]
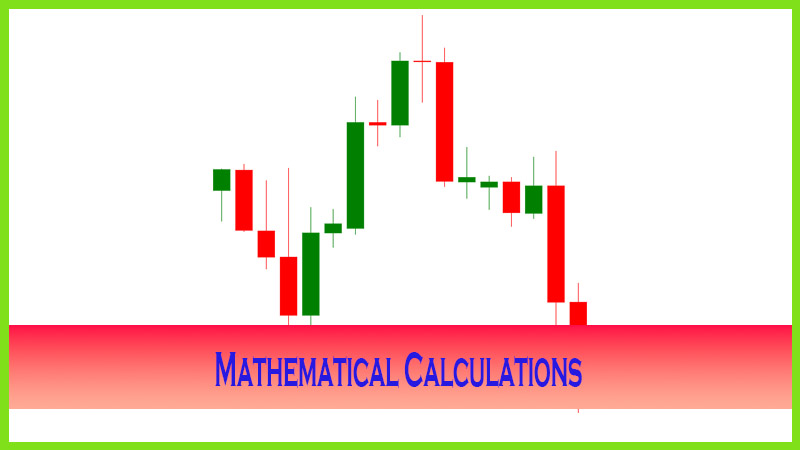
Pivot point is a mathematical formula designed to determine the potential range expansion based on a previous time period’s data, which include the high, the low, and the close or settlement price.
MATHEMATICAL CALCULATIONS
Pivot
point is a mathematical formula designed to determine the potential range
expansion based on a previous time period’s data, which include the high, the
low, and the close or settlement price. One reason why I believe in using these
variables from a given time period’s range is that they reflect all market
participants’ collective perception of value for that time period. In the
beginning of the book, I quoted Jesse Livermore: “The patterns the traders and
technicians observe are simply the reflections of human emotional behavior”
[Richard Suitten, Trade Like Jesse Livermore (Wiley, 2005, p. 70)]. The range,
which is the high and the low of a given time period, accurately reflects all
market participants’ exuberant bullishness and pessimistic bearishness for that
trading session. The high and the low of a given period are certainly important
as they mirror human emotional behavior. Also, the high is a reference point
for those who bought out of greed, thinking they were missing an opportunity;
they certainly won’t forget how much they lost and how the market reacted as it
declined from that level. The opposite is true for those who sold the low of a
given session out of fear that they would lose more by staying in a long trade;
they certainly will respect that price point the next time the market trades
back at that level. So the high and the low are important reference points of
interest. With that said, pivot point analysis incorporates the three most
important elements—the high, the low, and the close—of a given trading session.
THE LEADING INDICATOR
The
definition of the pivot point is the average of the high, the low, and the
closing price. Pivot point analysis is mainly used as support and resistance
levels. The pivot point is the heartbeat of the analysis; without it, projected
ranges and market condition cannot be determined. It does act as a support or
resistance level as well. Pivot point analysis helps as a leading price
indicator for traders because it gives traders advanced indication of potential
highs or lows or, in some cases, both in a given time period, unlike Fibonacci
studies, where there is no predicted time period in which a projected price
correction or projection will occur. I want to step up the concept so that you
can develop a trading system on some powerful setups and on what triggers a
trade. As I disclosed, professional stock, forex, and futures traders have had
significant success in utilizing these “hidden lines”; and
I think that with a more thorough understanding of the concept, so will you.
As a
quick review, one of the main benefits for using pivot point calculations is
that they help determine when to enter and when to exit positions. As a trader,
you already know you can only book a profit when you exit; and if you don’t exit
a losing trade quickly, it is hard to maintain, or keep, what you have already
made. Pivot points are used to project support and resistance or actual highs
and lows of trading sessions. These numbers are derived from a mathematical
formula; there are several versions that, for your benefit, I will go into; but
keep in mind that I still use the most common method to derive my analysis.
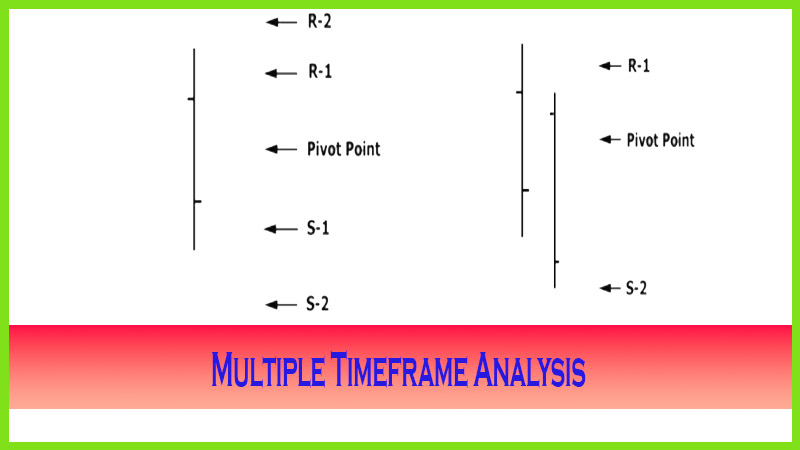
Here are the most common formulas:
- Pivot
Point—the pivot point (P)
is the sum of the high (H), the low (L), and the close (C) divided by three.
P = (H + L + C)/3
- Resistance
Level 2—R-2 is the pivot
point number plus the high and minus the low.
R-2 = P + H - L
- Resistance
Level 1—R-1 is the pivot
point number times two minus the low.
R-1 = (P x 2) - L
- Support
Level 1—S-1 is the pivot
point number times two minus the high.
S-1 = (P x 2) - H
- Support
Level 2—S-2 is the pivot
point number minus the high plus the low.
S-2 = P - H + L
Some
analysts are adding a third level to their pivot calculations to help target
extreme price swings on what has occurred on such occasions as a price shock
news-event-driven market reaction. It seems that I have noticed that the spot
forex currency markets tend to experience a double dose of price shocks because
they are exposed to foreign economic developments and U.S. economic
developments that pertain to a specific country’s currency. This tends to make
wide trading ranges. Therefore, a third level of projected support and
resistance were calculated
Resistance Level 3-R-3 = H + 2 x (Pivot - Low) or (P -
S-1) + R-2
Support Level 3-S-3 = L - 2 x (High - Pivot) or P -
(R-2 - S-1)
There are
other variations that include adding the opening range, in which case you would
simply find the sum of the open, the high, the low, and the close; and then
divide it by four to derive the actual pivot point.
P = (O + H + L + C) /4
One more
variation of that concept—to factor in gaps from adverse price moves from one
day to the next is to take the previous session’s high, low, and close, add in
the new trading session’s open, and then add in those variables and divide by
four. In using both open prices, you still calculate the extreme support and
resistance levels with the same formulas.
P = (new O + old H + old L + old C) /4
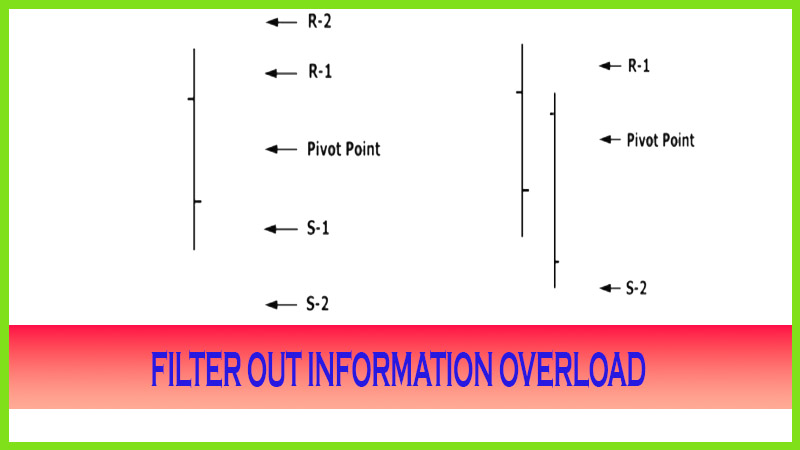
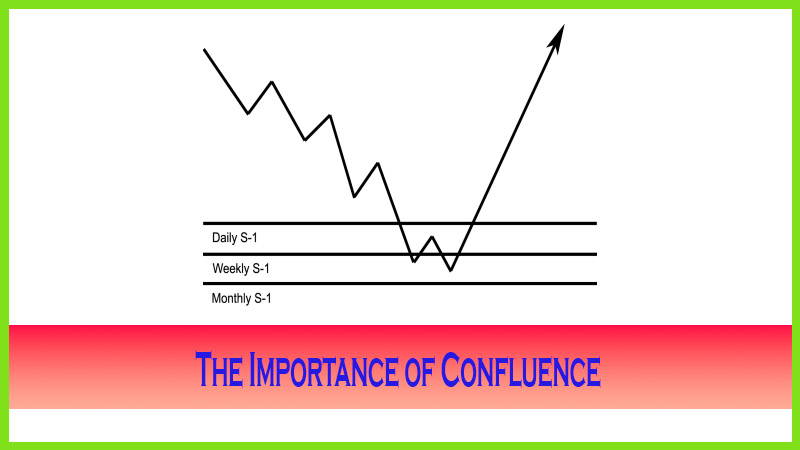
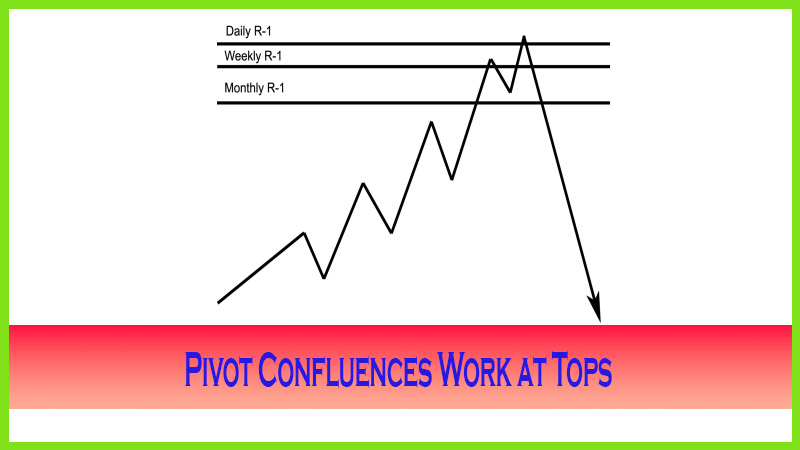
Let’s go
over what these numbers mean and how price action reacts with these projected
target levels. But first, let me state that I personally do not use the R-3 or
S-3 levels because I believe in looking at the progressively higher time
period’s price support or resistance projections. For example, from the daily
numbers, I would look at the weekly numbers, and then from the weekly numbers I
would look at the monthly numbers. The longer the time frame, the more
important or significant the data. Also, it is rare that the daily numbers will
trade beyond the extreme R-2 or S-2 numbers; and when the market does, it is
generally in a strong trending condition, in which case we have methods to
follow the market’s flow, which we will cover in the next few chapters. By
focusing in on just a few select numbers and learning how to filter out excess
information, I eliminate the analysis paralysis from information overload. Do
yourself a favor and keep reading because this does get exciting. The following
list shows how the numbers would break down by order, what typically occurs,
and how the market behaves. Keep in mind that this is a general description.
You will learn what to look for at these price points in order to spot
reversals so you can become more profitable from trading in the markets.
- Resistance
Level 3—Extreme bullish
market condition generally created by news-driven price shock. This is where a
market is at an overbought condition and may offer a day trader a quick
reversal scalp trade.
- Resistance
Level 2—Bullish market price
objective or target high number for a trading session. It generally establishes
the high of a given time period. The market often sees significant resistance
at this price level and will provide an exit target for long positions.
- Resistance
Level 1 —Mild bullish to
bearish projected high target number. In low volume or light volatility
sessions or in consolidating trading periods, this often acts as the high of a
given session. In a bearish market condition, prices will try to come close to
this level but most times fail.
- Pivot
Point—This is the focal
price level or the mean that is derived from the collective market data from
the prior session’s high, low, and close. It is the strongest of the support
and resistance numbers. Prices normally trade above or below this area before
breaking in one direction or the other. As a general guideline, if the market
opens above the primary pivot, be a buyer on dips. If the market opens below
this level, look to sell rallies.
- Support
Level 1—Mild bearish to
bullish projected low target number in light volume or low volatility sessions
or in consolidating trading periods. Prices tend to reverse at or near this
level in bullish market conditions but most times fall short of hitting this
number.
- Support
Level 2—Bearish market price
objective or targeted low number. The market often sees significant support at
or near this level in a bearish market condition and is a likely target level
to cover shorts.
- Support
Level 3—Extreme bearish
market condition generally created by a news-driven price shock. This level
will act as the projected target low or support area. This is where a market is
at an oversold condition and may offer a day trader a quick reversal scalp
trade.
Most of
the research and books written on technical analysis cover the topic of trade
entry and how to use indicators, oscillators, and moving average studies. Few
go over how to target exits. Longer-term traders have read the works done on
volume analysis to help determine the strength or the weakness of a trend.
There is further information on consensus studies, such as the Commitment of
Traders (COT) reports; the VIX, which is a volatility index, is based on
calculations using options on the Standard & Poor’s (S&P) 500 Stock
Index. Plus, the put-to-call ratio helps give investors an idea if a trend is
ready to change. None of these studies actually helps a trader with targeting a
potential trading range in a given time period. That information will help a
trader with setups and triggers on entering a position and, most important,
exiting a position. This is where pivot point analysis will help you.
Think for
a moment: If most technical tools are lagging indicators and if most traders
follow and use these trading indicators to make trading decisions, then it
would make sense that most traders get trading signals and execute entering
into a position on a lagging basis or well after a move has been established.
Then, if the same indicator gives the exit signal too late, perhaps that is
what perpetuates habit or the consistency of losing money in the markets, from
entering or exiting later, based on lagging indicators.
Then, in
order to adjust getting in too late, traders anticipate a market turn; and more
times than not, that turns out to be a bad trading decision. Or traders may
decide to just “hang in there” a while longer, thinking that the market may
just return and give them back the sweet profits that were just accumulated in
the trade. That is a syndrome that many traders tell me they fell victim to. By
using pivot point support and resistance levels, you can speed up the
analytical process on entries; and by employing certain trade management
techniques that we will go over in a later chapter, you can effectively help
improve your exits. After all, that is one of the most important aspects of
trading. A profit is just a paper asset until a position is offset. The offset
relies on an exit strategy. Ask yourself this question: How many times have I
been in a trade and thought I was doing the correct thing by letting my winners
ride, by holding on to the position only to see my paper profits erode and then
perhaps turn into a loss? The flip side to this is: How many times have I taken
a quick profit, banked the money, and no more than a few moments later watched
the market explode dramatically further in the direction of my original
position? Just when you say the market can’t move any further, that’s when it
usually does. You need discipline and patience to stay with a trade. These
situations will likely happen; but by utilizing pivot points and by watching
the market’s behavior at or near these levels, you will be better prepared to
make better trading decisions, especially on exits.
The Candlestick and Pivot Point Trading Triggers : Chapter 5. Pivot Points : Tag: Candlestick Pattern Trading, Forex, Pivot Point : Pivot Point indicators, Support level calculations, Resistance level calculations, pivot point analysis - Indicators Mathematical Calculations