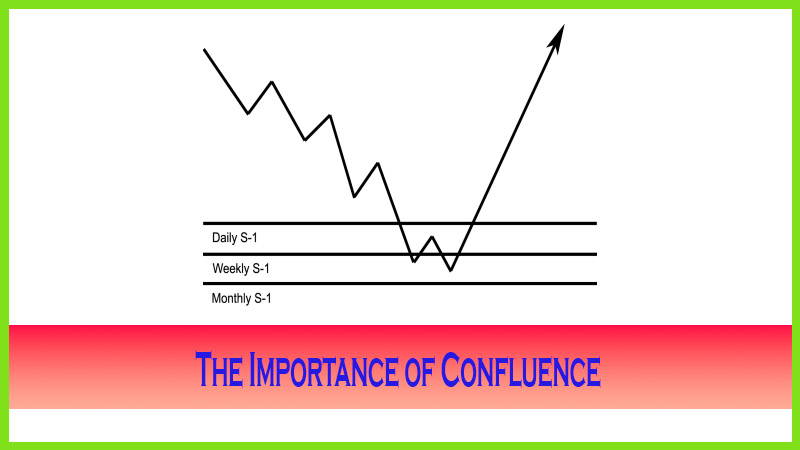
The Importance of Confluence
Time and Price, different time periods, Pivot calculations, pivot point analysis
Course: [ The Candlestick and Pivot Point Trading Triggers : Chapter 5. Pivot Points ]
Time is an essential element in trading. There are many instances when traders are correct in their predictions for a top or a bottom in a market; but they are off in their timing, which results in a loss.
THE IMPORTANCE OF CONFLUENCE
Time is
an essential element in trading. There are many instances when traders are
correct in their predictions for a top or a bottom in a market; but they are
off in their timing, which results in a loss. Many analysts were calling for a
top or for the bubble to burst in the stock market in 1999. In that situation,
not demonstrating patience to wait would have resulted in dramatic loss of
profit potential or worse, actual losses due to selling short stock too early.
How about economists’ predictions of a housing bubble back in 2003 and their
expectations for a decline in real estate prices? By July 2006 we had started
to see prices go back down but not to the severity as was predicted and
certainly not at the time that was expected by economists. I can go on and on
with examples when prognostications were correct, but timing was really wrong,
resulting in a financial loss.
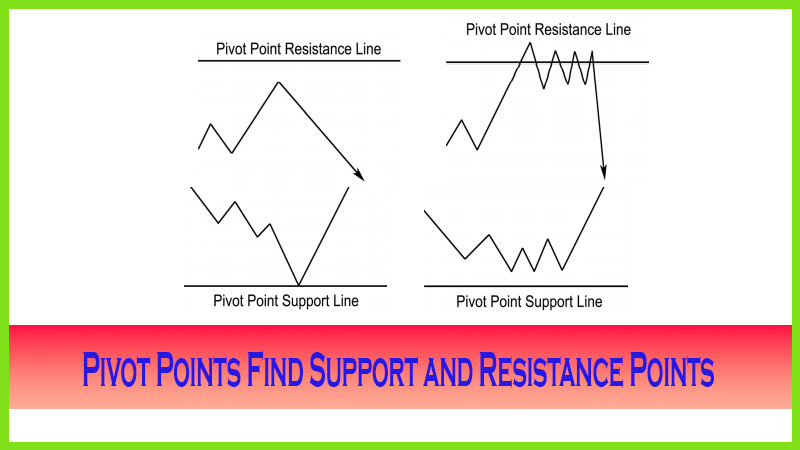
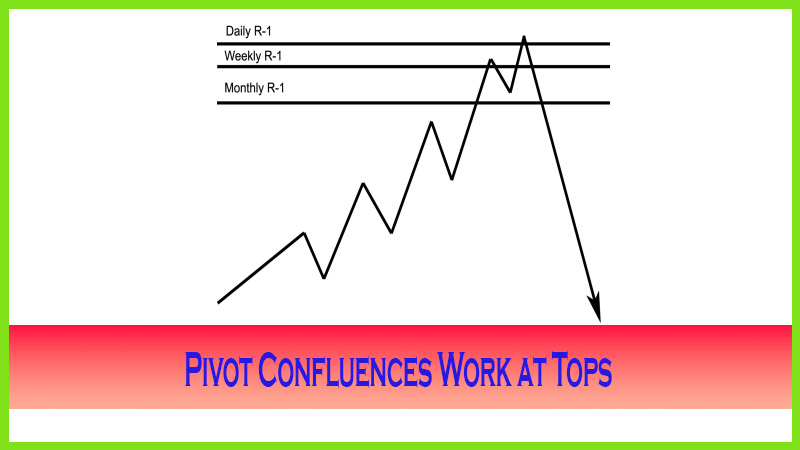
Time and Price
As I
stated earlier, pivot point analysis relies on both time and price specifics in
its calculations to project future support and resistance levels. By
incorporating price data for various time frames, such as daily, weekly, and
monthly, the more price areas that coincide with the different time periods,
the greater is the likelihood that these price clusters will repel the market’s
advance in an uptrend or cause prices to reverse in a downtrend. This
clustering, or confluence, from more than one time period that convergences
with another is an awesome event and can translate into a very lucrative setup.
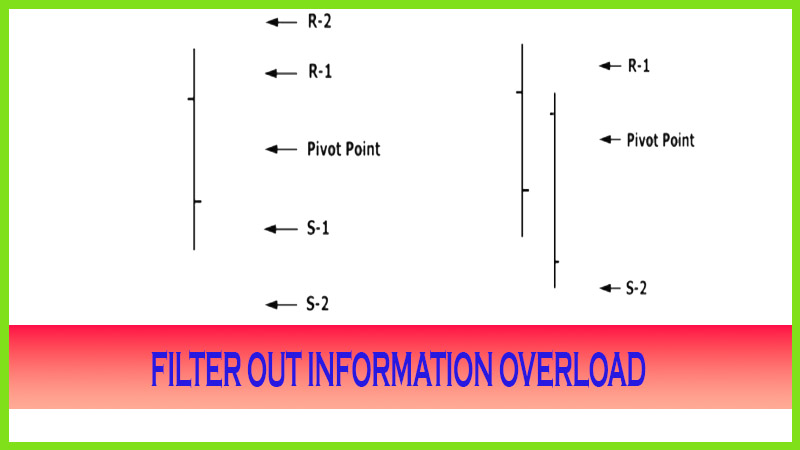
The time frames of numbers that target a specific price level is termed
confluence; in other words, the more corroborating numbers that target a
general area, the greater is the significance of that specific targeted price
level. Pivot calculations work to pinpoint almost exact times and prices for
trades in various markets and can be used to validate other analysis. Remember
this phrase: “There
is always strength in numbers!” The
more pivot numbers that line up, the greater is the potential for a reaction
off those levels. This knowledge, combined with identifying the shift in
momentum by identifying and acting on strong triggers, increases the probability
of a successful trade.
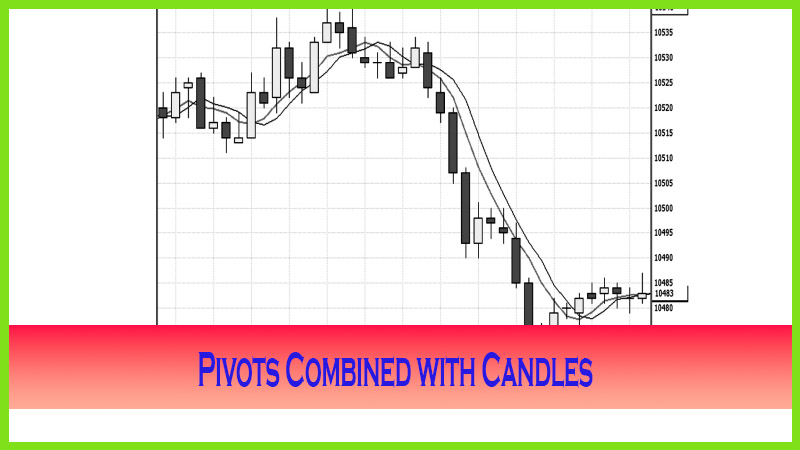
As an
example, Figure 5.14 shows the daily, weekly, and monthly pivot point numbers
drawn across the chart; this gives a trader a heads up that the market may
reach an unsustainable extreme or oversold market condition. Just by looking at
the graph, you can see that the market has been in a prolonged downtrend.
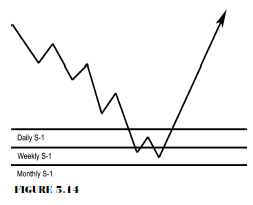
Generally, the market may stop its descent at
a confluence support zone; then you would want to wait for a shift in momentum
to trade a potential price reversal. When the market starts to give clues as to
a bottom, you can determine a low-risk entry, as a bottom has been defined.
What would not be known is how high the market’s reaction will be off this
target level of support. This is where the candle chart section will play an
important role in helping to determine the strength of the trend’s reversal.
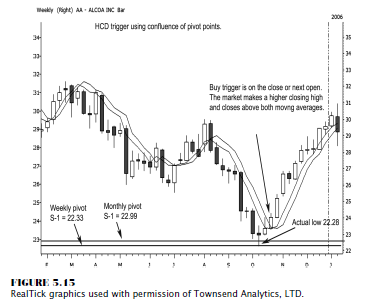
In Figure
5.15, we have a weekly stock chart on Alcoa. Here we see a confluence of two
higher-degree time periods, such as the weekly and monthly support numbers.
What is uncanny is that the weekly pivot S-1 target low number was 22.33, with
the actual low coming in at 22.28, just pennies below the pivot support number.
The monthly number lined up a little higher than that at 22.99, which is a
slightly wider margin of error. Remember, when I am trading, I am not looking
to catch a falling knife by anticipating a bottom, even though in this example
you could have placed a buy order at the weekly number; and as the price moved
through your buy order, you may have been filled—and that was a great buy.
However, the better course of action, and the more reliable method to trade off
this confluence area, was to wait for a confirmed buy signal, such as the high
close doji signal (we go over that in Chapter 7). Notice the moving average
crossover and that prices confirm a conditional change in the market by closing
above the open and closing above both moving average components. The true buy
signal was generated at 24.20, and the risk would be using a stop below the low
at 22.28.
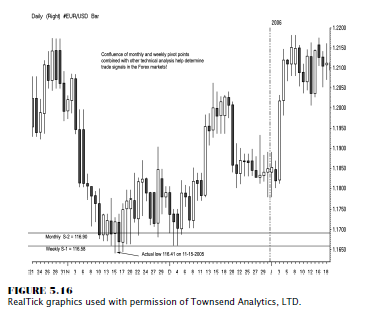
Volatility Is Good
As long
as there is trading volume—liquidity so you can enter and exit positions and
price movement, otherwise known as volatility—pivot point analysis will work in
any market for position traders and short-term day traders. No matter what your
choice is for a trading investment vehicle, it makes no sense that you would
not want to incorporate this methodology into your trading style. Let’s examine
the chart in Figure 5.16, which is a daily look at a spot forex euro currency
versus the U.S. dollar. The monthly S-2 target low was 116.90, the weekly S-1
lined up in close proximity at 116.58, and the actual low was 116.41. Looking
at the market’s reaction three days after the low, we see a bullish engulfing
pattern. The confluence of pivot support numbers gave one of the best and only
predictive support targets. Therefore, it should be noted that the longer-term
numbers should be watched carefully for clues not only for trading
opportunities to enter positions but also as a warning that the current trend
could be exhausted and potentially reverse. At the very least, you may not have
wanted to establish a long position; you certainly would have been alerted not
to sell short at the low.
Let’s
examine the 15-minute candle chart in the 30-year Treasury bonds (T-bonds)
shown in Figure 5.17. Once again, the market price scrapes against the lows,
and a hammer pattern forms the exact bottom. But notice that the weekly pivot
S-1 support target is 112%, which coincides with the daily S-1 support target
of 112%. The actual low was 114%! Notice that the market broke the daily
support but did not make much of a decline and certainly did not remain below
the support for a long period of time. That leads me to this point: There are
those who believe that once a support level is violated, you should go with
that breakdown momentum and sell short. That may work occasionally, but it
needs to be defined in more detail, with a list of special rules and certain
criteria in order for that to be an automatic trading rule for me to initiate a
trade. I believe that you should look for buy signals at support and for sell
signals at or near resistance, especially when there is a confluence of pivot
point price targets. It is more fruitful in buying the projected support, as
this example shows.
In Figure
5.17, we see a trigger to go long after the high close doji trigger is made at
112% (notice that the low was also formed by a hammer).
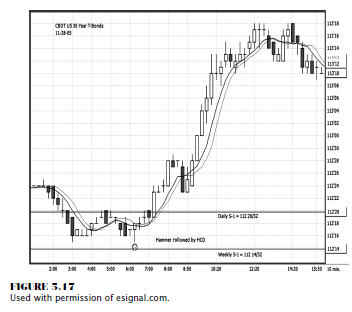
As the
market goes into trend mode and rallies nearly a full basis point higher, the
signal to liquidate occurs once we see prices change conditions. As the candles
indicate, prices are closing below each period’s open; a lower closing low from
a doji top occurs and the moving averages cross; and, finally, the market price
closes below both moving averages. That triggers the exit at 113%. This was a
28-point (each thirty-second is 31.25 per point) gain for $875.00 profit per
position on a day trade.
The Candlestick and Pivot Point Trading Triggers : Chapter 5. Pivot Points : Tag: Candlestick Pattern Trading, Forex, Pivot Point : Time and Price, different time periods, Pivot calculations, pivot point analysis - The Importance of Confluence