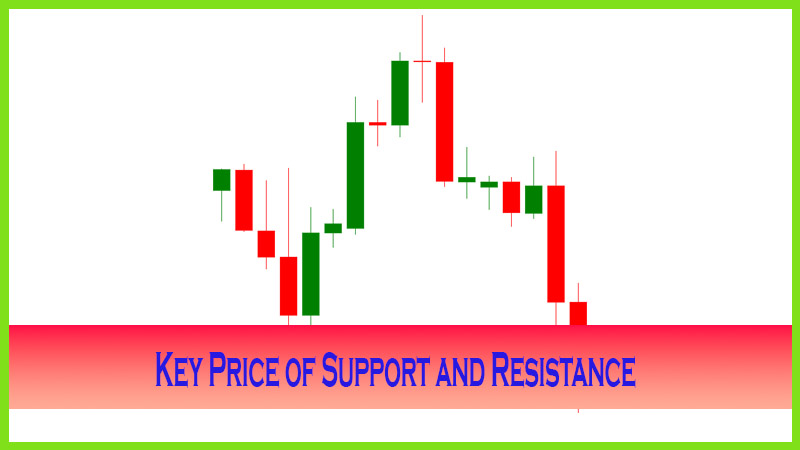
Pivots Combined with Candles Trading Strategy
pivots combined with candles in timeframe, Pivot Points Levels, best candle trading, Pivot Points trading
Course: [ The Candlestick and Pivot Point Trading Triggers : Chapter 5. Pivot Points ]
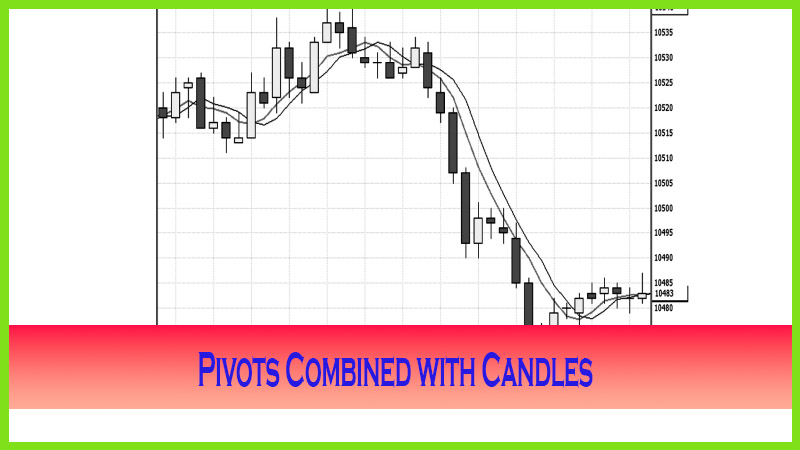
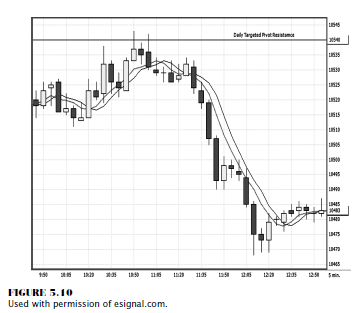
Notice how prices do penetrate briefly above the pivot targeted high by forming the shooting star candle. See the market’s reaction as the price declines over 70 Dow points (each point is $5 on the mini-Dow).
Pivots Combined with Candles
The CBOT mini-Dow is one of several great day trading futures products for selecting trades that connect with pivot and candle patterns as Figure 5.10 shows. Notice how prices do penetrate briefly above the pivot targeted high by forming the shooting star candle. See the market’s reaction as the price declines over 70 Dow points (each point is $5 on the mini-Dow). That is a $350.00 move in less than 75 minutes per contract. Since most futures firms carry a $500.00 day trade margin per contract that translates into a healthy return. Now that we know how to line up the numbers, we need to wait for a setup or signal to trigger a short position. The shooting star, the moving average crossover, and the dark candles all confirmed a technical signal to sell.
The graph
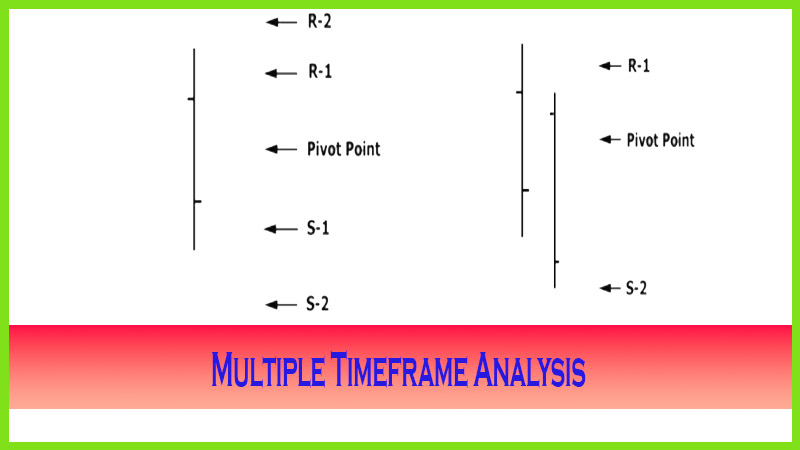
in Figure 5.11 represents the e-mini-S&P 500 Stock Index Futures on
November 10, 2005; the targeted range was determined to be S- 1 and R-2, a
bullish market condition. The actual low of the day was formed by a hammer
candle pattern (keep notes of what candle patterns form near tops and bottoms,
as we will be discussing this in detail in later chapters). A buy signal is
triggered with the sequence of higher highs and higher lows but, more
important, higher closing highs, as well. The moving average crossover also
helps trigger a long buy signal. The market rallies right up within a tick or
two of the R-2 number. As a day trader, it is great to have a predetermined
exit strategy. In this case, pivot point analysis accommodated you in that
respect. Other times, you will need to rely on your timing to exit a trade; for
example, as a day trader, once the market is near the close of the business
day, you should be offsetting your position. In the example in Figure 5.11, you
had a timing and a price element working for you to help target an exit on what
was a beautiful trade. The trigger to go long was after the crossover of the
moving average one candle after 11:30, as prices established a higher closing
high.
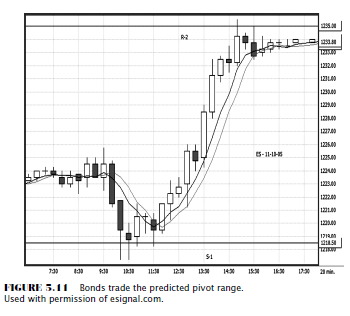
This trade would have resulted in a
stellar 12.50-point gain from the entry of 1221.50 up to the exit, which was
1233. The exit was triggered on the first lower closing low and was confirmed
by a close back under the moving averages. On a day trading margin per contract
in the e-mini-S&P of $1,000 (brokerage firms vary on day trading margins),
you picked up 625.00 per position.
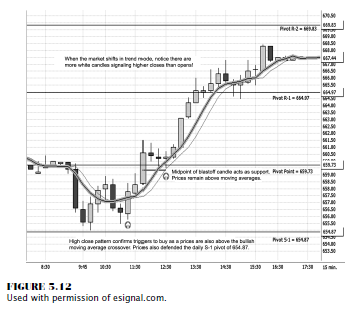
The next
chart I want to show you in Figure 5.12 is an example of how a market, when
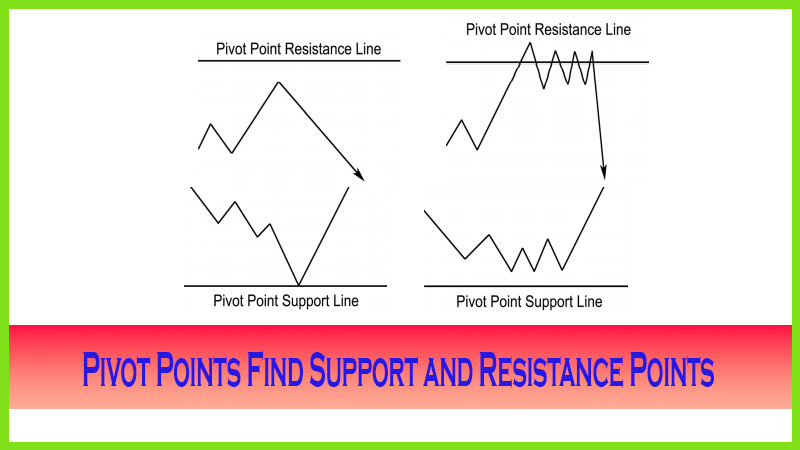
targeted to be in a bullish mode, interacts with the series of pivot support
and resistance numbers. If there is a bullish bias, then S-1 up to R-2 will be
the potential range. Therefore, we are looking to take buy signals at support
and have a profit objective in mind near R-2. This is a 15- minute candle chart
using the mini-Russell Stock Index futures. Notice that as the market trades
near the pivot support of S-1, prices consolidate for almost two hours before
triggering the buy signal as a higher closing high and a crossover of the
moving averages confirm the trigger to go long at 657.50.
Prices
penetrate the R-1 level and come close to the projected S-2 level. As the
trading session ends, you still have no reason to exit the position from a
technical standpoint except that as a day trader, your time is your exit point.
This trade was good for nearly a 9.50-point run, or $950 per contract.
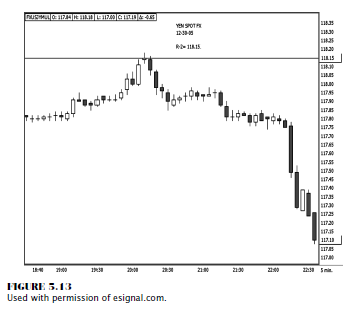
Let’s
look at a spot forex market in Figure 5.13. We are looking at the yen versus
the U.S. dollar. The targeted resistance was the R-2; and as you can see, the
top was formed by an evening doji star formation, based on a five-minute candle
chart. Combining the knowledge of how to determine the right pivot level with
practicing the discipline to wait for a signal will certainly help you target
and select better trading opportunities. As you can see in this chart, on a
$100,000 lot size, you would have realized over a 100-point gain in less than
two and a half hours. That translates to $1,000 per lot or contract.
Special
note: Big moves do occur in forex during the U.S. night time. This trade signal
hit at 20:00 hours, or 7 p.m. (ET). So depending on your trading capital and
time constraints during regular market hours, the potential opportunities that
abound in the spot currency markets may be suitable for you to take advantage
of.
The Candlestick and Pivot Point Trading Triggers : Chapter 5. Pivot Points : Tag: Candlestick Pattern Trading, Forex, Pivot Point : pivots combined with candles in timeframe, Pivot Points Levels, best candle trading, Pivot Points trading - Pivots Combined with Candles Trading Strategy