Multiple Timeframe Analysis Trading Strategy
multiple time frame analysis for day trading, multiple time frame analysis indicator, multiple time frame analysis in forex trading,
Course: [ The Candlestick and Pivot Point Trading Triggers : Chapter 5. Pivot Points ]
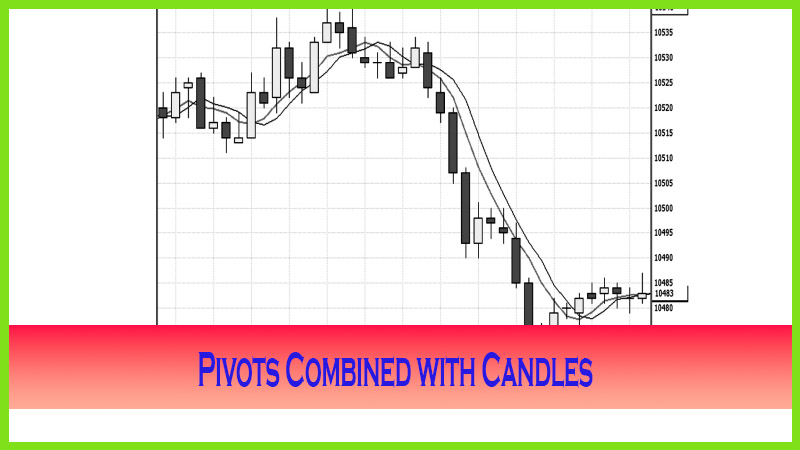
Daily, weekly, and monthly time frames can and should be utilized as well. To understand how price moves within the pivots, begin by breaking down the time frames from longer-term to shorter-term.
MULTIPLE TIME FRAME ANALYSIS
Daily,
weekly, and monthly time frames can and should be utilized as well. To
understand how price moves within the pivots, begin by breaking down the time
frames from longer-term to shorter-term. So start with a monthly time frame,
for which, as you know, there is a price range, or an established high and low
for that given period; so we should be watching these predictive price points
as well. Think of this: There are approximately 22 business days, or about four
weeks, in every month; and each month, there will be an established range a
high and a low. In a week, there are typically five trading days. Now consider
that on one day of one week in one month, a high and a low will be made. It is
likely that the high and the low may be made in a minute or within one hour of a
given day of a given week of a given month. That is why longer-term time
frames, such as monthly or weekly analysis, should be included in your market
analysis. It is also the reason why I do not use the R-3 or the S-3 targets. I
rely more on the longer-term time frames targeted support and resistance
levels. Pivot point analysis relies on data from specific time frames in order
to determine support and resistance levels for the next particular trading
session. It is productive and both time- and price-sensitive information.
The
analysis or calculations for the prior day, week, or month may not be
applicable two or three sessions later. At the end of each time period, data
will need to be recalculated. The exception to this rule is that if there is a
time period after a wide-range session that is a smaller range, then I would
keep the data from the session with the wider range in mind for another one or
two trading periods. For example, using a daily analysis, if Tuesday had a wide
trading range and then Wednesday had a small range, I would keep the targeted
support and resistance numbers derived from Tuesday in mind for Thursday’s
session. The same principle applies to a week or a month.
In the
world of 24-hour trading, the most popular question I get from those studying
and using pivot points is, “What are the times that you derive the
high-low-close information from?” There are many different people telling many
different stories. Here is what I do and what seems to work best. For starters,
just keep things simple and apply some good old fashioned common sense. If the
exchanges and the banking system use a specific time to settle a market, then
that is the time that you should consider a close. The exchanges and banks
should know—their rules make the money move. I want to follow the money flow.
- Stock traders use the settlement price from the close of business at 4 p.m. (ET).
- Forex traders should use the 5 p.m. (ET) New York bank settlement close.
- Futures traders, in the e-mini-S&P, Nasdaq, and Russell contracts, use the close of 3:15 p.m. (CT). For the Chicago Board of Trade (CBOT) mini-Dow contract, I take the close at 4 p.m. (CT).
- For the weekly calculations, take the open from Sunday night’s session, and use the close on Friday.
- For the monthly calculations, take the open from the first day of the month, and use the close of the last day of the month.
We have established the reasons why we use all sessions for extracting the range, or high and low, and what time periods constitute the closes. We know where and how and when.
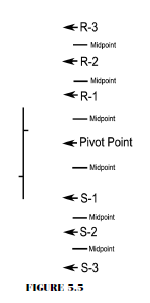
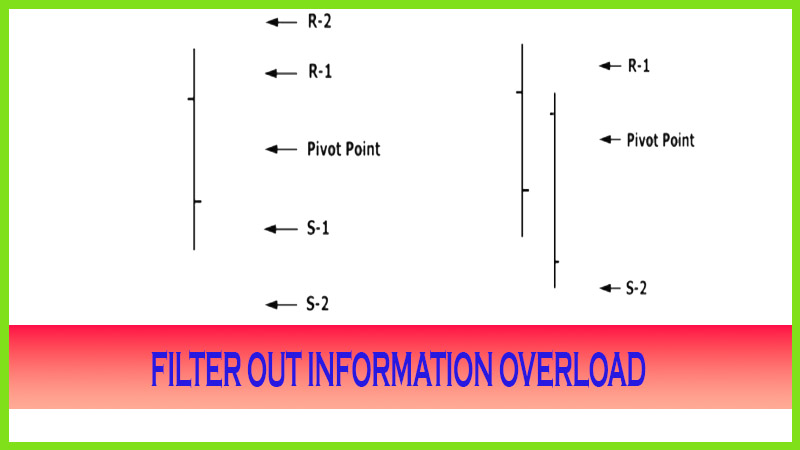
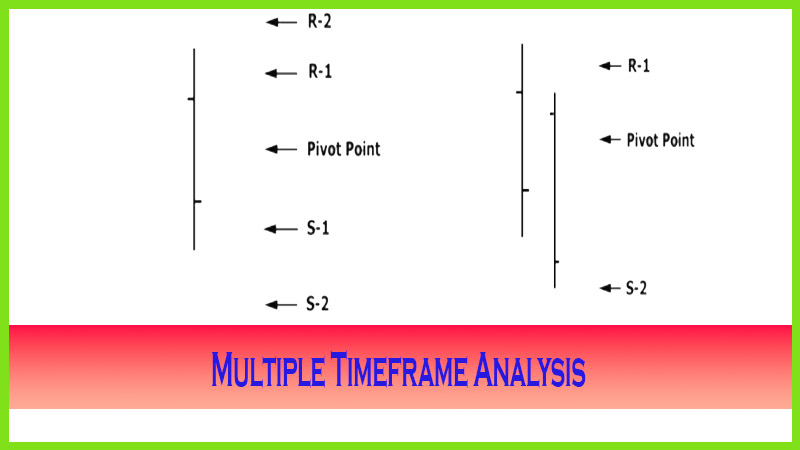
Now,
let me show you what pivot point projected
supports and resistance line up to look like. In Figure 5.5, we have a good
representation of how the R-3 down to the S-3 levels would line up based on a
previous session’s high, low, and close data. The hash marks between each level
are the midpoint numbers. As you can see, this presents 13 price points to
monitor. To most traders, including myself, this is simply information
overload. If you include using these 13 levels for each day, week. and month,
that would put 39 trading support and resistance numbers on your chart for each
trading day. That could cause a trader to possibly go blind or, at the very
least, could create analysis paralysis. Granted, you may be right in stating
that you picked the top or the bottom of each trading session, but it is
impractical or highly unlikely that you can trade off that information. I am not
saying that at times it may help having the mid points or R-3 or S-3 target
levels in front of you; I just believe in keeping things simple, and less is
better.
The Candlestick and Pivot Point Trading Triggers : Chapter 5. Pivot Points : Tag: Candlestick Pattern Trading, Forex, Pivot Point : multiple time frame analysis for day trading, multiple time frame analysis indicator, multiple time frame analysis in forex trading, - Multiple Timeframe Analysis Trading Strategy