Pivot Confluences Work at Tops
Time and Price, different time periods, Pivot calculations, pivot point analysis
Course: [ The Candlestick and Pivot Point Trading Triggers : Chapter 5. Pivot Points ]
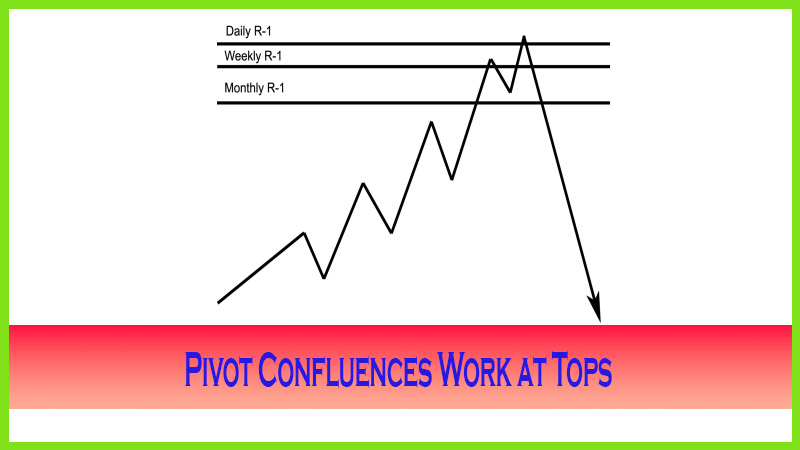
the power of pivot point confluences does work at market tops as well as working to indicate bottom reversals, as we just went over.
CONFLUENCES WORK AT TOPS
We have
all heard in the field of technical analysis that what works for some patterns
or signals is not applicable for all situations. However, the power of pivot
point confluences does work at market tops as well as working to indicate
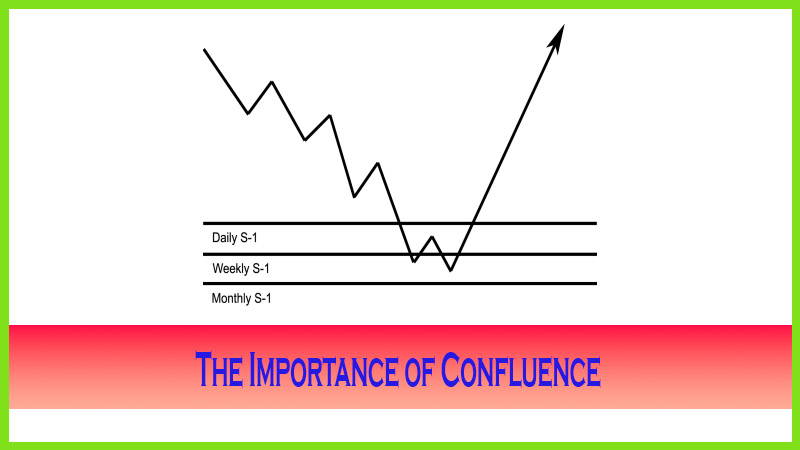
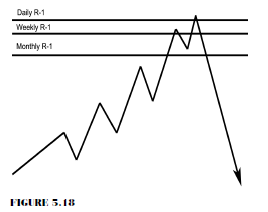
bottom reversals, as we just went over. In Figure 5.18, once again the three
main time periods that we use are the monthly, the weekly, and the daily. When
a congestion of pivot numbers line up, or cluster, near a specific price zone,
this heightens your awareness for possible reversals.
It is important to note that if a market has
been in a long uptrend, say for more than two months, and if the end of the
quarter is near, the market is ripe for a profit-taking correction. Generally
speaking, professional trading managed funds receive payment by a performance
fee (profits) at the end of a quarter. Since many of these large trading
entities use pivot analysis or are aware that others use them, when a
confluence of resistance develops, especially near the end of a quarter, look
out below. It not only marks a prime price level but also indicates a specific
reason why a profit-taking correction can occur at that time period. The same
holds true for bottoms. After a long price decline, if the numbers line up and
if it is near the end of a quarter, a profit-taking reversal could be in the
works. That does not mean to say that the original trend won’t resume, but you
could take a great countertrend reversal trade. Generally speaking, market
sell-offs have more velocity; therefore, spotting resistance confluences can
result in very lucrative opportunities, under the right circumstances.
Earlier,
I explained the saying “There is always strength in numbers.” The concept can be explained further in that
there is a strong analytical value found in the number three, not just in
trading and technical analysis but also in our universe. As you may be aware,
the number three is a Fibonacci number; and when I look at confluences in the
three different time periods, “three” represents
the three different groups of traders. The daily numbers are used by day
traders, the weekly numbers are used by swing traders, and the monthly numbers
are used by longer-term position traders and institutions. Even in the Commodity
Futures Trading Commision (CFTC) COT report, there are three classifications of
traders: reportable, commercials, and non-reportable.
The
number three is a highly correlated number in market analysis. The coincidental
factor in pivot point analyses derives from the fact that one set of numbers from
one time frame generally has nothing to do with another. If you look at the
data for the Japanese yen spot forex data in Table 5.1, you will see that the
high and the close of the week coincided with the daily high and close, as that
was on a Friday.
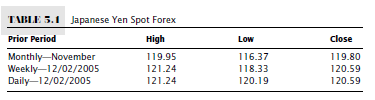
Let’s
look at Figure 5.19 and see how the numbers in the spot forex Japanese yen line
up. The market made a tremendous price move from the low of 108.76 on September
5, 2005, until the high was made on December 5, 2005, at 121.40.
Let’s
review before we go further. If you recall in Chapter 1, I stated that forex
traders can borrow information from the futures industry. One such piece of
data is the CFTC Commitment of Traders report. In essence, this report reveals
whose hands “control” the market. Except for the yen, all currencies
are quoted as the currency versus the U.S. dollar. The yen futures are quoted
as the opposite—as the spot forex markets. So spot forex would quote the yen as
117.35; the futures quote would be 0.8572. What this means is that when the
CFTC report shows a net short position, traders are in a long position in the
spot yen forex markets against the dollar. As the CFTC report showed at the end
of the trading session as of 11/29/2005, the funds, or the “non-commercials” ,were long
22,626 contracts and short 86,626. That is a net short position of 64,000
contracts. Each contract is worth of yen! The “commercials” were long 154,396
contracts and short 85,604 positions. The small speculators were long 29,368
contracts and short 34,160 positions. This means the banks, or “smart money,” established a protective hedge position in the
futures, betting that the spot yen would fall in value against the dollar. Keep
in mind that the non-commercials are considered professional speculators; they,
too, are considered the smart money. The difference is that they are
speculating and will not generally take delivery of a futures contract, which
is 1,250,000 worth of Japanese yen.
If we
examine Figure 5.19 closely, we notice that after a substantial price
appreciation in a relatively short period of time, prices hit just past the
monthly R-1 of 121.04. Remember that the low on September 5, just three months
earlier, was 108.76. So the market made a huge up move, and the banks and
institutions or commercials were betting prices would fall. The ends of the
year and of the quarter were closing in, and we were hitting up against a
confluence of pivot point resistance. The weekly R-1 was 121.77; and on the day
the actual price high occurred at 121.40, the daily pivot R-1 was 121.16. When
we combine the pivot point resistance levels with a few bearish candle
patterns, such as the rickshaw doji that formed the day before the high or the
trigger to initiate a sell that occurred on the third day after the target high
was made you have a high chance to see a negative market reaction on price
reversal. Market tops that align with a cluster, or confluence, of various
pivot points can result in tremendous market reversals, as this example shows,
especially as they coincide with a major consensus reading toward the end of
the quarter.
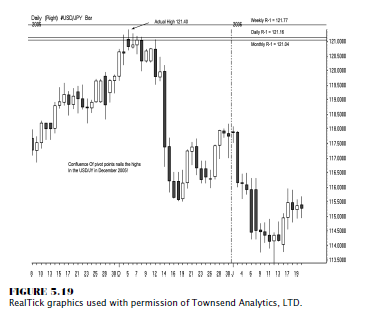
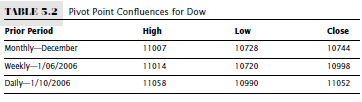
The power
of a sell-off does not necessarily have to occur near the end of a quarter. In
equities, end-of-year tax-loss selling prevails; and at the first of the new
year, as pension funds are buying stock, others are looking to cash out their
profits for tax deferment purposes. As the Chicago Board of Trade (CBOT)
mini-Dow chart in Figure 5.20 shows, the monthly target resistance R-2 was
11105, the weekly R-1 was 11101, and the daily pivot target number was 11076 on
1/11/2006.
The exact high was 11086! That top marked a
413-point decline, as the low was 10673 just six trading days later. The power
of pivot point confluence from the prevailing three time periods demonstrated
that there was significant resistance; and the actions of the three groups of
traders may have joined together in identifying that area as a spot to sell. In
Table 5.2, we see that the data collected to determine the pivot point
resistance levels from the three time frames were all non-correlated to some
degree. The closing, or settlement, prices all had different values, as did the
highs and lows of each time frame. The purpose for identifying a confluence
zone is to heighten your awareness that a potentially substantial move may be
on the horizon and that a bigger reversal reaction may occur, giving a trading
opportunity longer than a day trade. Once you identify an opportunity, you can
apply a strategy. In this case, you might have been able to make a choice among
selling Dow futures, buying put options on the futures, or selling the exchange
traded fund (ETF) diamonds.
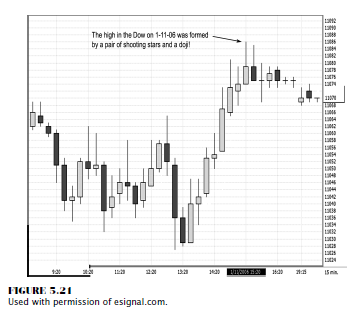
In fact,
let’s look at the actual chart pattern on that day to see what occurred. In
Figure 5.21, the date and time are stamped at the bottom of the graph; and you
will see we have a 15-minute candle chart showing that the high was made at the
end of the day, formed by a pair of shooting stars followed by a doji.
These
candle formations are very ominous signs indicating a bearish tone; but, due to
the end of the trading day, it hardly makes for a trading opportunity for a day
trader to take a short position. However, the data did give a trader a great
opportunity to look at a profit objective from an earlier long position, as the
confluence of pivot point resistance levels and the candle patterns confirmed
that the bullish momentum was fading.
In
addition, once the market confirmed a top pattern, the day trader would be able
to shift his or her trading plan from buying breaks to taking selling
opportunities as the trend conditions changed and there was overhead pivot
point resistance.
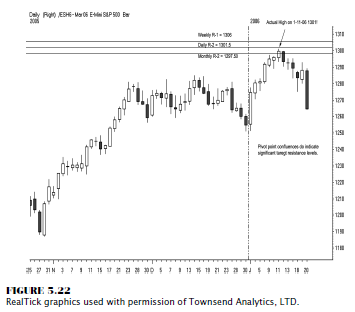
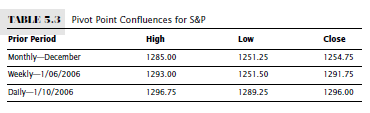
Looking
at Figure 5.22, we see how the pivot points from the three time frames (daily,
weekly, and monthly) target the high near the 1300 level. The actual high was
1301.
In Table
5.3, you can see that the three sets of data (high, low, and close) from three
different time periods are different values.
So the
coincidental factor really highlights the importance of pivot point
confluences.
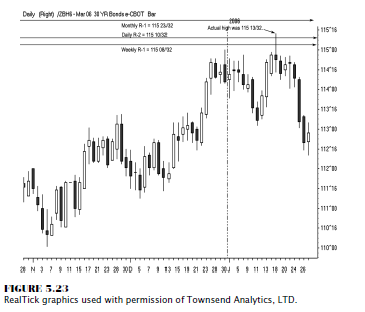
In Figure
5.23, the confluence of pivot points in the CBOT 30-year bonds shows a setup
similar in resistance levels to both the S&P and the Dow in the examples in
Figures 5.20 and 5.22 from the daily chart perspective. In fact, in this case,
the bonds peaked nearly at the same time as the equity markets. This is a great
point to bring up now; we will see periods in the market where inter-commodity
or intermarket relationships change. Stock and bond prices go in phases of
parallel price moves, and then there are periods in time where they decouple.
Generally speaking, when interest rates decline, bonds and stocks move higher.
Then there are times when stocks move sharply lower and bond prices move higher
because they offer security, which is known as a “flight to quality.” And then there was 2005, when interest rates were
rising and stocks and bonds moved in sync.
Knowing when these changes in market
relationships occur is helpful; however, it is best at times to trade the
markets independently of each other. This is where identifying pivot point
confluences based on two or three time frames will help you as a trader because
you have predetermined price targets figured out in advance.
As Figure
5.23 shows, the daily and weekly numbers were more accurate in determining the
top. The monthly number was slightly higher by 1032, a small margin of error.
The important element to remember here is that we are not looking to pick an
exact top; rather, we are looking for a reason and an area that offers a high
degree of accuracy in helping to pinpoint a top or a bottom and then looking
for a secondary signal to trigger, or initiate, a trade. The importance and
coincidental factor in the theory of confluences is once again that the numbers
derived from the various time frames are generally non-correlated. Table 5.4
shows that the high in December was from a different time period and had an
assigned value different from the weekly or daily number; and the same holds
true for the low and the closing values.
The
relationship that exists between geopolitical issues and economic conditions
(such as inflation, interest rates, foreign currencies, and gold) from a
historic perspective has been easy to track. In general terms, at times when
the dollar goes up in value, gold prices decline. When interest rates climb,
lease rates are more expensive, therefore putting downward pressure on gold.
Gold prices also move higher as investors buy gold as a safe haven investment,
as it acts as cash as well in times when doubt exists over the stability of a
country’s economic condition or when currency values change, as happened in the
middle of 2005 when dissention among euro zone countries existed and riots due
to political instability in France developed.
By late
2005, the dollar rallied as interest rates climbed, widening the interest rate
differentials between the United States and foreign countries. Gold rallied
sharply higher on these events, from the low on February 8, 2005, at 410 per ounce.
By the end of 2005, gold had made a high of 540 per ounce. By January 20, 2006,
gold continued its ascent by making a high at 568.50 in the February futures
contract.
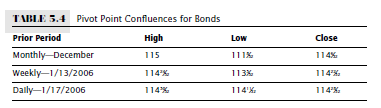
The
market had made a sharp rally, but the confluence of resistance numbers held the
market back, as shown in the 15-minute chart in Figure 5.24. In this chart, you
will see the bearish engulfing pattern form as the market makes a violent
reversal.
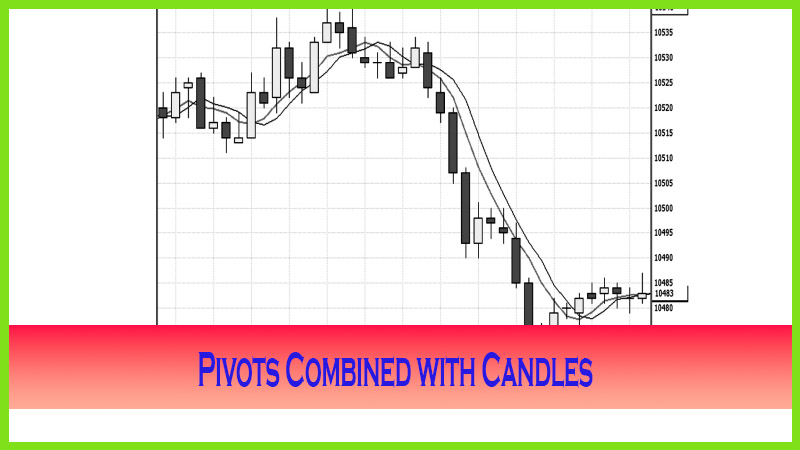
Longer-term
prices did recover and moved even higher as of the writing of this book. The
point is that by using pivot points combined with candle patterns, you can time
your entries and exits in the market for a better price point. That is an
outstanding advantage from a risk reward perspective.
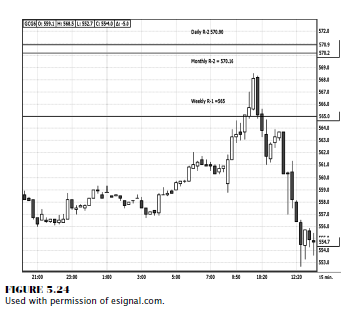
In this
example, prices did stall over time before continuing higher. However, the
weekly and monthly resistance targets kept prices in a consolidating pattern,
as you can see from the daily chart in Figure 5.25. It is interesting to note
that the exact high was formed by a shooting star pattern. The value in using
and identifying these confluence levels is that a trader/analyst/investor is
given both elements for successful trading: price objectives combined with a
specific time period. It is up to the trader to manage a trade or to identify
the magnitude of the reversal. Not all outcomes are the same, but the markets
do react off these numbers; so that is why we are looking to combine pivot
point analysis with another dimension of market analysis.
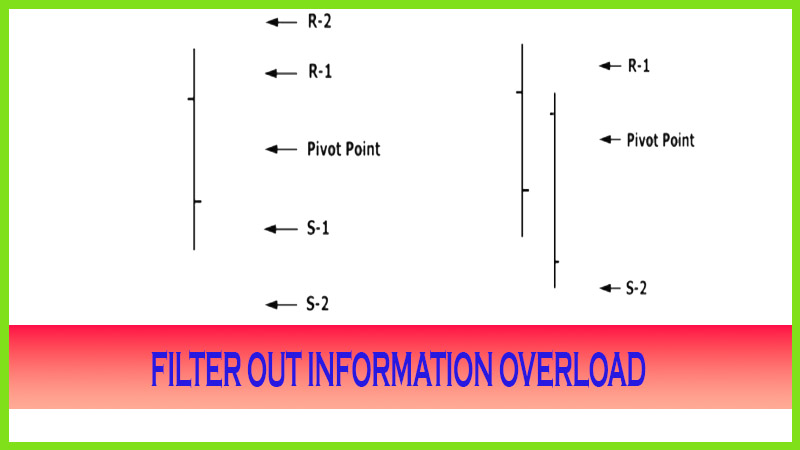
The
second part of the trading equation using pivot points is combining the idea of
how to filter the numbers to help identify which support or resistance numbers
to use to determine market condition. Remember we covered the fact that in a
bearish market condition, the actual pivot point would act as resistance.
Confluence,
or the cluster of support or resistance numbers, also works within a specific
time period. For example, when the actual pivot point lines up at or near the
market direction number or moving average of the pivot point and a resistance
target number, we should study that specific price zone for signals that
indicate a shift in momentum. This is the part where we need to comprehend what
the charts and price action are revealing.
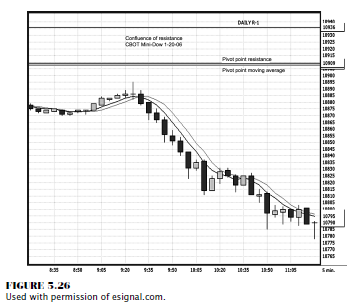
Candle
patterns do just that in a clear visual manner. As you look at Figure 5.26, you
will see that the exact high of the trading session on 1/20/2006 was formed by
a doji. A confluence existed with the lining up of the daily pivot point, the
market direction numbers, and the R-1. The market never even had the strength
to test the resistance levels. By the end of the day, the Dow fell another
100-plus points from the last price you see on this chart the low was 10673
that day. Once the low close doji signal occurred and the shift in momentum
occurred by making lower closing lows, a sharp sell-off developed.
The
September 2004 Active Trade Magazine published an article I wrote and made it a
cover story. It was on the power of pivot point confluence and how calculating
pivot points on more than one time frame can help identify certain price levels
that are likely to repel prices.
The
article (p. 68) was titled “Pivot Points and Right Side Chart Analysis.” You may have read that article or seen the
issue—it was the one with President Bush and Senator Kerry on the cover. The
article’s focus was on not only entry prices and risk management, but also
profit objectives and how to trade around the support and resistance numbers.
What was most interesting about that article was the fact that the confluence
of daily, weekly, and monthly numbers lined up near 1160 (see Table 5.5) and
the exact high for March 5, 2004, was 1163.50.
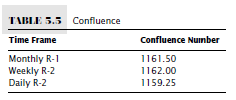
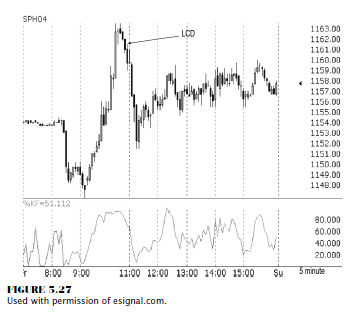
The
average price level derived from the confluence numbers was 1161.00. The high
for the year took less than 15 minutes to form and was made by a doji and a
shooting star on a 5-minute chart, as Figure 5.27 shows. That high held for 11
months, until after the November elections. The point to this example is that
the power of confluence worked to repel prices. The outcome can be different
each time, meaning we don’t know what the percentage of retracement of price
reversal will be. The general idea, however, is that as a trader you should
respect the notion that the market will at least pause and more than likely
generate a significant trading opportunity.
The
particular setup that initiated a sell signal was my signature low close doji
trigger, one of the patterns on which we go into detail in the next few
chapters! This pattern and the high close doji at or near pivot point support
targets are the highest probability trade signals I use.
SUMMARY
Remember
that pivot point support and resistance levels are a great gauge of what a
potential turning point or a predicted range in a given time period will be.
The more time periods or confluence of target numbers that line up, the higher
is the probability that a strong market reaction will occur. Therefore, it is
important to raise your attention when prices reach these predicted price
support and resistance numbers. If you apply proper risk and trade management
techniques, as will be covered in the next few chapters, you should see a
tremendous turnaround in your trading performance.
The Candlestick and Pivot Point Trading Triggers : Chapter 5. Pivot Points : Tag: Candlestick Pattern Trading, Forex, Pivot Point : Time and Price, different time periods, Pivot calculations, pivot point analysis - Pivot Confluences Work at Tops