Resistance Become Support
Moving Average Crossover, SBR, RBS, Candlestick signals, Resistance level, Investor sentiment
Course: [ How To make High Profit In Candlestick Patterns : Chapter 2. Moving Averages ]
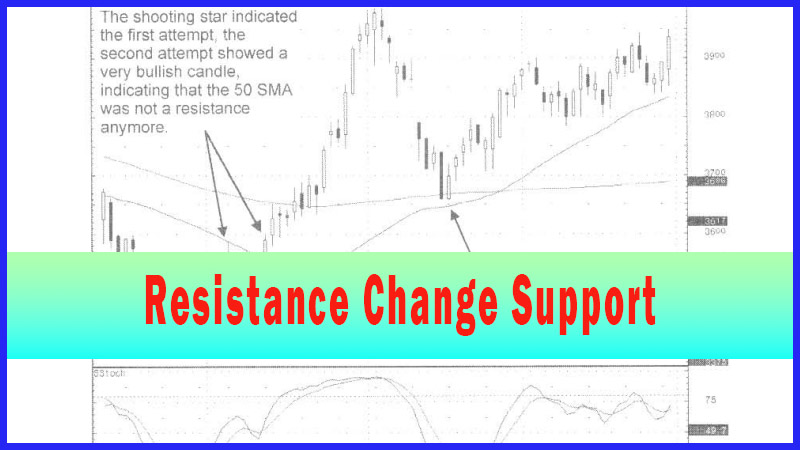
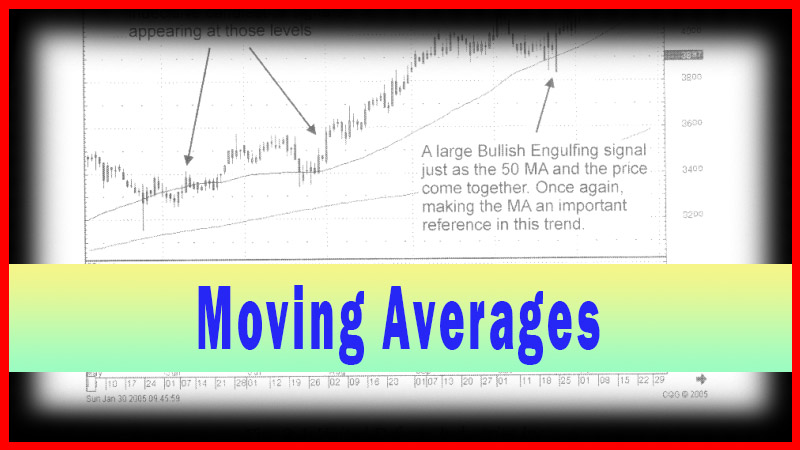
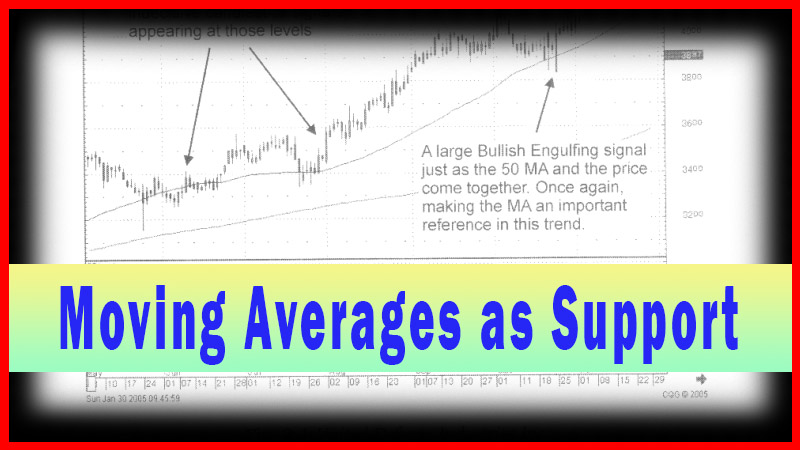
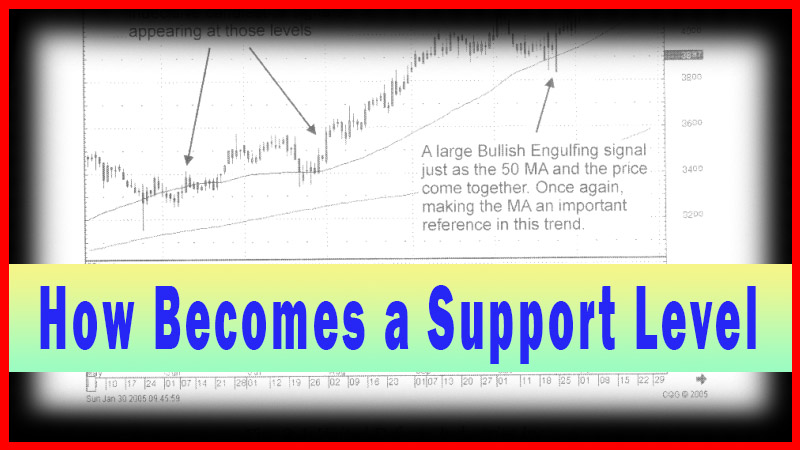
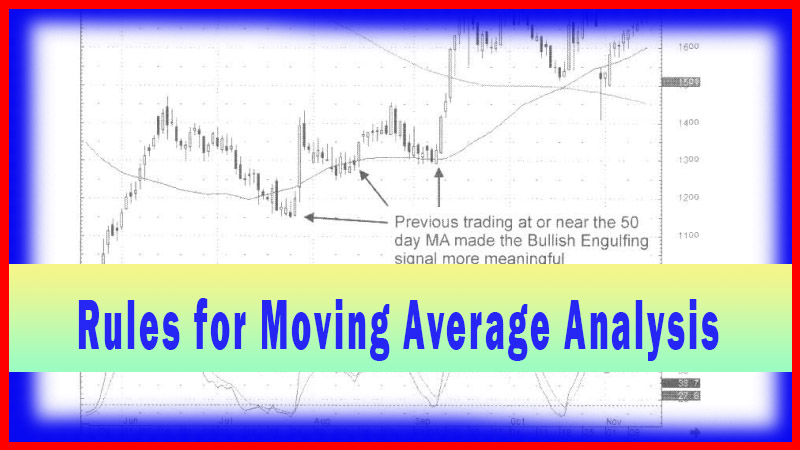
Moving averages that have shown to be resistance previously and are breached will now become support in a new uptrend. This basic rule works very well with the moving averages. The candlestick signals help with a visualization of that phenomenon.
Resistance then Support
Moving
averages that have shown to be resistance previously and are breached will now
become support in a new uptrend. This basic rule works very well with the
moving averages. The candlestick signals help with a visualization of that
phenomenon. The analysis of what is happening at a moving average becomes a
function of which signals are occurring at those levels. This makes trading in
the moving average area very simple to analyze visually.
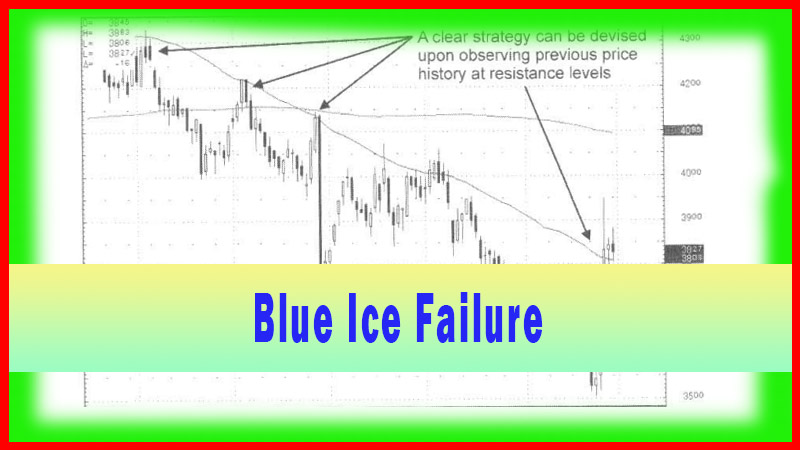
Another
common technical analysis rule is that the first time a resistance level is
touched, it will usually fail. The only subjective word in that rule is
“usually”. If this first attempt failure is a general rule, then being able to
visually see what is happening at that resistance level produces a better
insight. A candlestick signal that shows weakness at the point where crossing a
moving average is first attempted creates a much different analysis than if the
candlestick formation is a strong bullish candle that blasts through the
moving average. Although this may seem simplistic, the signals reveal what the
investor sentiment is at those levels. Improving the probability factor of this
pattern can be easily applied by knowing the signals that occur at that level.
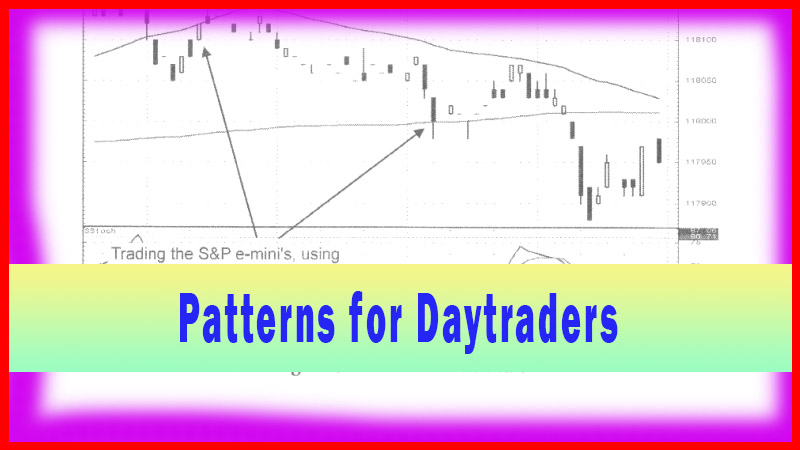
The
probabilities are greatly enhanced when an investor can anticipate where
candlestick signals should occur. For the aggressive trader, selling all or
part of a position when a price encounter one of the major moving averages,
anticipating that a candlestick signal could occur, creates a highly profitable
low-risk trading program. Highly profitable in the sense that an investor is
buying or selling right at a major support or resistance level. If the trade
works as expected from that level, an optimal entry price was probably
obtained. For the option trader, buying on an extended move down that just
barely touches the lower major moving average allows options to be bought at a
low price and probably with a minimal amount of option premium built into the
price. The risk of this aggressive approach is that the downward trend does not
stop at that support level. However, the point of the trade was that a
downtrend stretching to that support level had the probabilities of acting as
a support. If the price does not hold at that level, then the trade would be
closed immediately, limiting the loss.
On
the other hand, whether buying the stock or the option, it may have been bought
at the most optimal price before the reversal signal appeared. Again, in the
case of an option trade, this aggressive approach would have a double benefit.
The price of the option will be low and the premium will have diminished. As
the price starts to move back up, the premium will expand as confidence builds
back up.
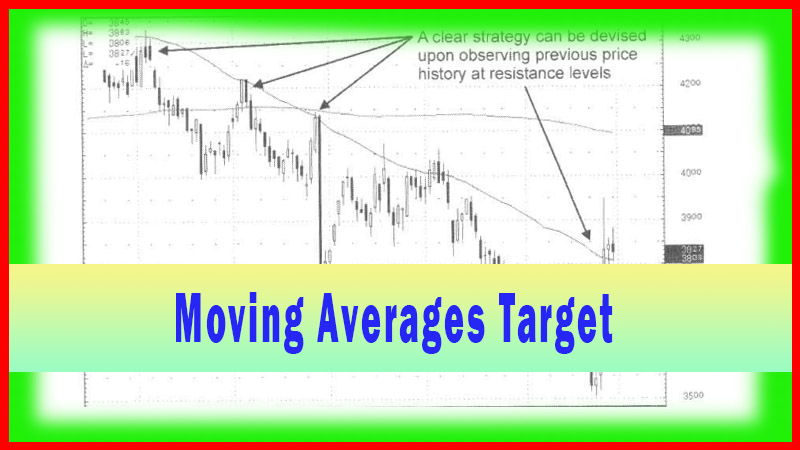
If
moving averages are used as support and resistance levels, they will be quickly
confirmed upon viewing a candlestick buy signal at support or a candlestick
sell signal at resistance. The possibility of a moving average becoming a
target becomes enhanced when analyzing candle formations as price approaches a
target. For example, viewing candlestick bodies getting bigger, creating large
black candles after a downtrend has been in existence for a good while, or
seeing a gap down in price when the stochastics are in the oversold area would
be good indicators that a trend is getting near the bottom. If this is all
occurring when a moving average is within striking distance, then entering at a
price right at that moving average becomes a better-calculated entry point.
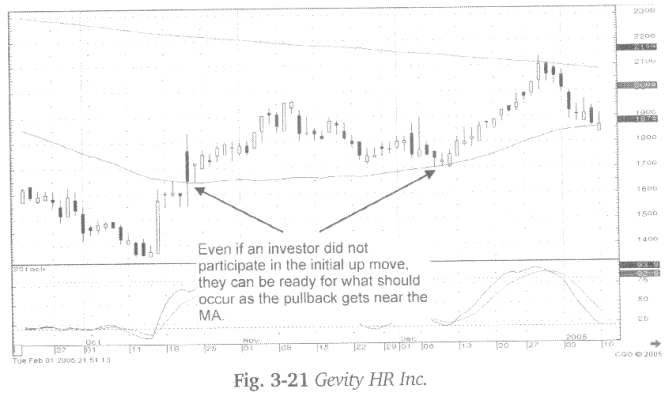
Whether
this analysis is done after an extended downtrend or after a pullback after a
recent breakthrough of a moving average in uptrend, it provides a logical
target for a when a trade should be entered. The more conservative approach is
to wait and see if a candlestick “buy” signal is formed after the moving
average has been touched and the time-frame has ended. Although the latter
approach is more conservative, the candlestick signal analysis will usually
put an investor into a trade well before the conventional technical analyst
feels the support level has been confirmed.
The
combination of visually being able to identify the candlestick signals and
understanding which moving averages produces high probability support and
resistance levels provides a powerful trading format. Through simple scan
techniques, an increased number of highly profitable trade potentials can be found
on a constant basis.
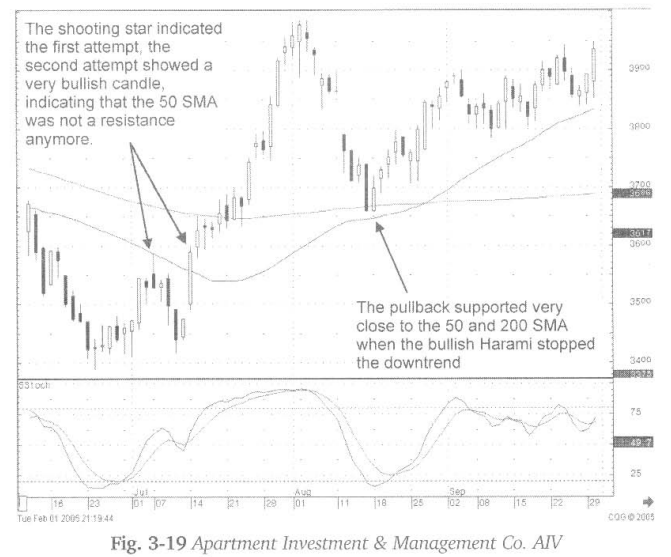
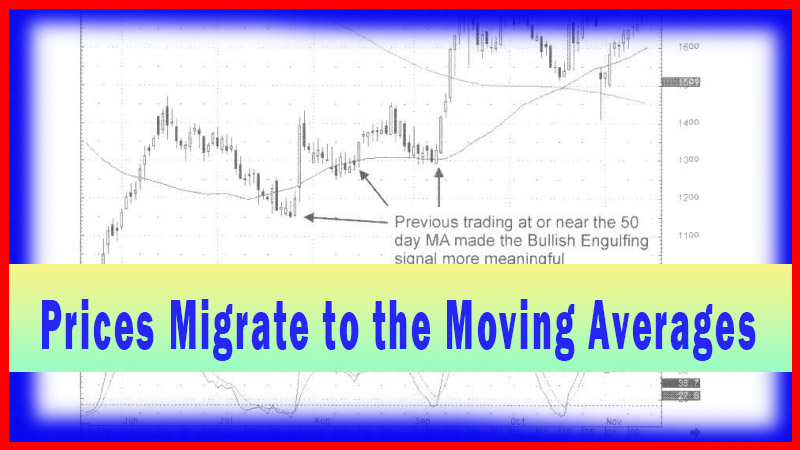
Fig.
3-19, The Apartment Investment & Management Co. chart reveals a strong buy
signal after the gap up from the Bullish Harami in the beginning of the second
week of July. As illustrated, the gap up bullish candle after the Harami
demonstrated that there was no resistance at the 50-day moving average as seen
one week prior. At that time, the Shooting Star signal just touched the moving
average for the first time. The gap up from the Harami was a very strong
bullish signal. The up-move remains strong until the first week of August when
the Hanging Man signal was followed by a Doji/Harami. The gap- down the
following day was confirmation that the uptrend was over. A pullback should be
occurring.
What
would be the target for the pullback? Obviously, the moving averages! In this
case, when both the 50-day and the 200-day moving average are close together,
either one or both could have been the support level. The Bullish Harami
confirmed this support and prices gapped up the next day.
How To make High Profit In Candlestick Patterns : Chapter 2. Moving Averages : Tag: Candlestick Pattern Trading, Forex : Moving Average Crossover, SBR, RBS, Candlestick signals, Resistance level, Investor sentiment - Resistance Become Support