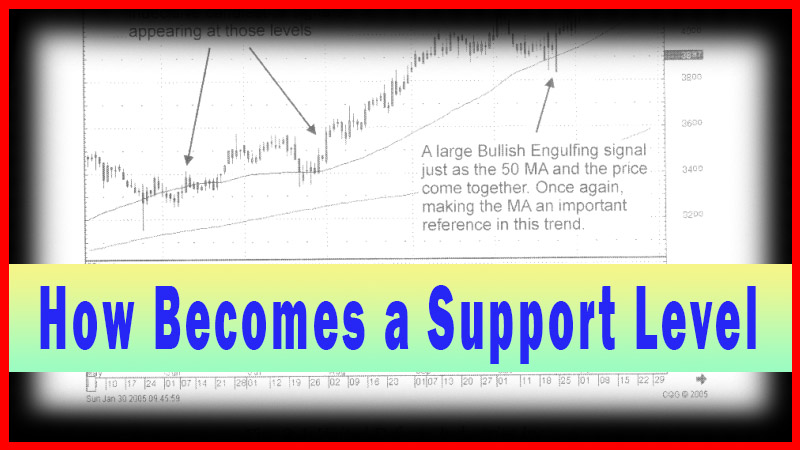
How Becomes a Support Level
resistance level, support level, moving average, 200-day moving average, Doji signal
Course: [ How To make High Profit In Candlestick Patterns : Chapter 2. Moving Averages ]
n technical analysis, there are some simple basic rules. One is that when a resistance level has been breached during an uptrend; it will now act as support upon any pullbacks.
When a Resistance Level is Breached, It Becomes a Support Level
In
technical analysis, there are some simple basic rules. One is that when a
resistance level has been breached during an uptrend; it will now act as support
upon any pullbacks. Armed with that little tidbit of knowledge, analyzing price
movements becomes a little clearer. Fig. 3-3, The NetGear, Inc. chart
illustrates the support concept as well as a few other simple rules when using
moving averages.
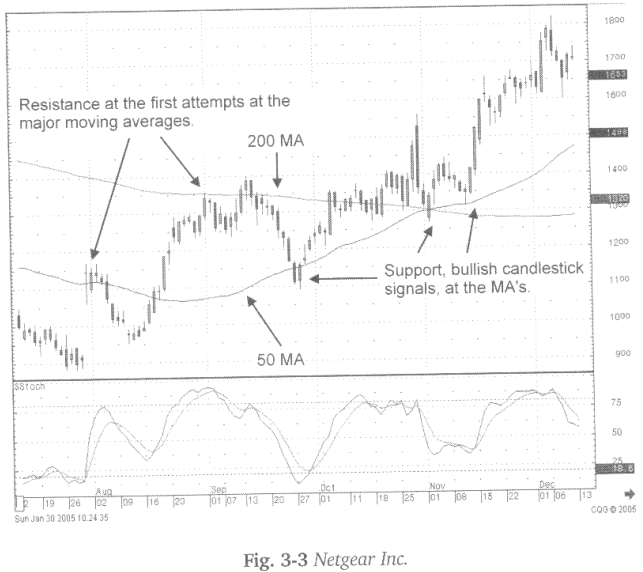
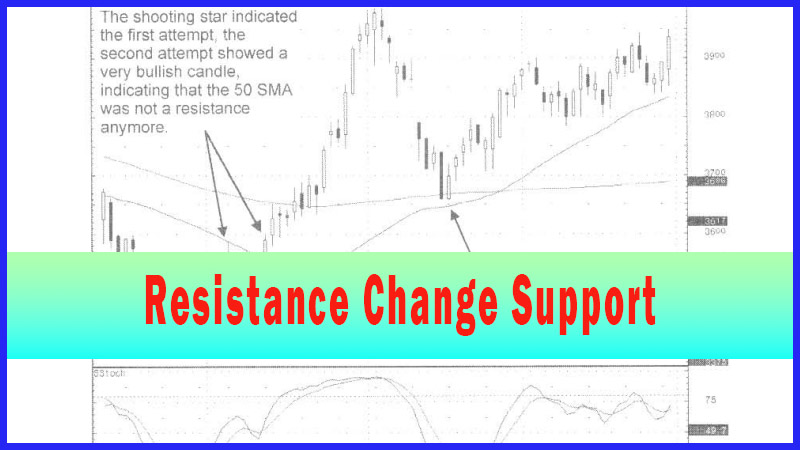
Another
rule can be applied a majority of the time. When a price tests an important
technical level the first time, it will usually fail. However; if it comes back
up to test that level again, it will often go through. Notice in the NetGear
Inc. chart the last day of July showed a gap up. It formed a Doji just above
the 50-day moving average. The uptrend had a hard time continuing the first
time it tested the 50-day moving average. As can be seen with the pullback into
mid- August. It was then followed by a second test of the 50-day moving
average. The advantage of the candlestick signals is that they reveal what the
investor sentiment is doing right at those important levels. The second test of
the 50- day moving average occurred when the strong bullish candle went
through. That revealed the moving average was not going to be a resistance
point. If the 50-day moving average is no longer a resistance point, what
becomes the next target? The 200-day moving average!
Notice
how the 200-day moving average was first tested on September 1. The failure at
that level was indicated by a Doji/Harami showing the buying had stopped. This
occurring, with the stochastics in the overbought area starting to turn back
down, becomes a clear indication the sentiment failed to take prices up through
the 200-day moving average. That would be an excellent time to take profits.
The next push went through but failed just above the 200- day moving average
with the appearance of a Bearish Engulfing signal.
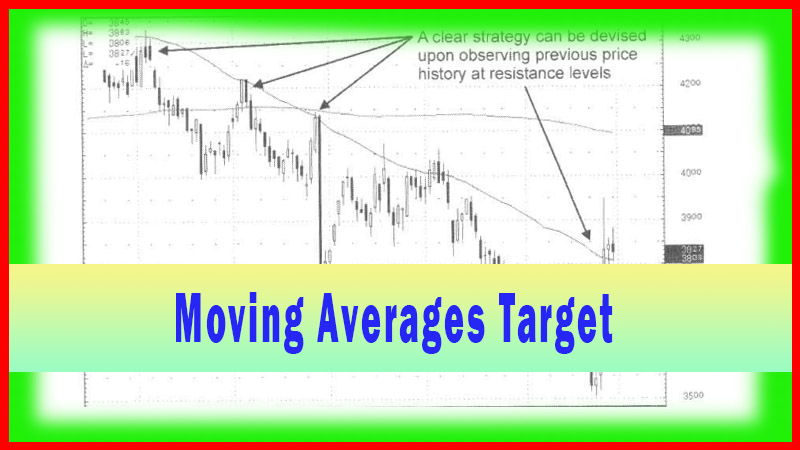
When
a moving average fails, what is the next target? The other major moving
average! The 50-day moving average now becomes a likely target. This either
provides a good short situation or allows an investor to take profits and wait
to see what signals will form once the 50-day moving average is touched. As
illustrated in this case, when prices got back to the 50-day moving average, a
Bullish Harami formed as the stochastics reach the oversold area and started to
curl back up. Now what becomes the next target? The 200-day moving average
again.
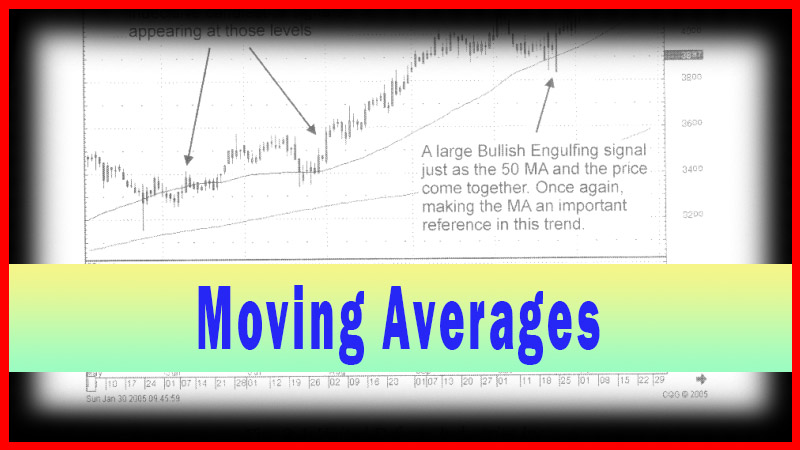
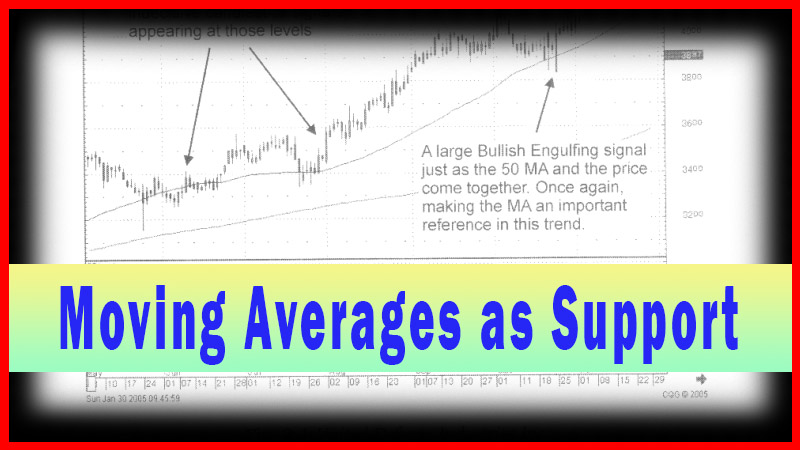
The
congestion area from that point remains fairly close to the 200-day moving
average. The Piercing Pattern occurring when the 50-day MA crossed the 200-day
MA produces important information. As can be seen, that signal, occurring at
the intersection of the two major moving averages, was a significant factor in
the next strong move upwards. After the initial buying, note how the pullback,
with the Doji signal just touching the 50-day moving average, was followed by a
Bullish Engulfing pattern that started the strong buying. The analysis of this
chart provides a format for when to be looking for significant candlestick
signals.
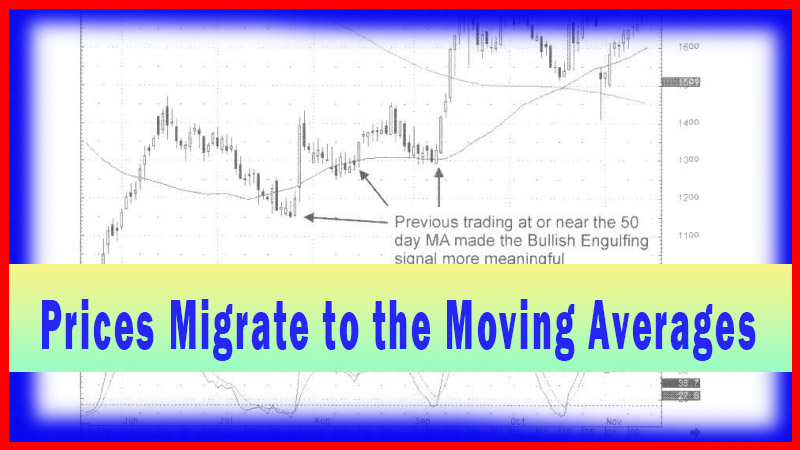
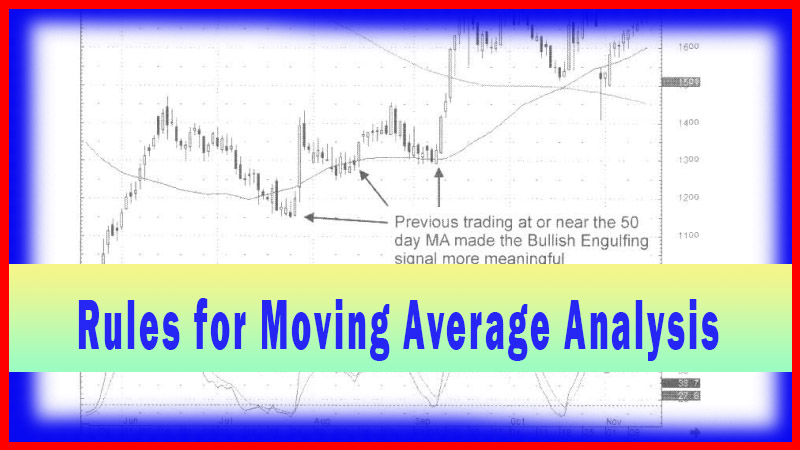
Fig.
3-3a, Cabot Microelectronics Corp. also reveals a failure of the 50-day moving
average on July 1, only to come back up through the 50-day moving average with
force in the latter part of July. After the initial run up, coming up through
the 50-day moving average it pulled back. Notice how it supported exactly on
the moving average line before the Bullish Engulfing signal revealed that
buying was not going to take the price any lower.
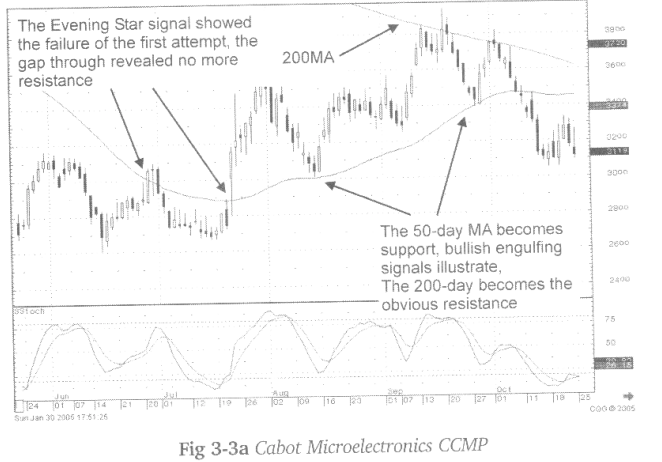
Where
did the first major resistance come into play? At the 200-day moving average in
mid-September! When it fails the 200-day moving average, where is the potential
pullback target? The 50-day moving average! The Bullish Engulfing signal at
that level indicates the next target is the 200-day moving average again. Once
there, the evening star signal reveals another failure of the 200- day moving
average.
Notice
there is a definite candlestick signal right at the major averages. Once again,
it does not take too long to realize that the moving averages are important
targets. It was also easy to evaluate what was happening at those targets with
the identification of candlestick signals.
Fig.
3-4, the Alamosa Holding Inc. chart also reveals the importance of a major
moving average acting as a substantial indicator affecting prices. September
revealed two time-periods of great indecision. The series of Doji and Hammer
formations were signals that investor sentiment was not able to push the price
away from the moving average.
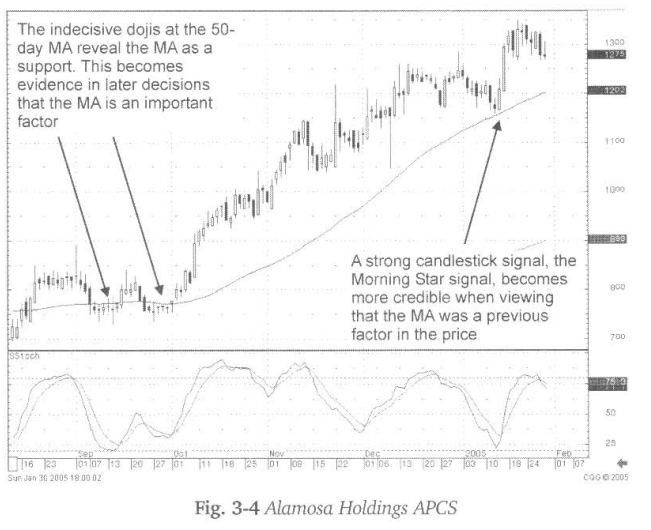
The
gap up at the 50-day moving average becomes a signal that strong buying is
coming into the trend, as discussed in the chapter on GAPS. As seen in the
early part of January, the moving average once again acts as a support level,
as indicated by the Doji followed by the Bullish Engulfing signal. Price moves
occurring at these major moving averages is not happenstance. Many technical
traders watch for these indicators. They are waiting to see what happens at
these levels. The advantage provided to the candlestick investor is being able
to visually witness what is happening at these levels immediately. Other technical
investors may require a few trading days of confirmation before they commit
funds.
How To make High Profit In Candlestick Patterns : Chapter 2. Moving Averages : Tag: Candlestick Pattern Trading, Forex : resistance level, support level, moving average, 200-day moving average, Doji signal - How Becomes a Support Level