Moving Average Patterns
pattern day trading rule, Moving Average Best Pattern, Moving Average Signal
Course: [ How To make High Profit In Candlestick Patterns : Chapter 2. Moving Averages ]
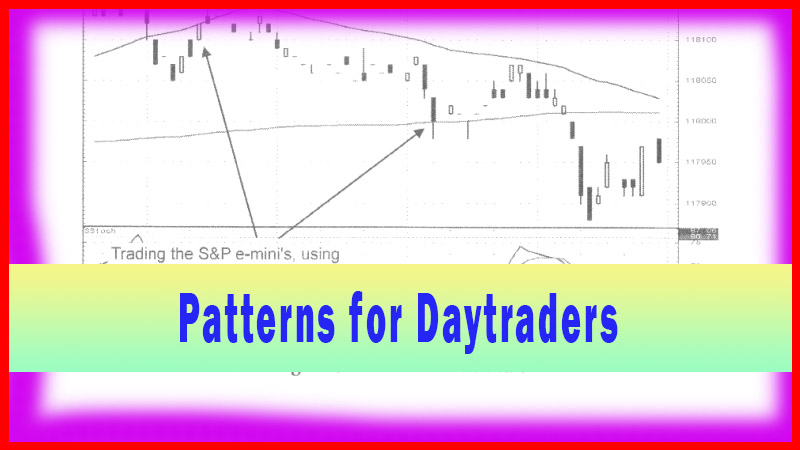
The ability to recognize high probability chart patterns is highly productive for the daytrader. Trading the index futures, which requires much greater accuracy for entering and exiting trades, is better formulated when knowing if a high probability pattern is forming.
Patterns for Daytraders
The
ability to recognize high probability chart patterns is highly productive for the
daytrader. Trading the index futures, which requires much greater accuracy for
entering and exiting trades, is better formulated when knowing if a high
probability pattern is forming. Successful intraday trading can be accomplished
with a few simple analytical steps. Being able to analyze the trend of the
general market provides a bias to the trading, analyzing market direction
should dictate a heavier bias for the long side or the short side during any
given day. That analysis may be formulated when analyzing the daily charts,
then extrapolating that information into the intraday chart analysis.
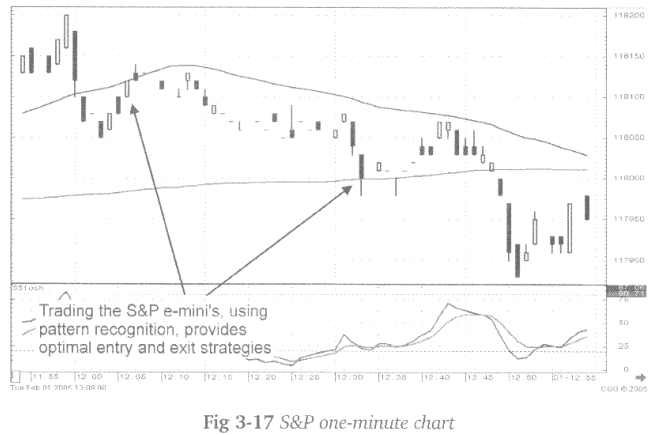
Simple
logic dictates that the analysis for the market in general is in a downtrend,
then the one-minute, five-minute, and fifteen- minute chart analysis should be
viewed with more emphasis on the moving averages acting as resistance. As
illustrated in the S&P one-minute chart, if a downtrend is the predominant
bias for the day, the candlestick investor’s eyes should be oriented toward
failures at specific moving averages. This is not high-tech analysis. This is
using commonsense and then applying the candlestick signals, along with
stochastics and moving averages, to enhance your entry and exit decisions.
How To make High Profit In Candlestick Patterns : Chapter 2. Moving Averages : Tag: Candlestick Pattern Trading, Forex : pattern day trading rule, Moving Average Best Pattern, Moving Average Signal - Moving Average Patterns