Moving Averages - Basics
Technical indicators, simple moving average (SMA), exponential moving average (EMA), weighted moving aver¬age (WMA),
Course: [ How To make High Profit In Candlestick Patterns : Chapter 2. Moving Averages ]
Moving averages provide important information regarding the direction of a market. They were created to provide directional information, smoothing out the zigs and zags of a trend.
Moving Averages Techniques
“Emotions are your worst enemy in the stock market.”
Moving
averages provide important information regarding the direction of a market.
They were created to provide directional information, smoothing out the zigs
and zags of a trend. Their use has become much more predominant with the
advance of computer software. The automatic calculations for MAs (moving
averages) have greatly simplified their applications. They can now be
calculated and utilized up to the very second/minute in a trading chart. Their
applications, along with candlestick signals, provide a very strong profitable
trading format. As with all other technical indicators, MAs have a relevance
when correlated to price movement. How the moving averages are utilized can
make a big difference between moderate returns and highly profitable returns.
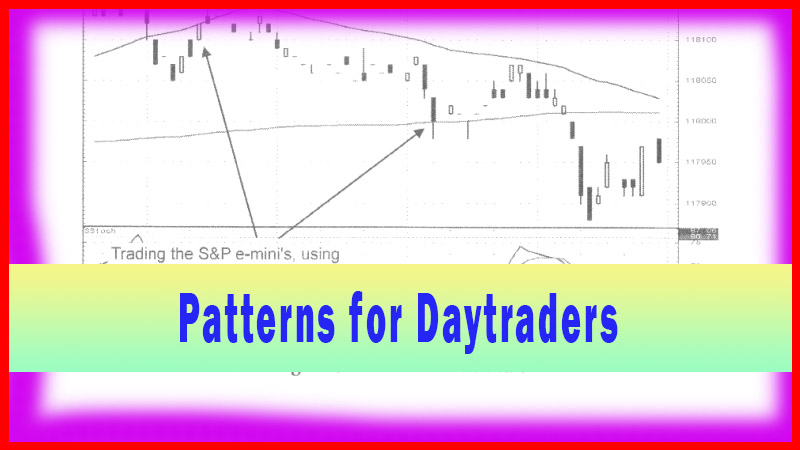
Trading
techniques, using moving averages, provide improved entry and exit strategies.
The most common use is when the relevant moving averages cross. The feasibility
of using MAs “crossing” apparently has some relevance or it would not be widely
known as one of their useful aspects. However, the benefits of moving averages
become greatly diminished if “crossings” are the only application used. The
accuracy of the crossing analysis is moderately successful. However, there are
many technical evaluations that are moderately successful. Applying Candlestick
analysis in relation to the MAs provides a higher function.
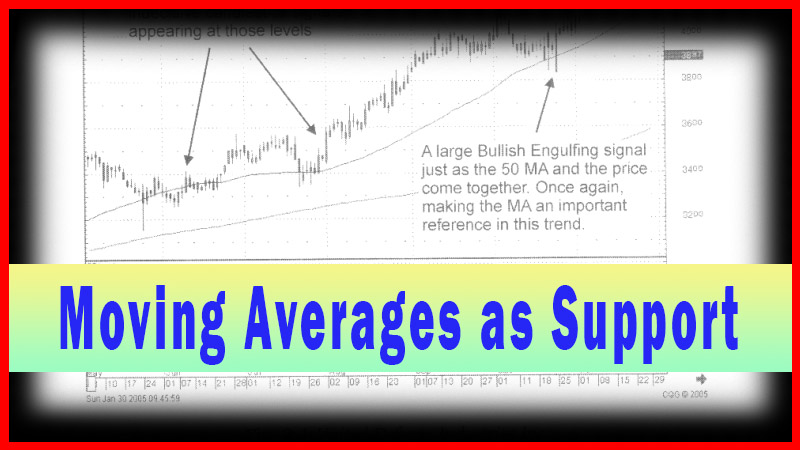
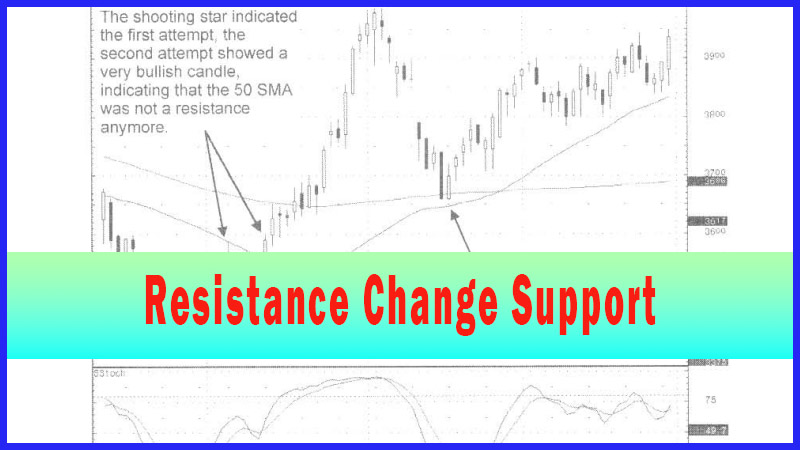
Candlestick
signals, along with the moving averages, create a trading program that
produces highly profitable trades. Using the important moving averages as
support and resistance areas, in conjunction with candlestick analysis,
advances the probabilities of participating in a correct trade. Trades are produced
with a much greater frequency. The point of investing is to find additional
processes for using technical indicators that provide a very high ratio of
successful trades. Fortunately, the use of moving averages is very simple. Once
applied to candlestick charts, it makes the trend analysis, of probable support
or resistance, a very simple, visual process.
The
question always arises whether to use the simple moving average (SMA),
the exponential moving average
(EMA), or the weighted moving average (WMA).
The simple moving average is the easiest to calculate; therefore, the reason it
was well used before the presence of computers. The exponential moving average
has become more popular in recent years due to the quicker calculation’s
computer software provides. It incorporates the latest data in its
calculations, allows the older data to fade out, making the current data more
pertinent. Weighted moving averages put more importance on current data versus
older data. Simple moving averages work very well, providing the information
required to successfully trading candlestick signals. Money managers, as well
as a majority of technical investors, use the simple moving average.
The
moving averages provide a simple visual indicator that shows the direction of a
trend’s slope. When the moving averages are rising, it indicates an uptrend.
When the moving averages are falling, it indicates a downtrend. If the moving
averages are trading sideways, it reveals a sideways market.
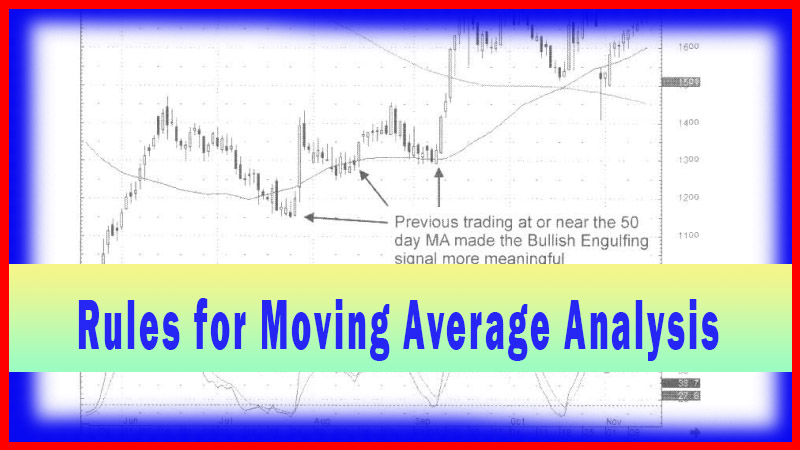
Traders
that use the moving average method for indicating trends follow some very basic
rules.
1.
If the
SMA is trending up, trade the market on the long side. Buy when prices pullback
to, or slightly below, the moving average. After a long position is
established, use the recent low as your stop.
2.
If the
SMA is trending down, trade the market to the short side. Short (sell) when
prices rally to or slightly above, the SMA. Once a short position is
established use the recent high as your stop.
3.
When the
SMA is trading flat or oscillating sideways, it illustrates a sideways market.
Most traders, utilizing the moving average to determine trends, will not trade
in this market.
Simply
stated, traders that use the SMA as a trend go long (buy) when prices are
trending above the moving average. They will go short (sell) when prices are
trending below the moving average. The candlestick trader has an immense
advantage of being able to see what the candlestick signals are telling them at
these important moving average levels.
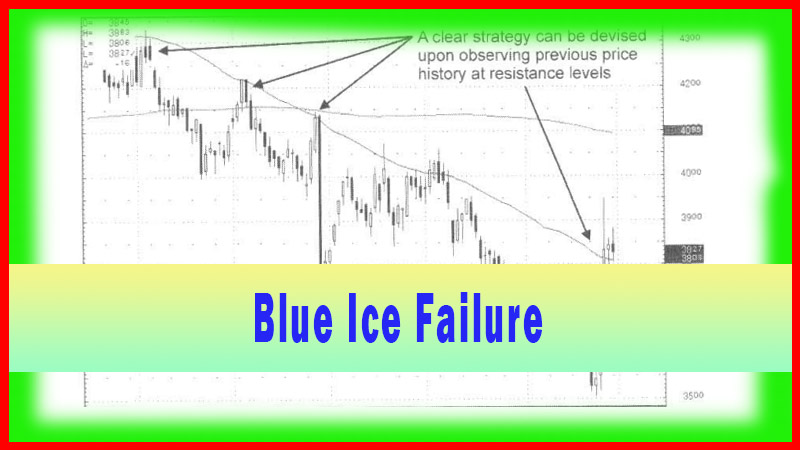
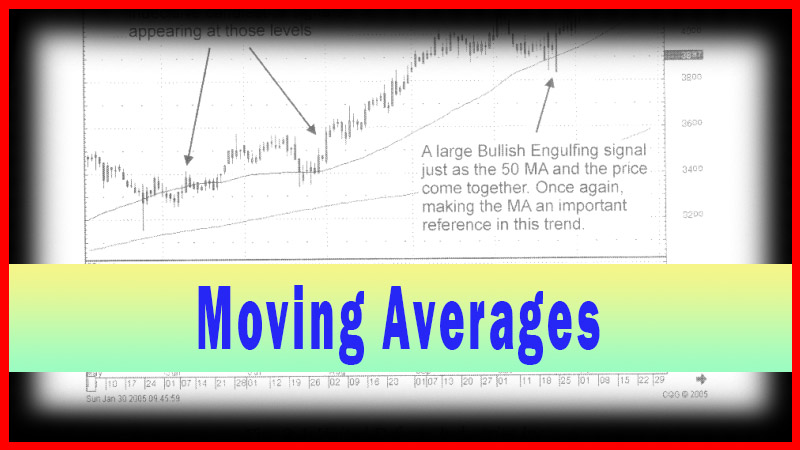
There
are numerous timeframes that appear to have relevance when using the moving
averages. The 3, 5, 10, 15, 20, 30, 50, 80, 100, 200, 400, 500, 1000 moving
averages are all used. Through extensive studies, theforex7, it has been
revealed that the 50-day moving average and the 200-day moving average are the
most important moving averages. There seems to be a great tendency for prices
to support or resist at those averages. Therefore, the 50-day and 200-day
moving averages are considered major moving averages. The 20-day and the 80-day
moving average are also important but should be considered secondary moving averages.
Are there other moving averages that work effectively? Probably, but the major
and secondary MAs discussed here seem to have a statistical relevance.
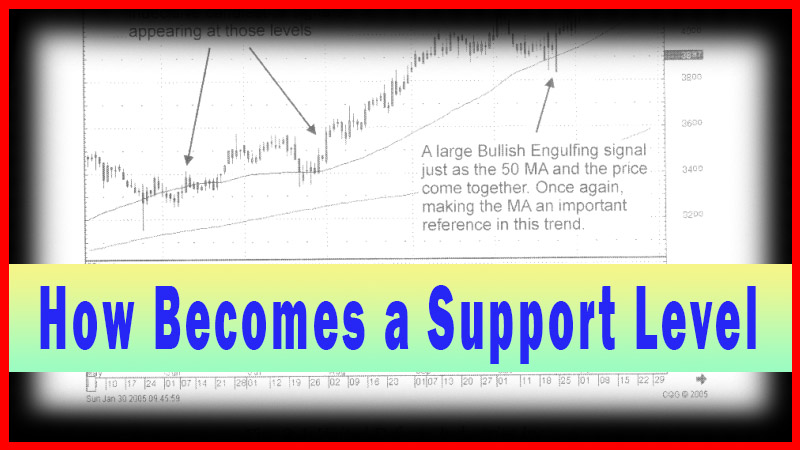
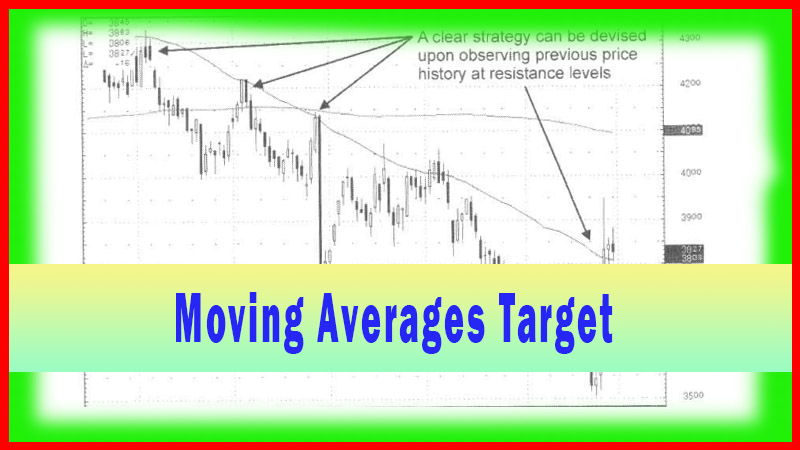
Technical
indicators provide important information. An indicator gains importance because
of the reoccurring significance of major investment considerations happening
at those points. This explanation is put forth so that each investor can become
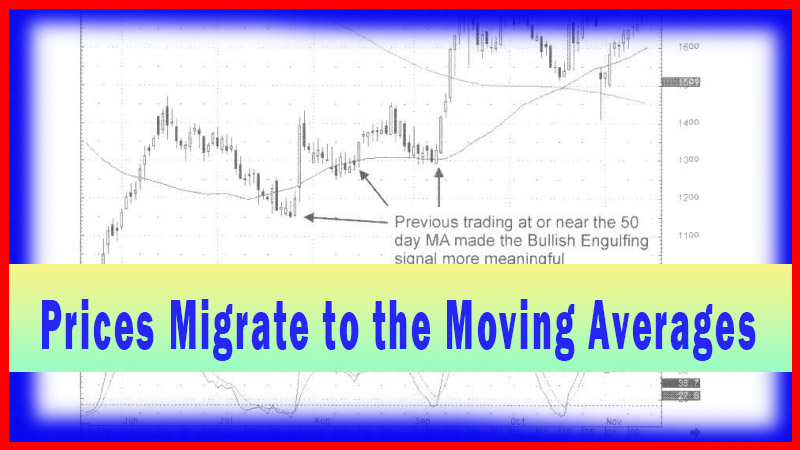
convinced, in their own minds, that moving averages, especially the ones being
recommended in this chapter, have some relevance. The major moving averages act
like magnets. They attract the price from one moving average to the next moving
average.
Through
the following chart evaluations and one’s own chart studying, the relevance of
these moving averages should become apparent. This does not an investor from
constantly being aware that other moving averages may start gaining importance
in the eyes of other technical investors. The point of using these moving
averages, along with candlestick signals, is that historically many investors
are watching to see what price movements do at these levels. The advantage of
the candlestick signals is that the signals tell you exactly what investors are
doing at those levels.
How To make High Profit In Candlestick Patterns : Chapter 2. Moving Averages : Tag: Candlestick Pattern Trading, Forex : Technical indicators, simple moving average (SMA), exponential moving average (EMA), weighted moving aver¬age (WMA), - Moving Averages - Basics