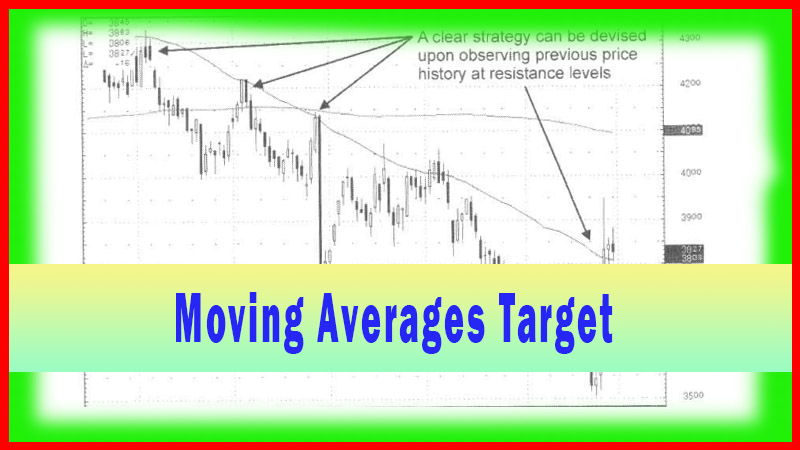
Moving Averages Target Levels
Moving Average Crossover, trendlines, swing trade entry points, Moving average signal, Moving average target point
Course: [ How To make High Profit In Candlestick Patterns : Chapter 2. Moving Averages ]
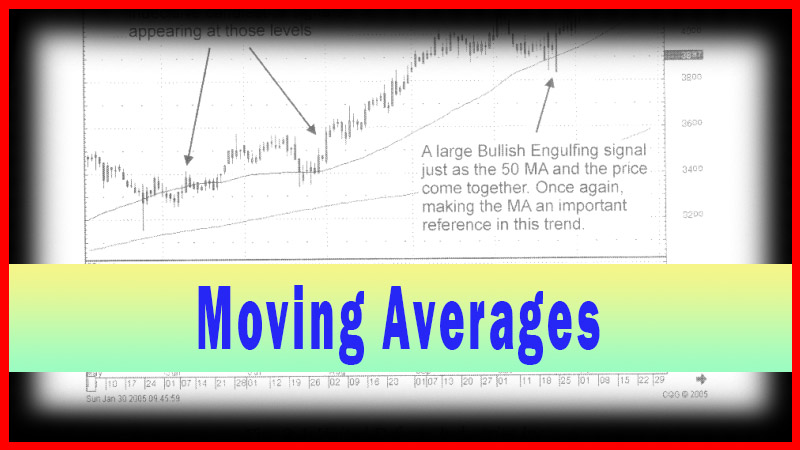
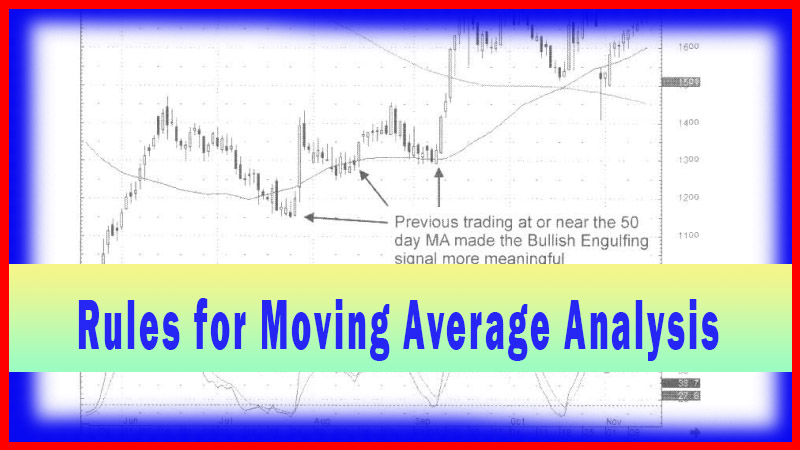
The downtrend in MPS was finally ended with the confirmation of the Bullish Harami in early August. What becomes a logical upside target? Obviously, the 50-day moving average! As can be seen at that level, the Evening Star signal illustrated that the sellers had stopped the uptrend right on the 50-day moving average in the early part of September. The first attempt failed.
Moving Averages Become Target Levels
The
downtrend in MPS was finally ended with the confirmation of the Bullish Harami
in early August. What becomes a logical upside target? Obviously, the 50-day
moving average! As can be seen at that level, the Evening Star signal
illustrated that the sellers had stopped the uptrend right on the 50-day moving
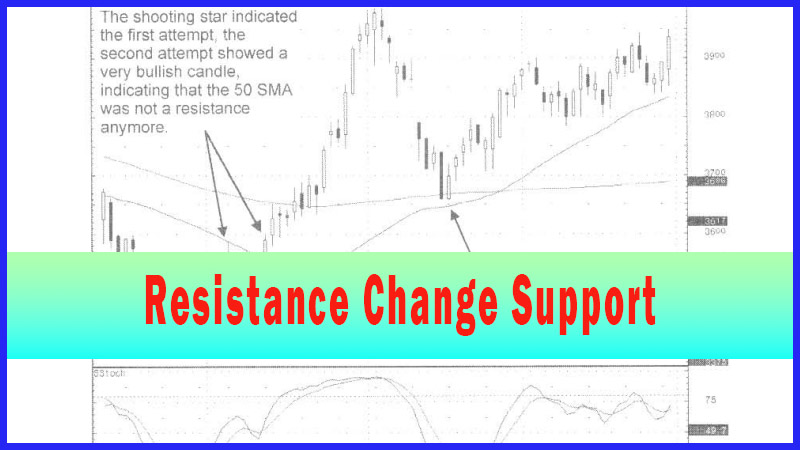
average in the early part of September. The first attempt failed. The second
attempt was confirmed with a strong bullish candle on the 1st of October. What
is the next target? The 200-day moving average!
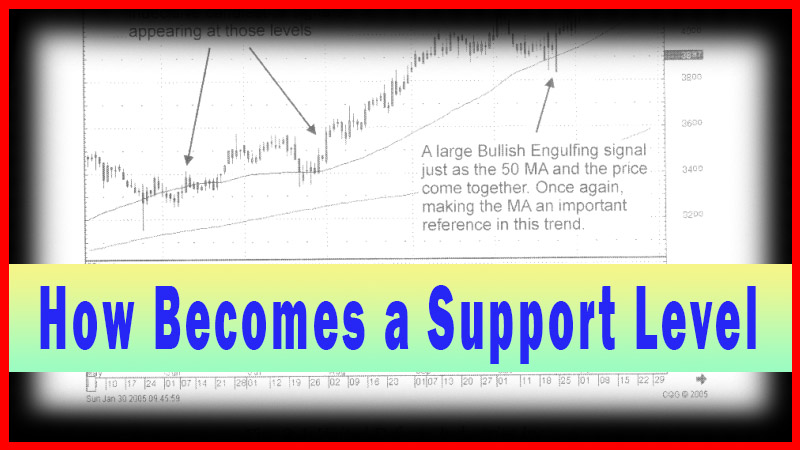
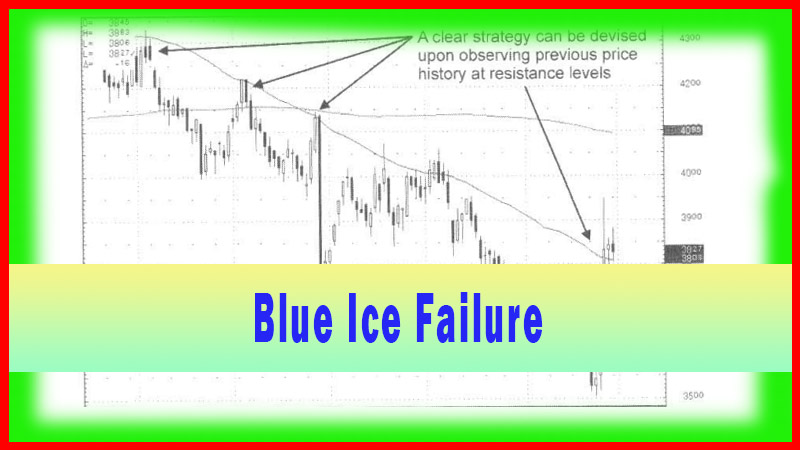
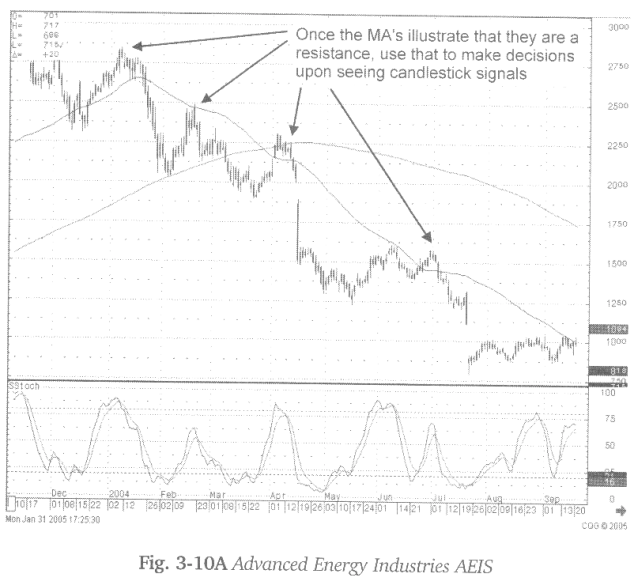
The
more often a price fails at a particular moving average, the more confident the
candlestick investor should be for finding the “sell” signals at that level. As
illustrated in the Kemet Corp. chart, it had become obvious during March and
April that every time this price approached the 50-day moving average,
candlestick sell signals would start to appear. Take advantage of the obvious,
especially when the candlestick sell signals confirm.
Fig.
3-10, The Kemet Coip. chart reveals what price reaction occur as it nears the
50-day moving average. Observing the historical tendency of a buy price move
adds additional information to the chart analysis.

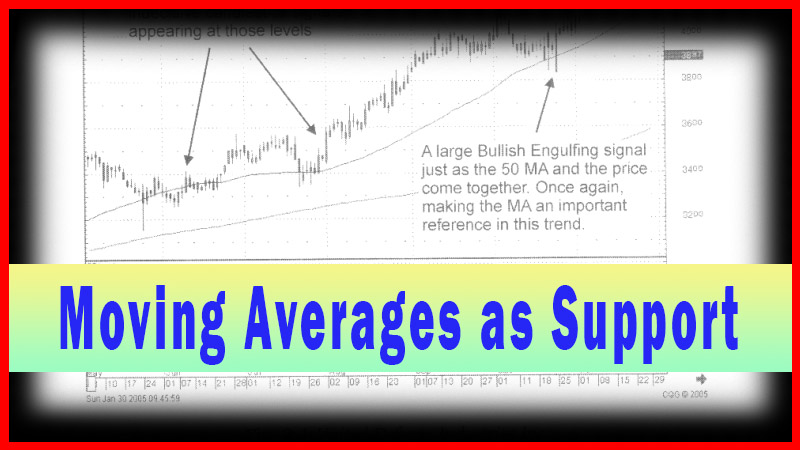
Observe
the obvious! Simple observations are easily made when using candlestick
charts. Prices move in patterns. Resistance at a declining moving average is an
important pattern to add when making your investment decisions. If you are able
to clearly observe what happens at those levels, assume everybody else can
also. The advantage for the candlestick investor is the candlestick “sell”
signals provide immediate confirmation for what is happening in the trend as it
is occurring. This allows early entry and exit strategies into the trading decisions.
When
the same indicators are appearing as they have been a few times before, it
becomes logical that the results have a likely probability of resembling the
past results. Visual analysis can be done in a matter of seconds. Once you have
trained your eye to recognize what a trend has been doing at specific points,
making an analysis of what should be the next future move becomes that much
easier.
Keep
in mind, the candlestick signals are the foremost consideration. Adding
stochastics and moving averages to the analysis enhances the probabilities of
being in a high probability trade.
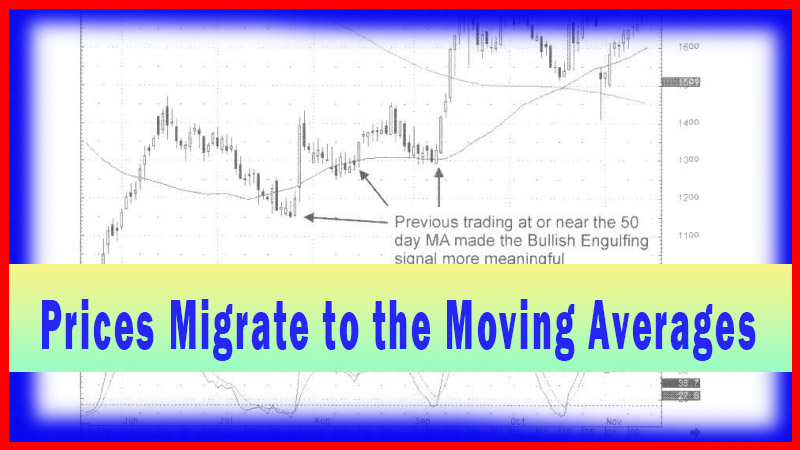
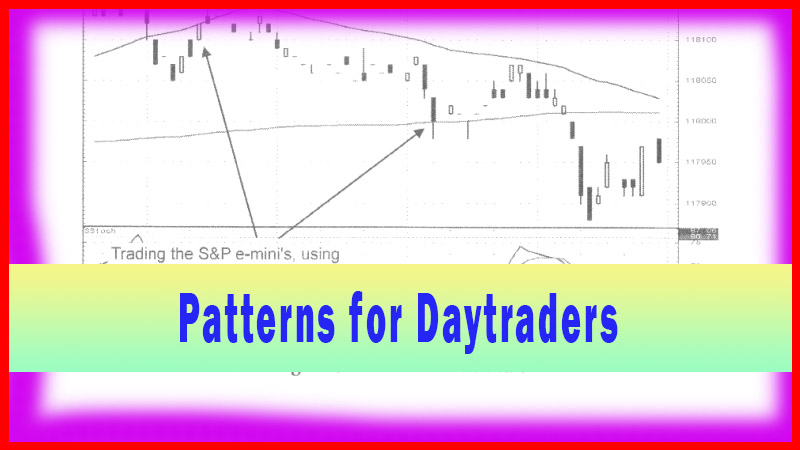
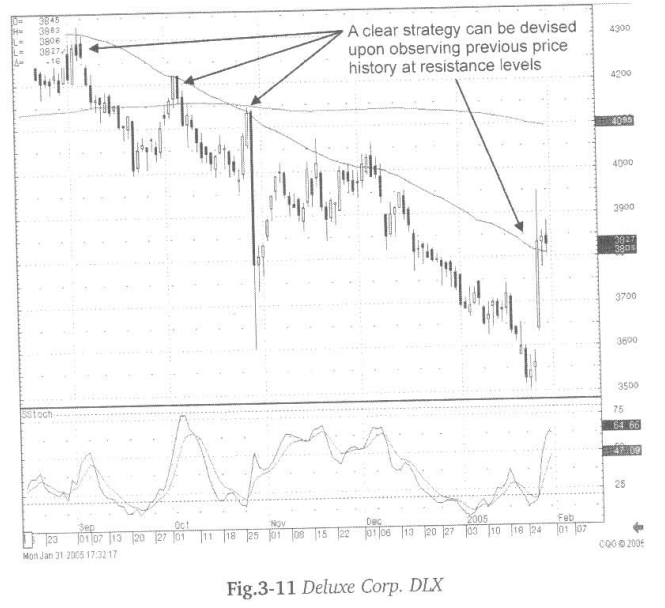
Fig.
3-11, The Deluxe Corp. chart provides a very simple scenario. Selling, coming
in after a Spinning Top, right near the 50-day moving average. This would imply
that that moving average was the resistance area once again. On the other hand,
witnessing additional strength would imply that the downtrend had finally been
broken and the 200-day moving average could possibly be the next target.
How To make High Profit In Candlestick Patterns : Chapter 2. Moving Averages : Tag: Candlestick Pattern Trading, Forex : Moving Average Crossover, trendlines, swing trade entry points, Moving average signal, Moving average target point - Moving Averages Target Levels