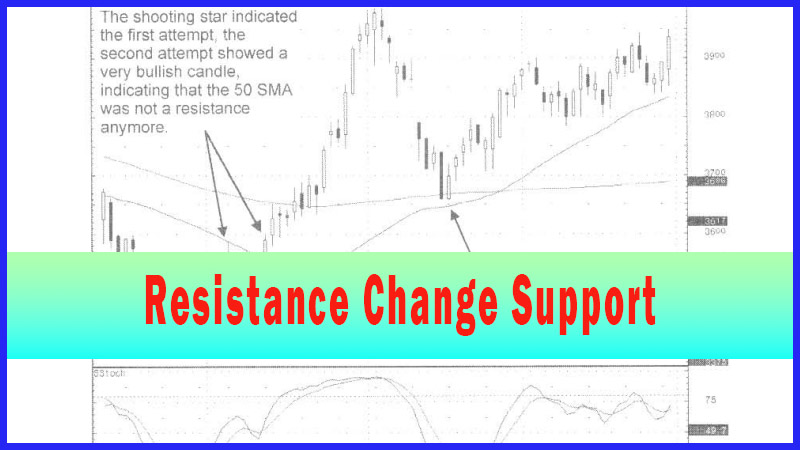
Moving Averages as Resistance
candlestick signals, Moving average signal, Support And resistance, Bullish signal, Ema, Sma
Course: [ How To make High Profit In Candlestick Patterns : Chapter 2. Moving Averages ]
The same characteristics that are found in an up-trending stock are also found in stocks that are in a downtrend. For example e, a price that breaks down through a major moving average could eventually bounce back up to test that moving average.
Moving Averages as Resistance
The
same characteristics that are found in an up-trending stock are also found in
stocks that are in a downtrend. For example e, a price that breaks down through
a major moving average could eventually bounce back up to test that moving
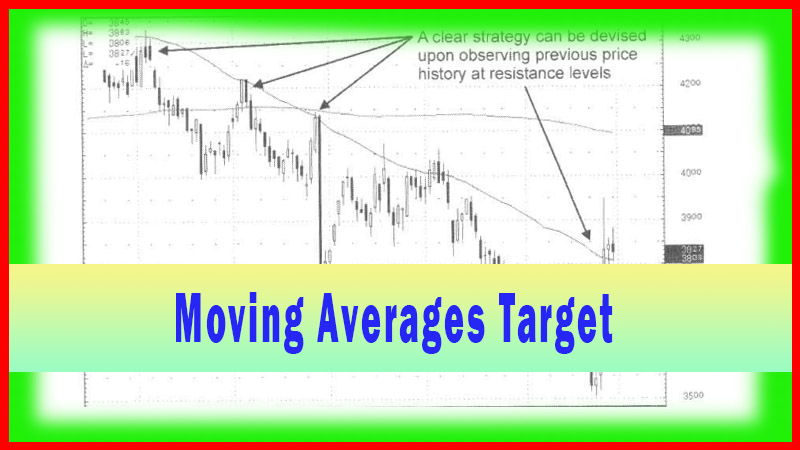
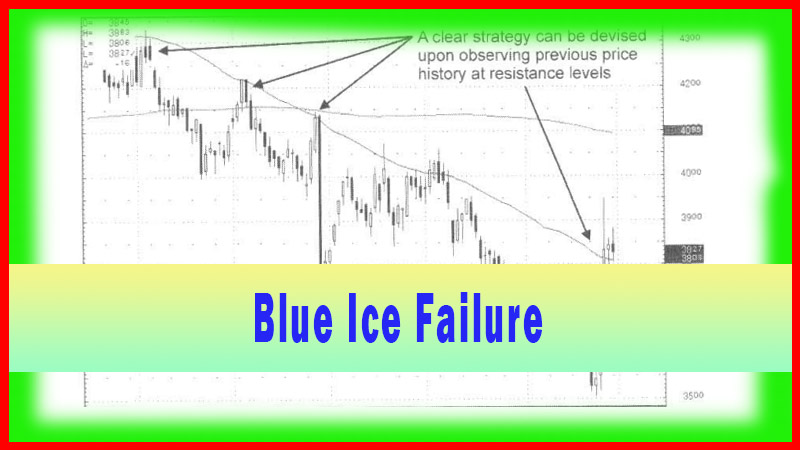
average. If it fails, then the trend will be taken lower. The continued
downtrend will usually breach the recent low. If the other major moving average
is below the failed moving average, it now becomes the potential target.
Understanding these basic movements in prices, it does not take more than a few
seconds to analyze whether a price will be affected by the moving averages.
A
downtrend in price can be easily monitored when a major moving average is
recognized as being a resistance level. Adding another analytical element,
when analyzing a trend, increases the probabilities of being in a high
probability trade. Logic dictates that if a price does not seem to be able to
push through an observed resistance level, the more often that occurs, the
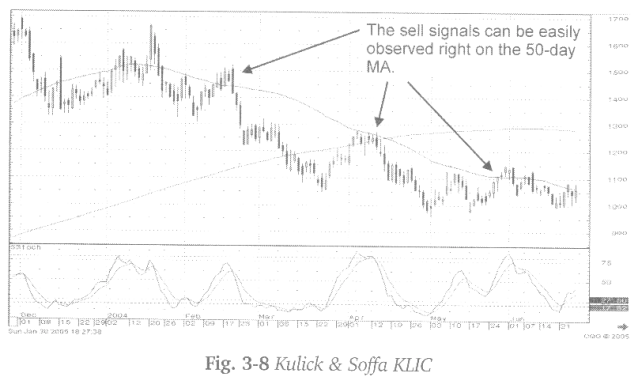
higher the probability that it will continue its downtrend. As can be observed
in Fig. 3-8 (opposite), the KLIC chart, from the peak in price in January, of
2004, every time the price climbed up towards the 50-day moving average, sell
signals would appear.
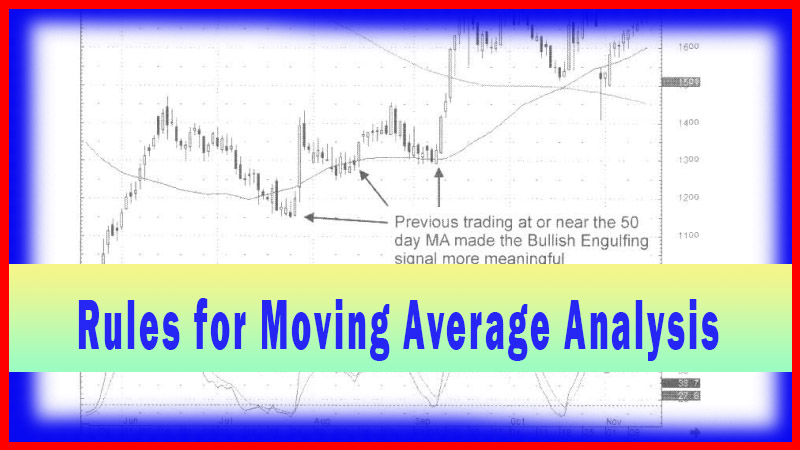
This
observation should not have taken too much analysis. If the stock was bought
when candlestick signals and stochastics dictated, there should be the
preconceived awareness that the uptrend has a high probability of running into
resistance near the 50-day moving average. Being prepared for that occurrence
makes viewing the candlestick sell signals, at those levels, that much more
credible.
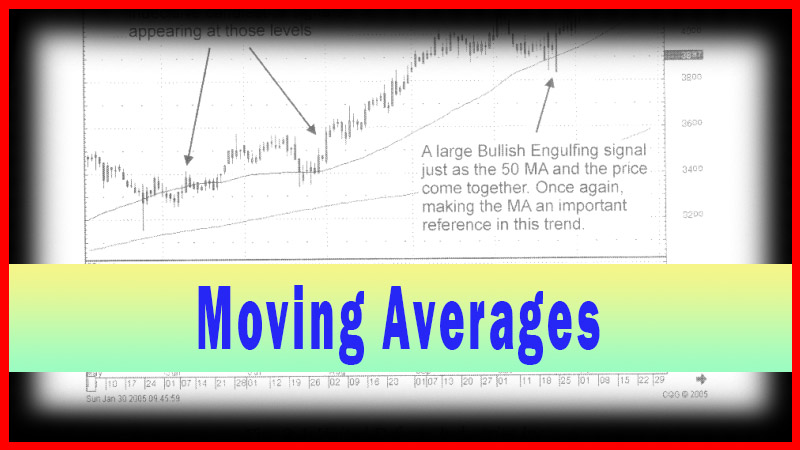
Knowing
moving averages are important technical levels for many investors, it becomes
important to understand what is happening at those levels. The candlestick
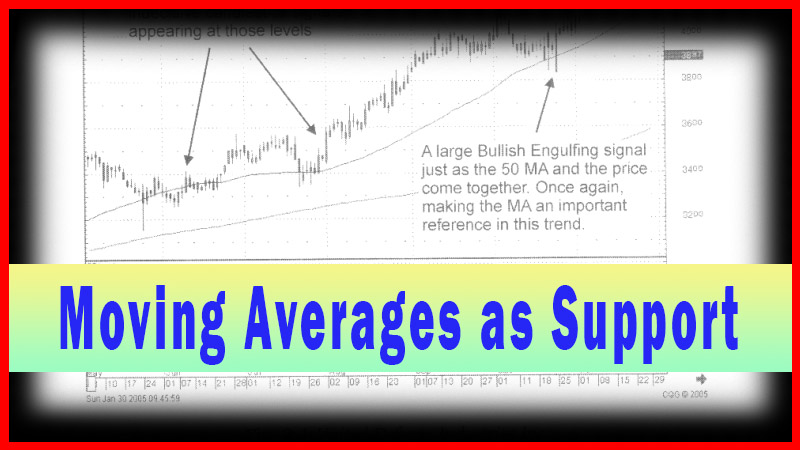
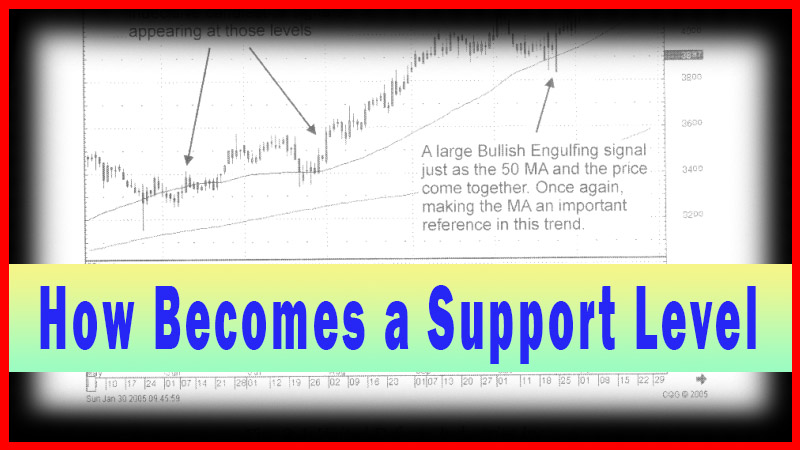
signals provide that information. If a moving average acts as support, there
should be the anticipation of a candlestick buy signal formation. Conversely,
if the candlestick formations do not reveal any buying strength at those
levels, it becomes apparent that the important support level was not having an
effect on the downtrend. This is just simple logic. Nothing more than analyzing
what is happening at supposedly important technical levels.
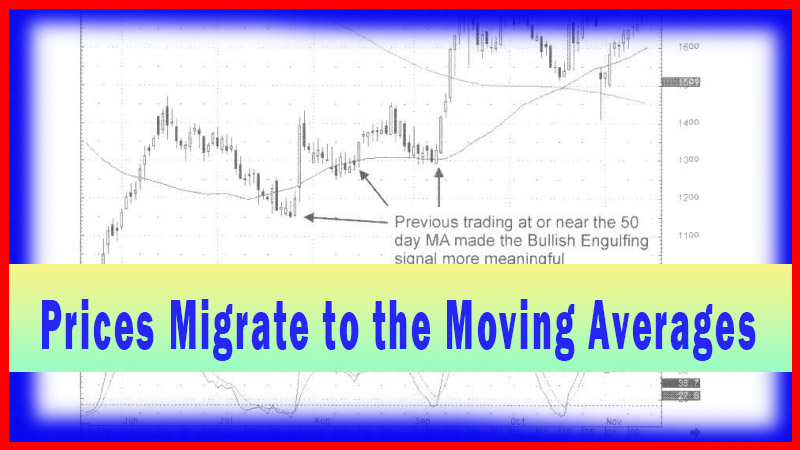
Illustrated
in Fig. 3-9, the MPS Group Inc. chart in late May, spinning tops formed on the
200-day moving average, confirmed with a bullish candle and stochastics.
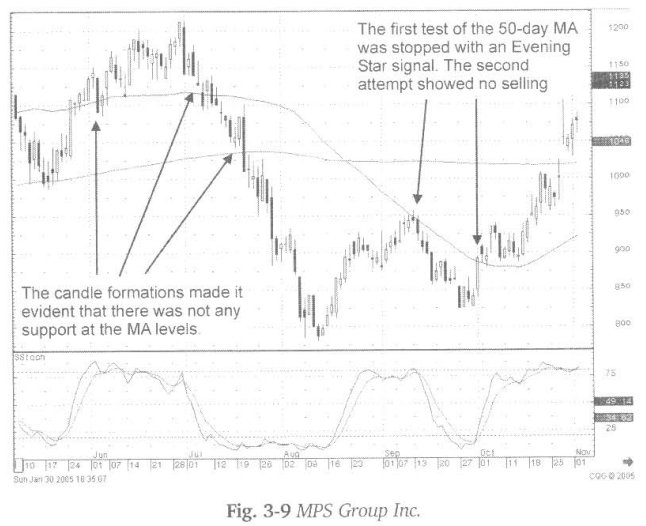
The
uptrend did not stop at the 50-day moving average. A large bullish candle at
the 50-day moving average indicated this to be a support level until prices
topped out on the first of July. What was the first logical support area? Of
course, the 50-day moving average.
However,
as can be seen, there were no confirmed buy signals at the 50- day moving
average in early July. That should have given the indication the next support
level would be the 200-day moving average. The large dark candle that came down
through the 200-day moving average, in mid-July revealed that the 200-day
moving average was not going to act as a support level either.
The
failure of the 200-day moving average did not show any confirmed buy signals
until the bullish Harami down in the $8.00 range. If the investor had been
short during this downtrend or an investor was waiting to go long at important
support levels, it became obvious that those support levels were not going to
act as support. Simply stated, if a technical level has the potential of acting
as support, it is logical a candlestick buy signal will confirm that. The lack
of a candlestick buy signal will demonstrate that it is not.
How To make High Profit In Candlestick Patterns : Chapter 2. Moving Averages : Tag: Candlestick Pattern Trading, Forex : candlestick signals, Moving average signal, Support And resistance, Bullish signal, Ema, Sma - Moving Averages as Resistance