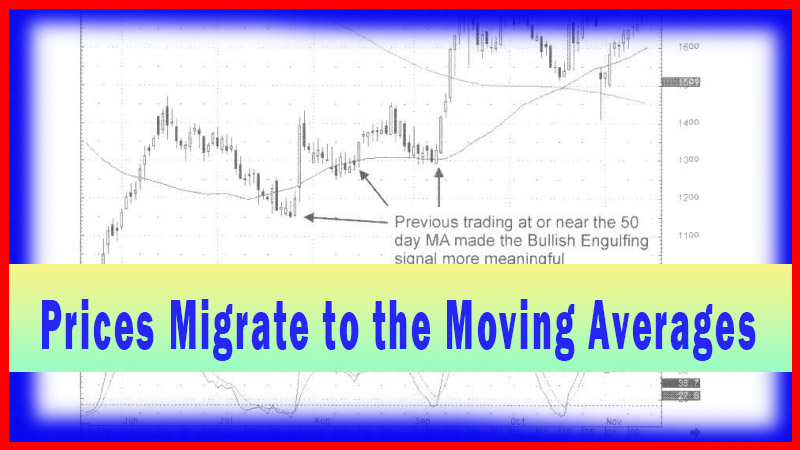
Prices Migrate to the Moving Averages
candlestick analysis, candlestick signals, bullish candle, Moving Average Crossover
Course: [ How To make High Profit In Candlestick Patterns : Chapter 2. Moving Averages ]
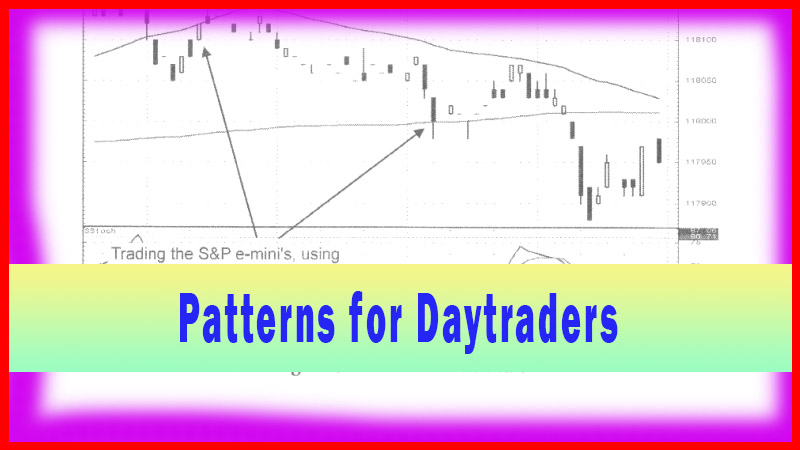
An observation made when doing candlestick analysis is that prices tend to stay near a major moving average. If prices move too far away too fast, they have a tendency to come back toward the moving average. It is advisable to start looking for candlestick signals near the moving averages, in conjunction with stochastics.
Prices Migrate to the Moving Averages
“We cannot hold a torch to light another’s path without
brightening our own.”
An
observation made when doing candlestick analysis is that prices tend to stay
near a major moving average. If prices move too far away too fast, they have a
tendency to come back toward the moving average. It is advisable to start
looking for candlestick signals near the moving averages, in conjunction with
stochastics. It also becomes obvious to start watching for candlestick signals
as the distance of the price becomes extended in moving away from a moving
average. The stochastics are also confirming!
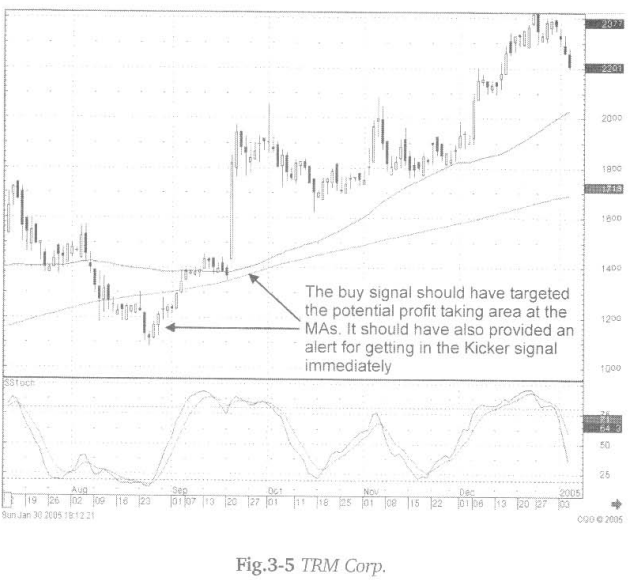
As
can be seen in Fig. 3-5, the TRM Corp. chart, the signals are the important
factor. The moving average is an important secondary target consideration. The
Doji at the bottom in late August, followed by bullish candles, indicated
where the potential resistance areas were going to be. The bullish candle,
moving up through the 200-day moving average, all the way to the 50-day moving
average, produces the first resistance level. Selling anywhere in that area
produced a reasonably good profit. What will the trend do from there? As seen,
just after mid-September, prices came back and just touched the 200-day moving
average. The evaluation becomes easy at that point. Continued selling, bringing
prices down through the 200-day moving average, would have been a good
indication to start shorting the stock. This would have been the time to be
observing what was going to happen at these important levels.
The
“probabilities” indicate a downtrend was likely to
start if the 200 MA was breached to the downside. Being alert, to watch for
something major to happen at the moving average, creates an advantage. A
watchful candlestick analyst can take advantage of a powerful signal as it is
forming. Upon seeing the gap up from the moving averages and the potential of a
kicker signal forming, and knowing that this is the scenario for dramatic
moves, the candlestick investor has a map for getting into this trade set up
immediately. Would the big price move of the Kicker signal been anticipated?
Definitely not! However, having the knowledge that moving averages have a
significant influence on price trend is valuable. Seeing a Kicker signal forming
produces the opportunity to be in a big move as it happens.
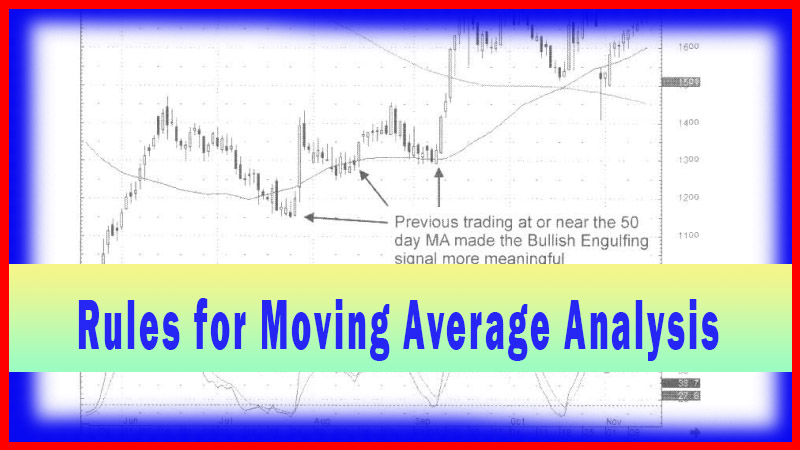
As
noted, the indecisive signals over the next few days, the Doji, Hanging Man and
Shooting Star formations indicated that the buying pressure had disappeared.
The next major opportunity for a good price move occurred on an Inverted Hammer
signal occurring right at the 50-day moving average at the end of November.
This move would have been exploited by having the knowledge that a candlestick
signal, occurring at the 50-day moving average, should have more substantial
potential than when occurring without a major average involved. This is not
rocket science. This is the accumulation of observations, having positive
results an inordinate percentage of the time in the past. Major moves seem to coincide
with candlestick signals at the major moving averages. Use this knowledge to
your advantage.
“The aim of education should be to teach us rather how to think,
than what to think - rather to improve our minds, so as to enable us to think
for ourselves, than to load the memory with thoughts of other men.” - Bill
Beattie
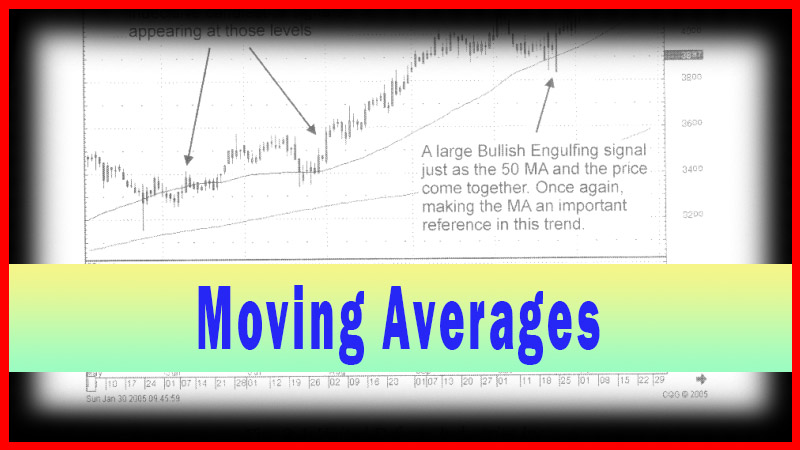
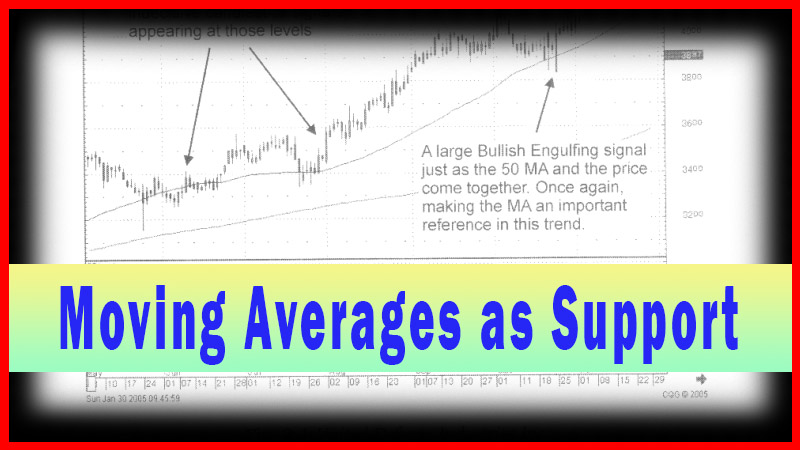
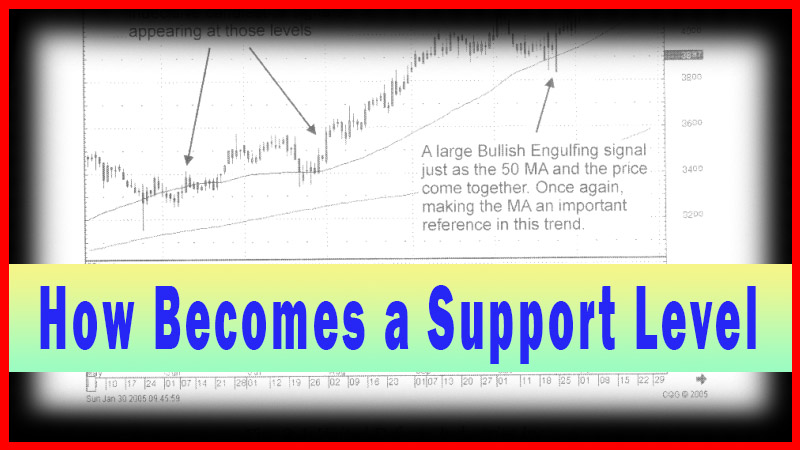
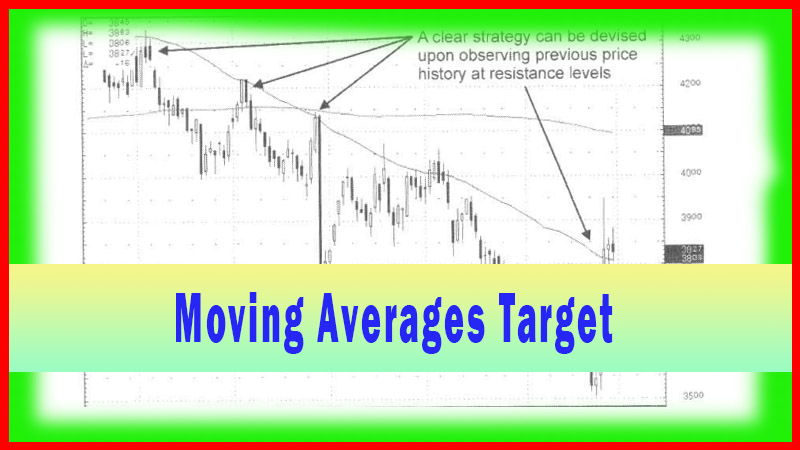
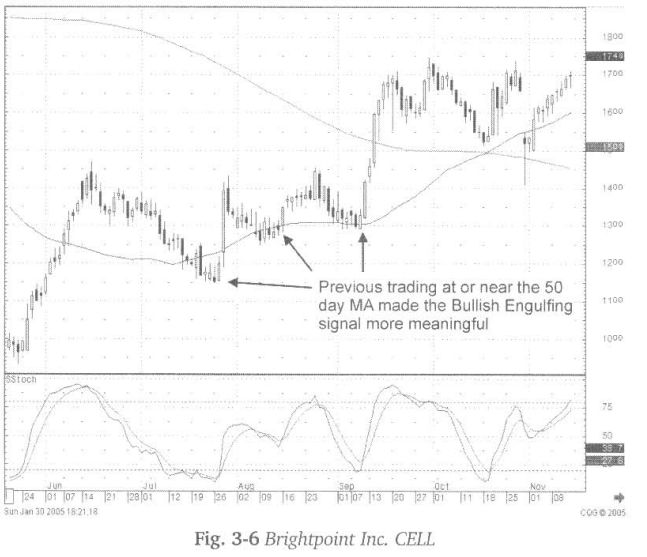
Whether
a trend gets to the next moving average or not, it at least provides a target.
It can be seen in Fig. 3-6 the Brightpoint Inc. chart, if price breaks through
an important level, such as we see in late July, and starts pulling back, at
least it can be anticipated the moving average might act as a support level.
The pullbacks of early August and early September clearly reveal the 50-day
moving average acted as an important support level. The Bullish Engulfing
pattern in early September, followed by strong buying now makes the 200-day
moving average the new potential target.
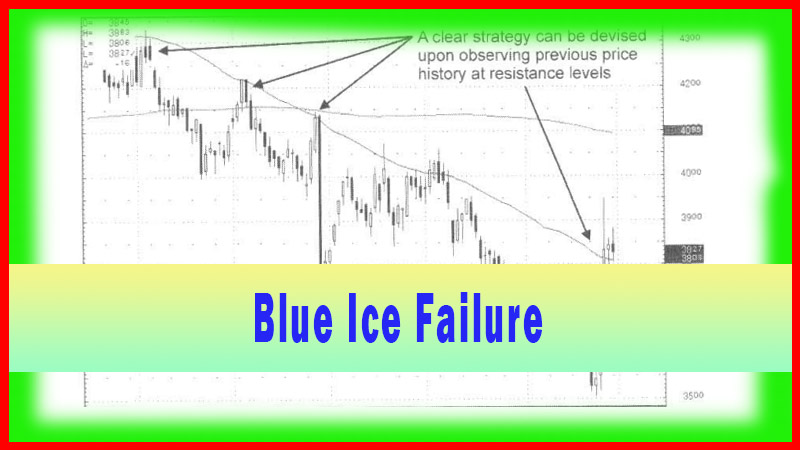
That
target is demonstrating not to be a resistance level as the large bullish
candle pushed right through it in mid-September. The crossing of the two averages
in mid-October once again acted as a significant reversal indicator. The quick
drop in late October in between the two major averages immediately revealed
candlestick “buy” signals starting the next leg up. Most investors do not know
what to do with this chart pattern. Candlestick investors have the knowledge to
take advantage of this pattern. The gap down in late October, the strong hammer
signal followed by a small hammer signal, followed by a bullish engulfing
pattern in the proximity of the moving averages are all strong candlestick
signals of an ensuing reversal.
When
an investor can recognize that a price trend of a stock, or any trading
entity, is very closely related to the moving averages, implementing high-
profit strategies become easy. It also decreases the elements of human emotions
involved in the investment decisions. Note in Fig. 3-7, Borland Software
Corp.’s chart, the moving averages act as a definite influence on the price trend.
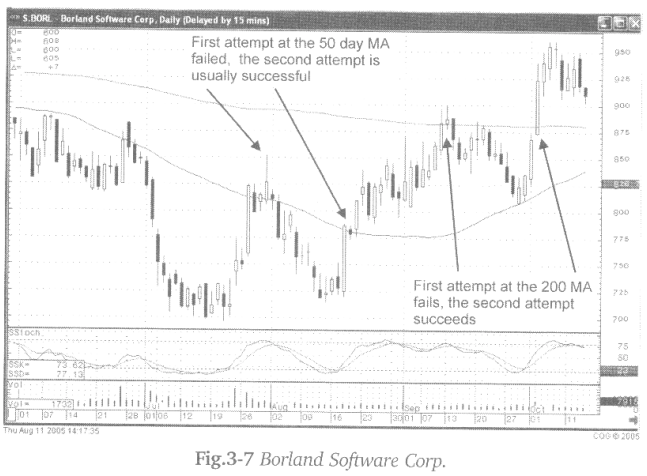
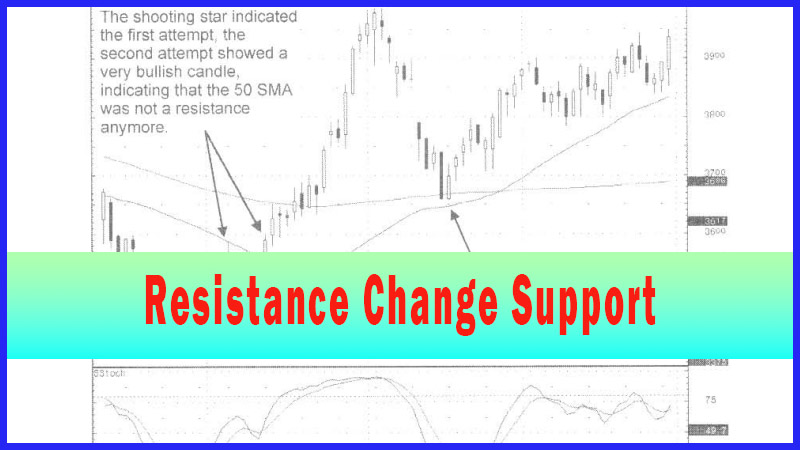
Notice
that the 50-day moving average acted as a resistance level on the prices first
attempt, around the 1st of August. The second attempt in mid-August succeeded
as the stochastics were in the oversold area, starting to come up. The success
of the second attempt now makes the 200-day moving average the next target. The
Evening Star signal was a clear indication that the sellers had stepped in
during the mid-September attempt at the 200-day moving average. Once it failed,
where was the next target? The 50-day moving average! Notice that the Piercing
pattern, at the end of September, occurred by opening right on the 50-day
moving average. The additional confirmation is stochastics being in the
oversold condition. This started the second attempt at the 200-day moving
average. The bullish candle, that breached the 200-day moving average, clearly
indicated that level was not going to be a resistance area anymore. This now
puts a completely new dynamic into the potential uptrend. The candlestick
analyst realizes there may be a new dynamic to the uptrend. That allows the
investor to start making investment decisions based upon that knowledge.
How To make High Profit In Candlestick Patterns : Chapter 2. Moving Averages : Tag: Candlestick Pattern Trading, Forex : candlestick analysis, candlestick signals, bullish candle, Moving Average Crossover - Prices Migrate to the Moving Averages