How to Trade Various Currency Pairs?
FOREX CURRENCY PAIR | BITCOIN | CRYPTOCURRENCY | MAJOR TADING PAIRS | GBPJPY TRADING SET UP | XAUUSD TRADING SETUP | GOLD TRADING SETUP
Course: [ Top Trading Strategy ]
Do you know that each currency pair has its own personality? Not only must you know and understand their own quirks, you also have to adapt your trading strategies to tailor to each one for maximum success. Let me highlight some important characteristics of the four Majors, namely, EUR/USD, USD/JPY, GBP/USD and USD/CHF.
How to Trade Various Currency Pairs
Do you know that each currency pair has its own personality? Not only must you know and understand their own quirks, you also have to adapt your trading strategies to tailor to each one for maximum success. Let me highlight some important characteristics of the four Majors, namely, EUR/USD, USD/JPY, GBP/USD and USD/CHF.
EUR/USD
EUR/USD is the most liquid currency pair, and is
one of my favourite pairs to trade because of its smoother movements, as well
as its small pip spread of around 3 pips (which is determined by each
brokerage). Some characteristics are listed below:
- Anti-dollar
effect: The Euro is known to be anti-dollar since it moves in contrary to
the underlying U.S. dollar direction. If the market is overall bearish on
the U.S. dollar, the Euro will have an underlying bid resulting from
overall U.S. dollar selling.
- Smoother
and slower moves: Its slow movement relative to the other major dollar
pairs is due to an antagonistic selling of the EUR/CHF cross in the face
of U.S dollar selling when traders wish to bypass other dollar pairs like
the USD/CHF. Thus, EUR/USD is an ideal pair for short-term traders who are
averse to jerky movements.
- Negative
correlation to USD/CHF: When EUR/USD goes up, USD/CHF goes down, and the
reverse is true too - when EUR/USD goes down, USD/CHF goes up. When you
trade EUR/USD, compare it with a chart of USD/CHF to form a much clearer
picture in your mind, especially when EUR/USD is approaching levels of
support and resistance. By seeing if these pairs bounce off or break out
of the equivalent technical levels, you can expect a predictable outcome
for EUR/USD.
- Positive
correlation to GBP/USD: When EUR/USD goes up, GBP/USD tends to go up too,
and the reverse is true too. Refer to Figures 1 and 1A to see the
correlated moves between EUR/USD and USD/CHF and GBP/USD.
- Leading
or lagging effect: Sometimes, EUR/USD can take the lead before USD/CHF,
and when that happens, you will have to decide which technical levels
among these two pairs matter the most. This can be influenced by imminent
economic releases or strong psychological levels.
- Average
daily pip range of 100 pips.
- Usually
most active and volatile during the European session between 0700-1700
GMT. Moves an average of 80 pips during this session. It may be due to a
lot of position reshuffling among the big players at this time prior to
the opening of the U.S. market.
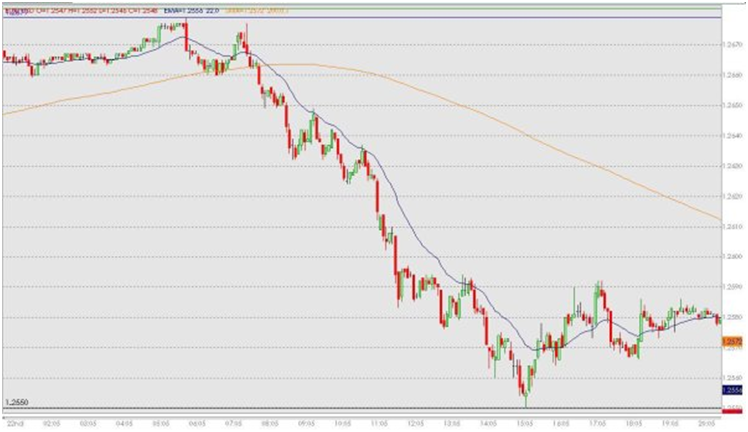
Figure 1 - 5
min chart of EUR/USD on one screen
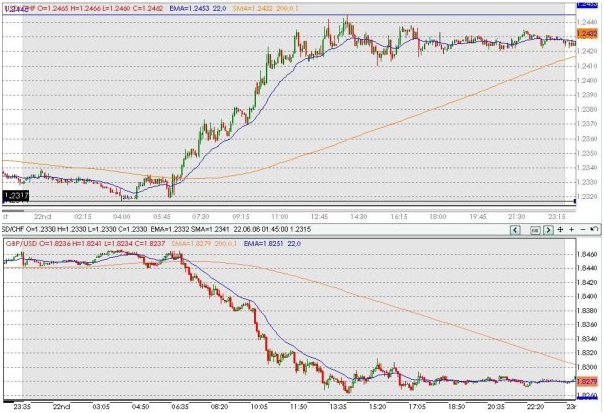
Figure 1A - 5 min chart of USD/CHF (top) and GBP/USD (bottom) on another screen. Compare it with Figure 1.
USD/JPY
USD/JPY is the second most liquid currency pair.
Some characteristics are listed below:
- Prolonged
trending periods: USD/JPY tends to act as a regional currency proxy for
China and other less-liquid Asian currencies. As a result, it is
frequently subjected to prolonged trending periods as geopolitical or
trade risks surface. Exploit this by buying at trendline/price support and
selling at trendline/price resistance. Refer to Figure 2.
- Fewer
false breakouts: This is due to the clustering of Japanese institutional
orders around similar technical or price levels. For example, big-sized
offers at a resistance level will need to be absorbed if that level is to
be broken. This is likely to happen only if a larger market move is
unfolding, and this suggests that the breakout is more likely to be
sustained. Hence, USD/JPY is ideal for breakout traders who employ entry
orders on breaks of trendline or price support or resistance.
- Particularly
susceptible to talks surrounding the Yuan revaluation, and tensions
between Japan and North Korea. As a net exporter, Japan competes heavily
with China. China's artificial suppression of the Yuan has forced Japan to
intervene by artificially depreciating the Yen many times in history.
Revaluation would be significantly positive for the Yen, and hence
negative for USD/JPY.
- Usually
most active during the Asian session between 2400-0900 GMT, where it moves
an average of 90 pips. It tends to move in quite an orderly manner during
the Asian and European sessions if there are no economic releases or
comments from government officials
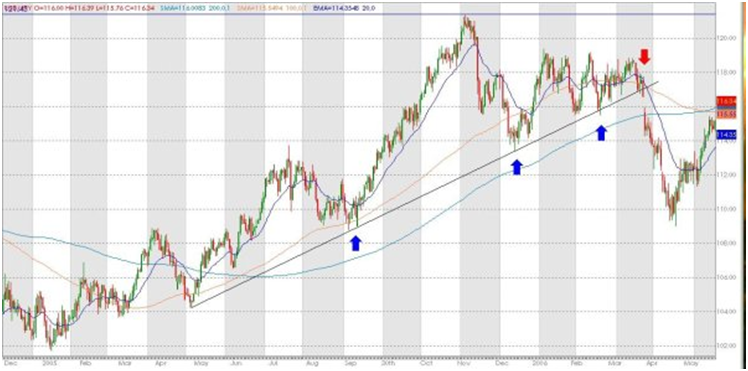
Figure 2 -
Daily chart of USD/JPY
As we can observe in Figure 2, a rising trendline has been drawn from May 2005 to around April 2006, and within this period, the three up-arrows indicate bounces off the trendline. The downside breakout that occurred in April 2006 is indicated by the down-arrow, showing a strong sustained breakout.
GBP/USD
Cable, as this pair is known, is one of the most
liquid currencies in the world, attributed to the United Kingdom's highly
developed capital markets. Some characteristics are listed below:
- Tends
to be positively correlated to EUR/USD: When EUR/USD goes up, GBP/USD
tends to go up too. The reverse is also true.
- Jittery
and jerky movements: False breakouts of technical levels are common. It is
not unusual for these stop-loss driven false breakouts to trade 15-25 pips
through a support or resistance level before reversing direction. Refer to
Figure 3.
- Tends
to move more quickly through support or resistance levels compared to
EUR/USD, and usually without much retracement, if any.
- Although
GBP/USD is more liquid than the EUR/GBP cross, the latter is usually the
leading indicator for GBP strength. This is because Britain's primary
trade and investment partner is Europe. As a result, movements in the
EUR/GBP cross can affect GBP/USD, and vice versa.
- Usually
most volatile during the European session between 0700-1700 GMT, with an
average range of 100 pips. If you have very tight stops, you run the high
risk of being stopped out very quickly.
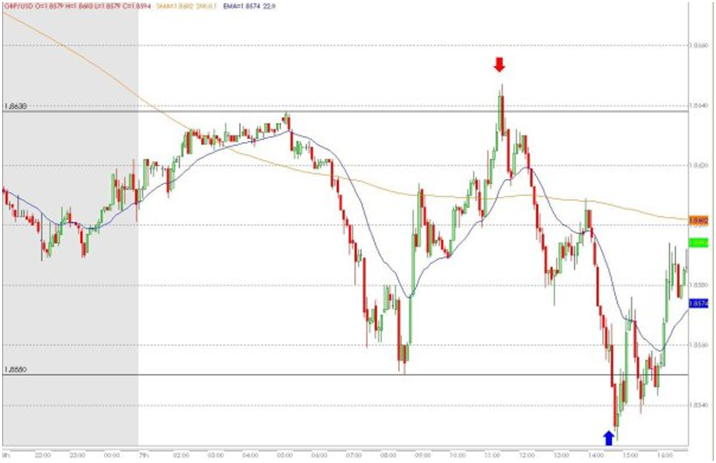
Figure 3 - 5
min chart of GBP/USD
From Figure 3, we can see the two arrows indicating false breakouts within a day, and the overall jerkiness of the pair. The false upside breakout traded 9 pips above the resistance level, whereas the false downside breakout traded 22 pips below the support level.
USD/CHF
Swissy, as this pair is known, is one of the
least liquid currencies among the majors. Some of its characteristics are
listed below:
- Traditional
"safe-haven" status: This is due to its political neutrality as
well as its famous privacy laws of its banking system. However, very
recently (around July 2006), the US dollar has become the safe-haven
currency instead for investors and traders, and that could be due to
higher bidding for oil and gold, which are priced in the US dollars, and
thus could help in keeping the US dollar buoyant.
- Quite
similar to GBP/USD in terms of volatility and liquidity. Like Cable, it is
more prone to false breakouts and tends to move quickly through support or
resistance levels without much retracement, if any. When trading it, you
have to decide extremely fast and be quick in placing entry stop orders
for breakouts, especially if you are the sort who usually prefer to wait
for retracement before getting into the trade. Base your trades on either
hourly or daily charts instead of anything in a shorter time-frame.
- USD/CHF
is generally a synthetic currency derived from EUR/USD and EUR/CHF. You
might want to look at charts of both pairs to get an idea of where the
Swissy is heading for.
- Affected
mainly by US data rather than its own domestic economic data, unless talks
of hiking interest rates within Switzerland surface to sway its direction.
- Watch
out for any changes in banking regulations by the Swiss because that will
definitely have an impact on the Franc with regards to its
"safe-haven" status.
- Usually
most volatile during the European session between 0700-1700 GMT, with an
average range of 100 pips.
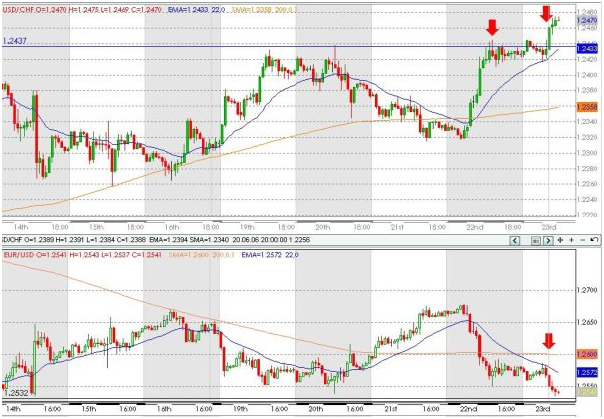
Figure 4 -
Hourly charts of USD/CHF (top) and EUR/USD (bottom).
Figure 4 shows that USD/CHF has tested the
resistance level several times (indicated by arrows), and finally breaks above
(indicated by vertical line), whereas EUR/USD still has not tested its support
level at the time when USD/CHF breaks out (indicated by vertical line). This
suggests that EUR/USD is very likely to test its support and possibly break
below it soon. This also illustrates how Swissy tends to lead the move ahead of
EUR/USD.
Trading Tips
- If
you are new to trading, I recommend that you start off with EUR/USD, and
monitor the movements of USD/CHF as well.
- Demo-trade
the different currency pairs to see how well you can 'feel' them, and how
you can adapt your strategies to them.
- If
you want to trade GBP/USD, it may be better to position-trade it, that is,
holding your positions for a few weeks to a few months, when technical or
fundamental trends suggest a possible large movement in price is likely to
occur, but which may not be fully played out for several weeks or months.
- Short-term
trading of GBP/USD can be very risky to new traders due to its inherent volatility,
as they will tend to get whipsawed very frequently.
- Before
you trade a new currency pair, find out as much as possible about the
countries of these currencies.
- Effects
of carry trade may affect the movements of a currency pair.
Top Trading Strategy : Tag: Top Trading Strategy, Forex : FOREX CURRENCY PAIR | BITCOIN | CRYPTOCURRENCY | MAJOR TADING PAIRS | GBPJPY TRADING SET UP | XAUUSD TRADING SETUP | GOLD TRADING SETUP - How to Trade Various Currency Pairs?