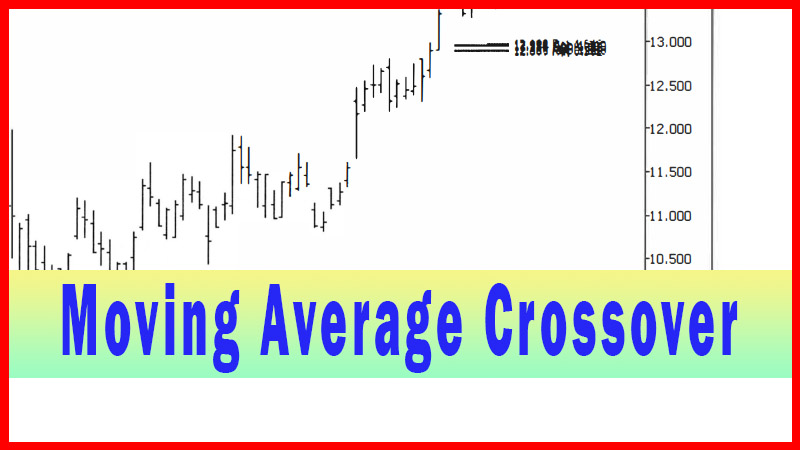
Moving Average Cross Strategy
long trades, Short trades, Moving Average, Best entry techniques, Potential Trade Area
Course: [ Best Trading Entry Techniques : Trade Entry Techniques ]
the ‘moving average cross’ entry technique, let’s reiterate a few assumptions first. These assumptions apply not only to this chapter, but also to all the techniques in the following chapters
Moving Average Cross
Before we proceed on to the details of the ‘moving average
cross’ entry technique, let’s reiterate a few assumptions first.
These assumptions apply not only to this chapter, but also to all the
techniques in the following chapters.
First off, it’s assumed one wouldn’t even be
looking at an entry technique unless criterion one, the potential trade area,
has already been addressed. Next, once an entry technique is decided on and
trade size determined, it’s assumed one will have addressed criterion four,
trade management, before the entry is
actually taken.
This should be obvious, since if you initiate
the trade and then try to figure out how you will manage it, you will be trying
to figure out critical details ‘in the heat of battle’. That is something you want to avoid
like the plague. I want to make all critical decisions in the cool, calm of the
off-market hours. I want to have one sole purpose when the market is ‘live’,
and that’s to be an execution robot.
If I’ve laid out all the possible scenarios
that can occur, and pre-decided on what my action(s) will be when they occur, I
can simply be an ‘execution robot’ when the pressure is on. I can’t
over-emphasize how important I feel it is to not make decisions on the fly.
This doesn’t mean that you don’t take action on the fly, but means that you
don’t have to think out different courses of action, decide on the possible
outcomes of these courses of action, and weigh up the pros and cons on the fly.
That’s a recipe for disaster, in my opinion. I make all my decisions before the
market opens.
Now given all these assumptions, and the
context of the entry technique within the plan, let’s move on to the techniques
themselves. I will present quite a few techniques in the chapters that follow,
and each has its own ‘personality’. I use different techniques for different
situations. A lot of the basis for my decisions on which technique to use in a
given situation is experience, and that’s something I can’t give you. I will
give you hints and tips on my thinking process as often as I can, but to some
extent you will have to experiment on your own and test the ideas with your own
style, in order to make your own decisions on which technique you might use in
a given situation.
The moving average cross technique is an
extremely simple technique to set up and use. Entry is simply triggered when
the moving average is crossed, as the name implies. But does that mean as soon
as the price crosses the average? Or when it closes for the first time above (for long trades) or below (for
short trades) the average? And what moving average? Simple or exponential
moving average? What period for the moving average?
The moving average cross entry may work for
you, but only if you tailor it to your style and needs.
As soon as you think about tailoring something
to fit your needs, you see that there would, then, be no single way to
configure it so that it would work well for everyone, in varied situations.
This is perhaps the single-most important thing you should take from this book.
A technique is only as good as how well you are able to utilize it to suit your
own personal needs.
By this, I don’t
mean optimizing. I don’t mean to tweak it until it maximizes the results in back
testing. I mean pick techniques to meet a specific need you have, techniques
that are suited to the unfilled part of your plan. Let’s get more specific,
looking at the moving average cross technique.
This technique, as I mentioned, is extremely
simple and easy. Right off, that tells you that you shouldn’t expect too much
from it. It would be a technique I would use, then, when I don’t need a lot of
confirmation. That’s the first screening tool I use when trying to decide on
which entry technique I might use. How much confirmation do I want? Each entry
technique could be roughly assigned to a level of confirmation that it provides.
It only makes common sense, then, that the
less confirmation a technique provides, the more signals you will get, and that
more of those signals will be false. If you want a lot of confirmation, you’ll
get a lot less signals, but usually a lot less false start. Another thing I
frequently see is that the less confirmation the signal provides, the closer
your stop can usually be.
This puts you into a decision-making process
where you see that you can frequently stop out with a smaller loss on the lesser
confirmation techniques, but you will take a larger number of those losses. On
the other hand, as you go up the spectrum towards larger and larger degrees of
confirmation, the losses will be larger and larger, but less and less frequent.
In my experience it’s just about a wash, with all the techniques being roughly
the same over the long run.
So why have multiple techniques? My next
screening tool is to screen for a technique that is better suited to the way
that particular issue is trading at that time. When I say that I think that the
net variance between each technique is a wash over time, I say that given the
assumption that the techniques are applied only when the conditions are
suitable for that particular technique. I will do my best to state how I best
like to use each technique, and give examples, as we go along.
Looking at the moving average cross technique,
we know it is simple and has very little confirmation. That begs the question,
‘When would I want just a small amount of confirmation?’ For me, step one is to
choose my ‘potential trade area’, as discussed earlier. But not
all setups are equal. You can make a judgment as to how confident you feel
about that setup.
Let’s make one thing clear, though, about your
judgment call on the setup.
Be wary of relating your emotional feelings
about the trade to your level of confidence. Frequently the best trades can be
the scariest. If you judge the confidence you have in a trade based on this
emotional fear level, your judgment could frequently be exactly opposite of
what it should be.
I’m talking about a technical judgment based
on comparing the setup to a group of similar setups from your experience base.
You might be saying ‘Given this type of setup, I rate this one a seven out of
ten, compared with the large group of these I have seen and traded in the
past’, or something to that effect. Perhaps you decide you will only trade ones
that rate from seven to ten, and that a seven requires a maximum confirmation
technique and then a gradient applies, and the setups that rate a ten match up
with the techniques that have the least amount of confirmation.
But why does it that way? Why not just go with
the maximum confirmation in every case? Remember, the more confirmation you
desire, the smaller the number of trade signals you will get, and the greater
the distance your entry point will likely be from a logical stop loss point. By
not using the ‘least restrictive’ technique that fits the scenario,
you may miss trades that perhaps you don’t want to miss, and pay more for that
entry than you otherwise would have to.
I, personally, try to use the least
confirmation technique I am comfortable with for that given trade. I feel this
is one of my better ‘secrets’ (well, it’s not a secret now!), and something I
can’t recall ever having heard anyone talk about before.
I also evaluate the potential trade area in
terms of what type of trade it is, to determine how much confirmation I want.
Although I have no hard and fast rules that I can quantify for you, I do apply
a fairly uniform standard to all my potential trades. Some trades are lower
probability than others, just by their nature.
This doesn’t mean that these trades may yield
less money in the long run (they may pay out more per trade), just that they
work out less frequently. For trades like that I prefer a larger degree of
confirmation. There is a gradient of trades and a gradient of triggers, and I
try to match them up as best as I can.
Let’s assume we have a potential trade area we
like, and if we get a trigger in this area, we want to take a trade. Let’s also
assume that we have decided that the trade is a fairly high probability trade,
and that the setup is looking really good so far. We are willing to initiate a
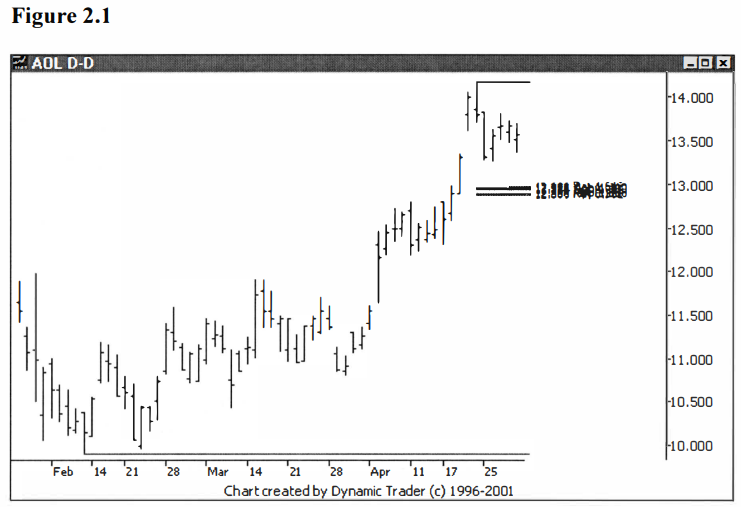
trade with just a small amount of confirmation. First, let’s look at an example
of a potential trade area, based on a Fibonacci grouping (for more information
on constructing and trading Fibonacci groupings). See figure 2.1.
A simple choice for a moving average cross
trigger would be a close above a 10-period simple moving average. This is a
middle of the road average for short-term trading, and the requirement of just
one close above the average is also middle of the road. This is a good starting
point to look at.
Let’s first look at the same issue as above,
but with the 10-period simple moving average on the chart. Before we do this,
though, let’s give this a little thought. Do we want to look at the issue on
the same timeframe? The answer is no, we want to go down one timeframe.
Remember, what I like to do is use three
timeframes, with the ‘middle’ timeframe being the ‘traded’ timeframe.
The higher timeframe is for context and the lower timeframe is for entry. I
usually use a timeframe ‘jump’ of approximately three to five times, but when going down
from a daily, I go a little more of a jump, in order to use a very common bar.
Hence, with figure 2.1 being a daily chart,
I’ll choose to use a 60-minute for entry. So, we’ll look at the issue, now with
a 10-period simple moving average, on a 60-minute chart. We’ll also move a
little bit ahead in time, as we approach the potential trading area. See
figure 2.2.

The first thing I notice is how ‘choppy’ AOL is with
respect to its 10-period moving average. My first inclination would be to
consider another entry technique here, one that perhaps is better suited to such
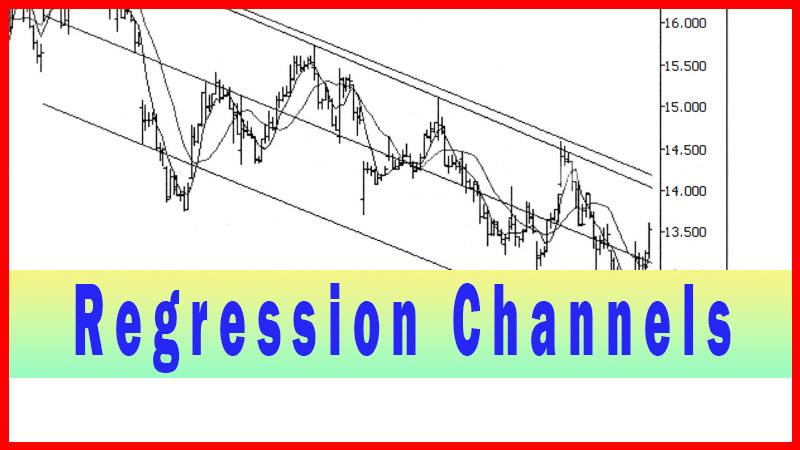
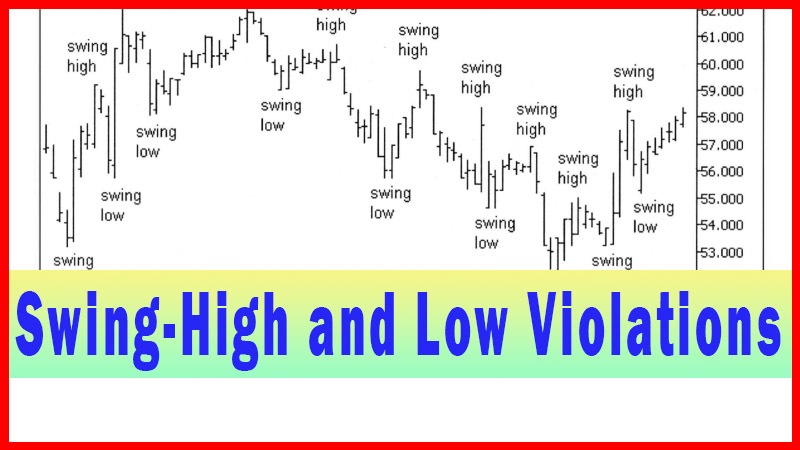
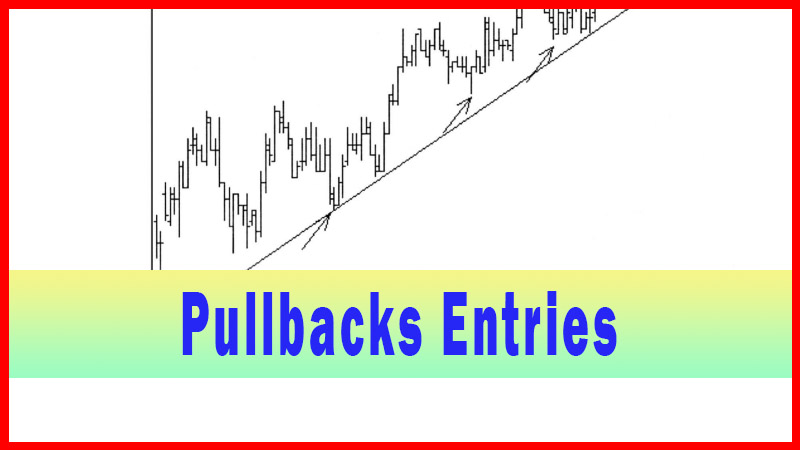
‘chop’. I would be thinking about a trendline violation technique or a
regression channel violation technique, or perhaps even a swing-high or low
technique.
I will cover all these in detail in later
chapters, and I will use this example again for comparative purposes. So why
even continue here with the moving average cross technique? I already stated I
felt very confident with the setup and so I preferred to have a lower
confirmation entry technique.
Remember, I like to use the least confirmation
technique that I feel is warranted, so as to maximize my number of potential
trades that trigger. Despite the ‘chop’, I still want to see how this one look
as it gets closer to the potential trade area. Let’s advance ahead in time as
AOL approaches the area, we might consider trading. See figure 2.3.

The first thing I notice here as time has
moved on a bit, is that at least AOL is behaving in a manner where I would
still consider using the moving average cross technique. I am looking for a
somewhat smooth decent into the area, mostly trending down and staying below
the moving average.
I don’t want AOL to be going above and below
the average multiple times. This is obvious, since each close above would be a
signal, and most would prove to be false signals. Keep in mind here what my
objective is. I think this grouping (or more precisely, two very tight
groupings) will reverse AOL and the larger daily timeframe trend will reassert
itself.
Some traders would simply ‘fade’ the trade and
take it as it enters the zone. This is a valid entry technique. It is on the
scale on the end that says ‘no confirmation’. You could move it on the scale a
tiny bit, to ‘a tiny bit’ of confirmation, by simply hesitating for a little
while and watching to see if the issue slows down or appears to stop, as
opposed to just plowing right through the area.
For me, I don’t like either of these two
techniques, although I do use them under certain circumstances. If I’m very
confident in the trade’s potential, I want just a bit more than the ‘fade’,
or the ‘fade with a pause’. Hence, I might choose the moving
average cross technique. This is why I am hanging with this AOL example up to
this point. Let’s watch as AOL enters the potential trading area. See figure
2.4.

What a difference a few bars can make. The
last bar is a very significant plunge into the top of the groupings, and is a
little disconcerting. I have noticed, though, that this is a fairly common
occurrence when trading Fibonacci groupings, and if AOL ‘straightens out’ and doesn’t
simply continue to plunge right through the zone, I’m still willing to take a
trigger if it comes off the grouping. Let’s continue forward a few more bars
and reevaluate. See figure 2.5.
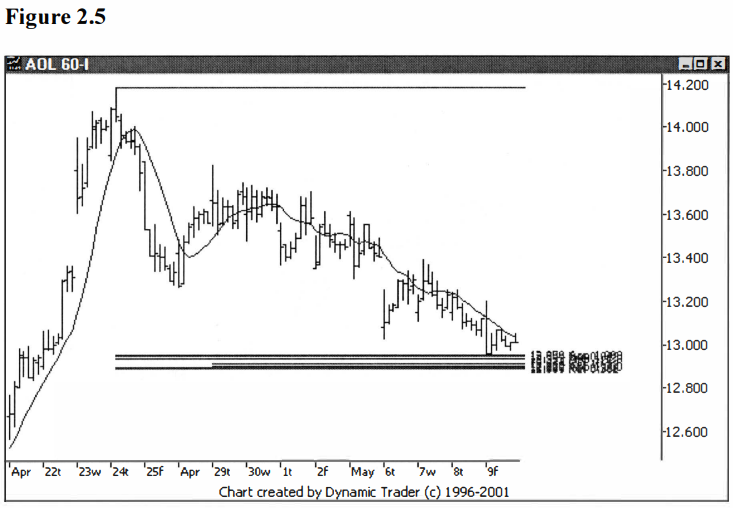
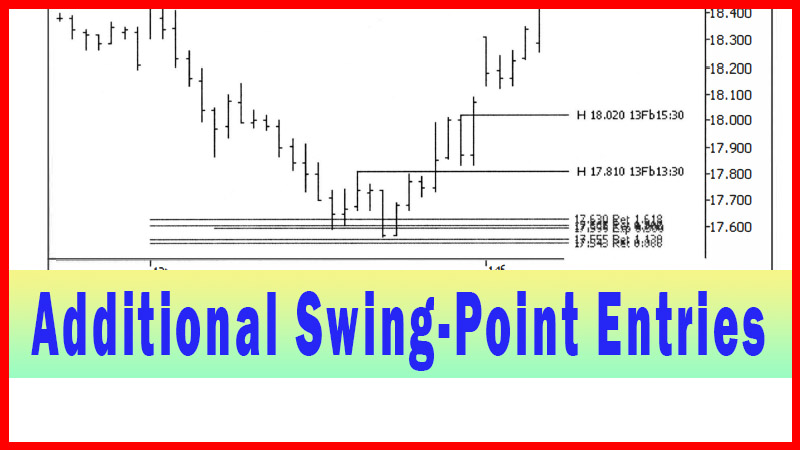
Now we are right at the critical choice point.
AOL has bounced right off the top of the first grouping and hasn’t closed above
the moving average for eighteen bars. It came off the grouping and went up a
bit, rolled down a bit, and is now moving up a little.
This might just be some congestion, or that
may have been it, a ‘test’ of the bottom and up it goes. I would prefer to get deeper
into the groupings, but we have ‘officially’ hit them, so a cross and close above the moving average now
would be considered a trigger that I would take. Let’s see what happens. See
figure 2.6.

Okay, I couldn’t ask for more on this one. AOL
gapped down on the next bar (which is also the open of a new trading day), went
right down to the top of the groupings again, and then rocketed up, closing
well above the moving average. In fact, it hit the low from the previous day to
the exact penny, and then buyers came in and it went up strong with an
expansion bar and a strong close.
At this point I would be triggered into the
trade. As an aside, I would be using the area of the tight groupings to choose my
stop placement, and I, personally, would be placing a stop just below the lower
end of the groupings. This is one of the main reasons why I like the grouping
technique so much, because it gives me some real nice choices for stop losses.
Let’s finish up this example with a look at
how AOL reacted to the grouping as more time passed. First let’s look at the ‘shorter-term’ trade on
60-minute chart. See figure 2.7.
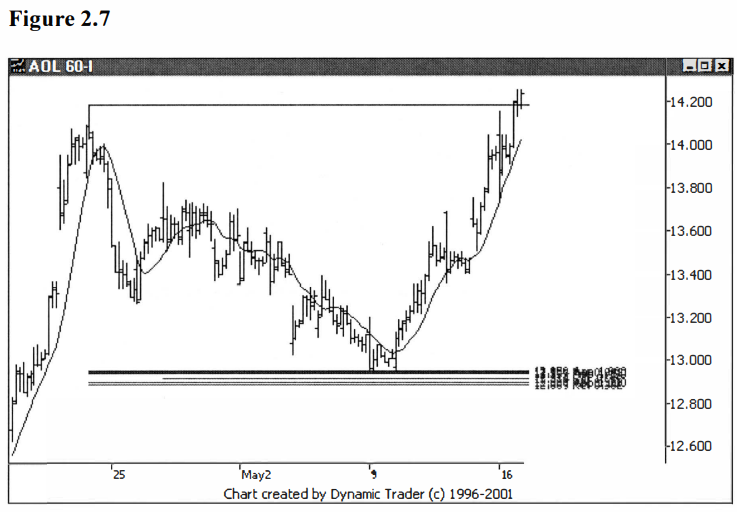
This trade really came off that zone, and the
moving average cross technique did, in fact, work extremely well in triggering
the trade. But remember, the 60-minute chart was only used as the trigger
chart. The trade was on the daily. Don’t change your trade parameters and stay
with the trigger timeframe once you are in the trade. If you are trading the
daily, trade the daily. So, let’s look at how AOL responded on the daily. See
figure 2.8.
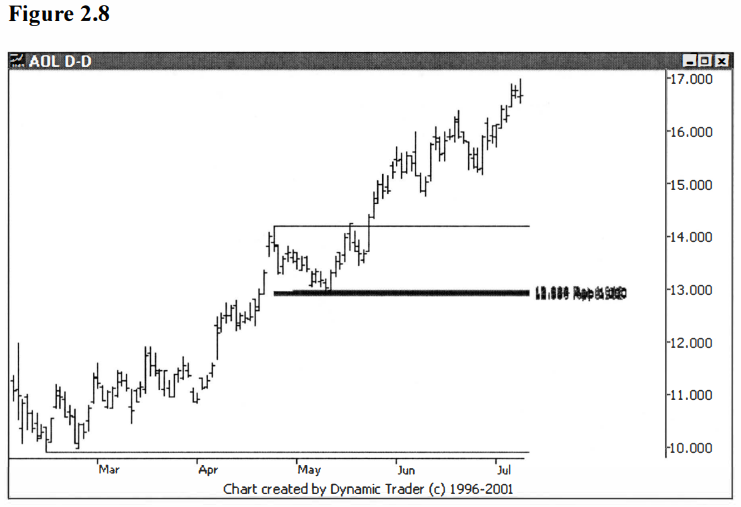
As can be clearly seen, this trade had quite a
way to go on the daily timeframe. If one would have stayed on the 60-minute
timeframe to follow the trade as it progressed, it is very likely that the
perspective would have induced the trader to take a quick profit, and miss most
of what was to come. It’s important not to forget the role of each of the
timeframes within the context of the trade, as well as the context of the entry
technique.
Let’s do one more example, this time with a
longer moving average, a 20- period. What effect, in general, will this have,
as compared to, say, the 10- period we just used? The 20-period will usually
take more movement on the part of the issue to overcome it.
This means you will likely get fewer false
signals. And you will likely be farther away from a logical, technical stop
loss point. You will have more confirmation, but you pay for it. I would
consider using the 20-period when I don’t have the amount of confidence in the
potential trade area as I have when I consider the 10-period.
I understand this may all sounds pretty
abstract or nebulous, but that’s not the intention. It’s just that I don’t have
any hard and fast rules for this. I make decisions based on experience. My
advice would be to look at examples of trade areas that you trade, based on
your style, and then look at the various entry techniques I have presented. See
which ones work best with each different type of trade, and try to see which
ones work best for you, and under what circumstances. Try to match the
technique to the trade.
In essence, that is what I have done. There is
no perfect answer, it's just a matter of finding what works best for your style
and your types of trades. It takes a lot of off-market hours chart work to
figure that out, but that’s trading.
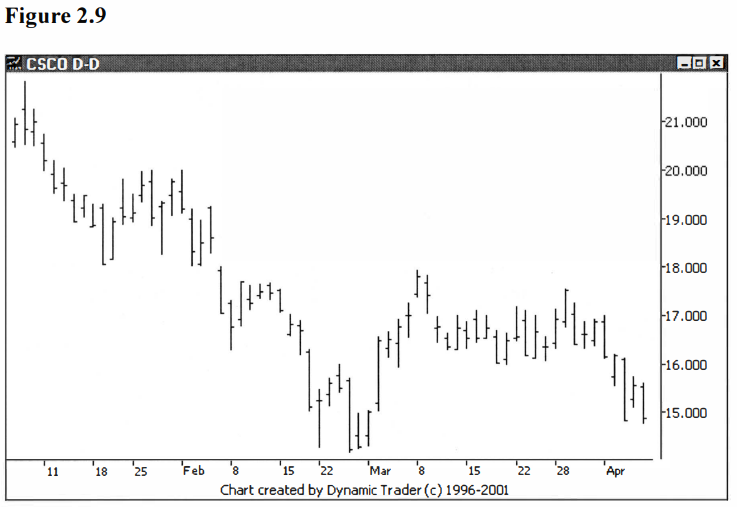
Let’s look at CSCO. I noticed CSCO had been in
a fairly strong downtrend on a daily chart. I had also noticed that it had had
a fairly good-sized correction to the downtrend in the end of February and
beginning of March, and then it resumed its downtrend. I am looking for a
chance to get on board the downtrend. See figure 2.9.
I also realize that, perhaps, we would be
looking at a short trade right in an area of potential support. I, myself,
would want a little bit more confirmation on a trade like this, and I would
only consider it if the groupings looked pretty good and the larger scale
picture warranted it. Of course, the techniques presented are not limited to
use with Fibonacci groupings, I only use the technique here because it is one
of my main ways of trading. Let’s look at a potential trade area for this
chart. See figure 2.10.

The next step would be to dial down to a
smaller timeframe; again, in this case we’ll go to a 60-minute chart. I’ll also
add in the 20-period simple moving average. See figure 2.11.

CSCO is approaching the potential trade area
and is trending up quite smoothly. It is also getting stretched quite a bit
away from the moving average. This can be good, in the sense that issues tend
to be ‘mean- reverting’, that is, they frequently return to
the average.
Having the issue stretched right at the point
when it encounters the groupings can stack the odds more in the favor of the
trader. On the other hand, the entry can be quite far down in this case, with
the stop loss, perhaps set just above the groupings, very far away. That can be
the price for wanting that much confirmation.
Let’s move ahead one bar and see how CSCO is
acting. See figure 2.12.
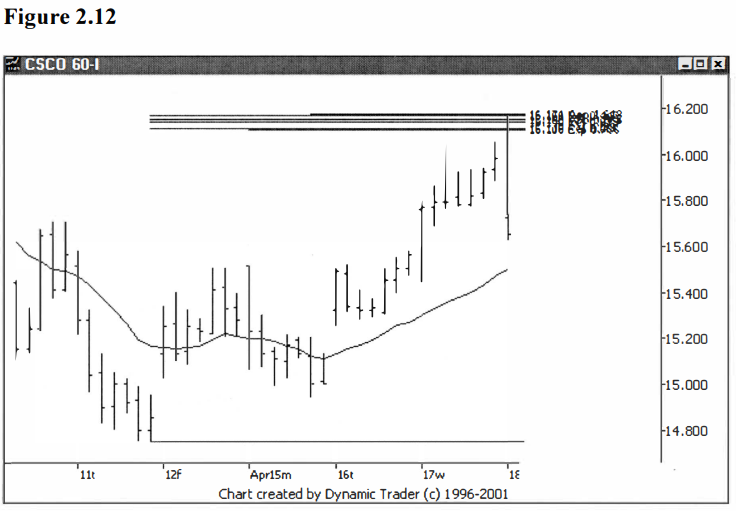
Wow! CSCO gapped down, ran hard straight up to
the groupings, and reversed on a dime and closed the bar below the opening, and
right near the bottom of the bar. It’s plain to see that it didn’t like that
area one bit. It seems that it’s now trading quite far away from the area, and
it still hasn’t closed below the moving average.
If you want more confirmation, this is
something you will have to accept. If you had chosen a faster moving average
you’d likely be in the trade at this point. On the other hand, the amount CSCO
has dropped in fairly small in the context of the daily chart, and that is the
traded timeframe for this trade. Let’s look at CSCO after another bar has
unfolded. See figure 2.13.
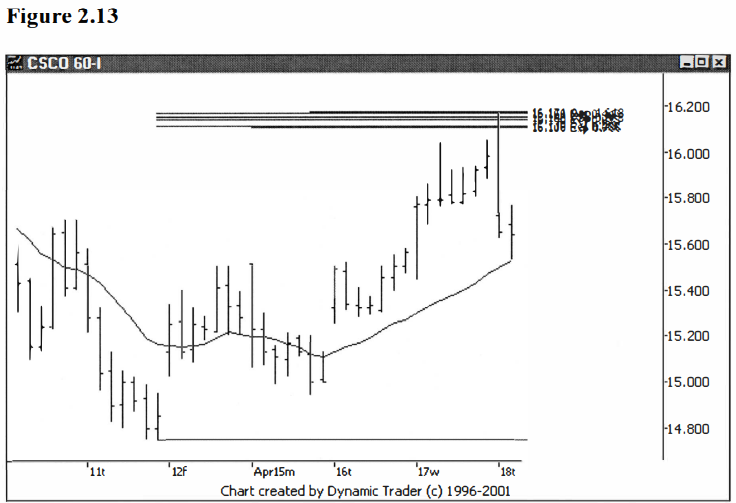
CSCO is still coming off the grouping nicely,
and has dropped just about to the moving average. A close below the moving
average is the trigger. Let’s advance one more bar. See figure 2.14.

That’s it; the trade would now be triggered at
this point. The trigger bar is quite interesting, and worthy of some
discussion. The bar opened pretty close to the previous bar’s close, and it
closed about midway on the bar, with the close below the open. But it was quite
a large expansion bar, with a large lower tail.
If one was strict with the rules, the bar met
the criterion for an entry. This brings up the question of ‘second guessing’.
This bar had a lot of lower-level action, and then it reversed and went up
quite a bit before it closed. Given how far CSCO had already dropped, I might
be thinking it was time for some corrective action to the decline.
If I followed this line of reasoning, I might
decide to abort the trade entry, or sit tight and see how it plays out. The
danger is, the trade may play out exactly as anticipated, and the trade may be
missed. I have found that, although I sometimes ‘guess’ correctly and save
myself a stop out, I frequently watch the trades I skip do exactly what I
originally expected they do.
My point is, for me, I rarely second guess
them. Unless I see something really blatant (and that’s a subjective, experience-based
call), I take the trade if it meets my pre-defined trigger conditions. Let’s
look at how CSCO played out shorter term, on the 60-minute chart. See figure
2.15.
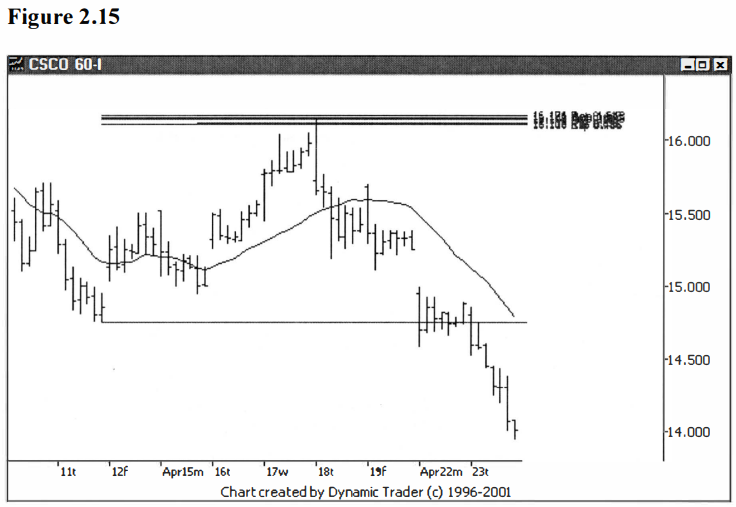
As it turns out, the entry signal would have
worked quite well. There was one bar where it looked like CSCO may have been
reversing, but that bar barely exceeded the expansion bar’s high, only going
one cent higher. Any technical stop you likely would have been using at this
point wouldn’t have even been approached. But remember, the traded timeframe is
the daily. This little blip is hardly noticeable on the traded timeframe. See
figure 2.16.
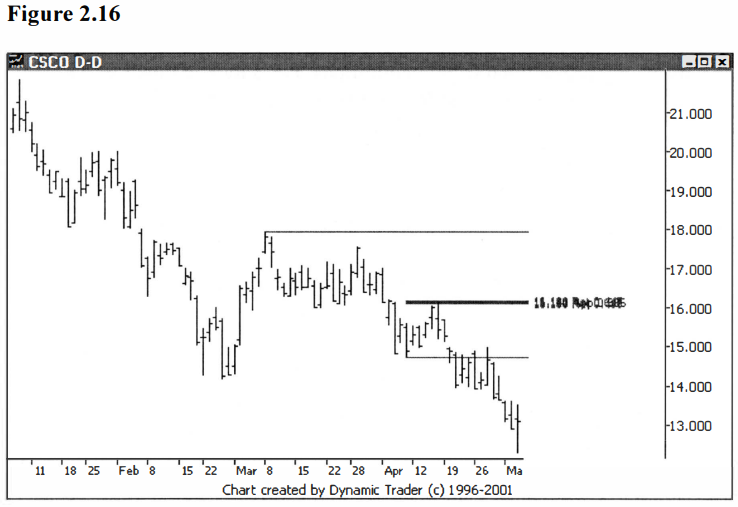
The trade offered quite a bit of a chance for
taking profits and letting some part of the trade ride. When I trade a trend, I
usually scale out and take most of my profits by the time the previous
significant swing-low is exceeded and reaches the area of the 1.272 external
retracement from that swing-low. (The swing-low I am looking at was on February
27, and the swing-high was on March 8).
Although many trades exceed this number, few
go beyond the 1.618 external retracement. Hence, I always put these on my
chart, to help guide my trade management. I mostly use trailing stops for the
majority of my profit taking.
But trailing stops can vary, and how tight you
trail them can depend on where you see potential reversal areas, and areas of
potential support and resistance, coming in. In a nice, reasonably smooth
trend, I’m always watching the area between the 1.272 and 1.618 external
retracement area very closely, and usually have most of my trade off by the
time that area is reached.
Let’s look at the same daily chart as in
figure 2.16, but with the 1.272 and 1.618 external retracements added on to the
chart. See figure 2.17.
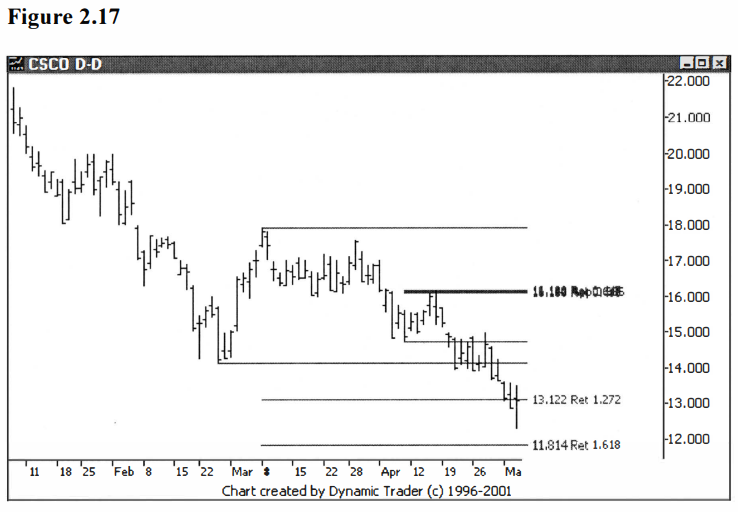
It can clearly be seen that CSCO is right into
that zone between the retracements. In a case like this I would likely have
scaled out of most of the position, using a variety of techniques, with heavy
focus on trailing stops. I will refrain from any further discussion on trade
management here, so as to stay on topic for this book, but I am pointing this
out here for a reason.
I chose this example from the beginning
because, although it did work out quite well, it didn’t work out as well as it
may have. And it is about to throw a curve ball at any trader who is still with
the trade. Let’s move forward one more bar and see what I am talking about. I
will remove the anchor line from the swing-low on February 27, to help with clarity.
See figure 2.18.
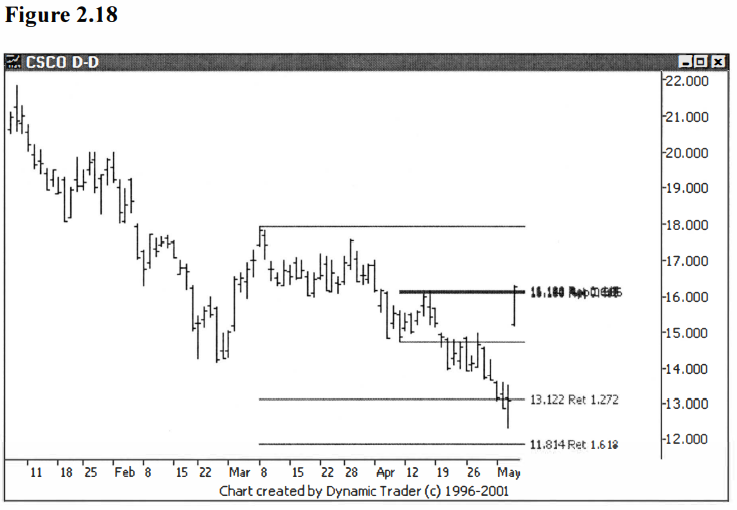
BAMM. A huge reversal, with a massive gap up opening. Low
to high, this is over a 32% move in one bar! The spinning top bar in the
1.272/1 .618 external retracement area was a big-time red flag. But even if you
decided to hold some of the trade at that point, all would not be lost.
The original entry on the trade was at the
close of the first 60-minute bar below the 20-period moving average, and that
was at 15.46. Assuming you would sell on the gap up opening, or thereabouts,
the opening price was 15.23. (Keep in mind that the prices I mention are the
prices when you might be looking to get in and out of the trade. I’m not
suggesting that anyone could actually have gotten these exact fill prices. I
use these prices only as examples, to get a general idea of what’s going on
here.) Given this, the remaining part of the trade would be a scratch.
All in all, I’d consider that a pretty decent
trade. But it still serves as a good example of one of the many things that can
happen in a trade, and how important good trade management can be.
In this chapter we’ve looked at two different
moving average cross entries. One was entry when the first bar closed above a 10-period simple moving average (this was a long trade),
and the other was when the first bar closed below a 20-period
simple moving average (this was a short trade). There are many other
variations, and I encourage you to experiment and find which, if any, help your
trading.
I, myself, like to use a 5-period simple
moving average when the issue is trading smoothly into the zone and I have a
high degree of confidence in the trade. As you may suspect, this is a very fast
setting and is extremely prone to whipsaws. I use it when I’m only one step
away from just wanting to fade into the trade if it hits the zone and stalls.
When I use this technique and want just a bit
more confirmation, I use the 10-period simple moving average. I rarely use any
other variation than the 5 or 10-period simple moving averages. I find that I
prefer other techniques to using a longer period average than the ten. You may
find, though, that your preferences may be different.
Keep in mind that you can also experiment with
exponential moving average, weighted moving averages, and other newer
generation moving averages. To simplify this discussion, the following applies
to long trades; simply reverse for short entries.
You can look at triggers other than the first
bar close above the moving average. You can look at when the issue first trades
above the average, that is, when it breaks the average with just one trade. You
can also look at taking out the high of the first bar that closes above the
average, or taking out the high of the first bar that trades above the average.
The point is, there are a lot of possibilities here,
and it’s a great idea to experiment, on paper, with as many possibilities as
you can think up. Find what works the best for you. Examine and experiment with
not only all the techniques I present in this book, but also with variations on
all the techniques. Try to find the techniques and the variations that suit
yours needs as best as possible.
Best Trading Entry Techniques : Trade Entry Techniques : Tag: Trade Entry Techniques, Forex : long trades, Short trades, Moving Average, Best entry techniques, Potential Trade Area - Moving Average Cross Strategy