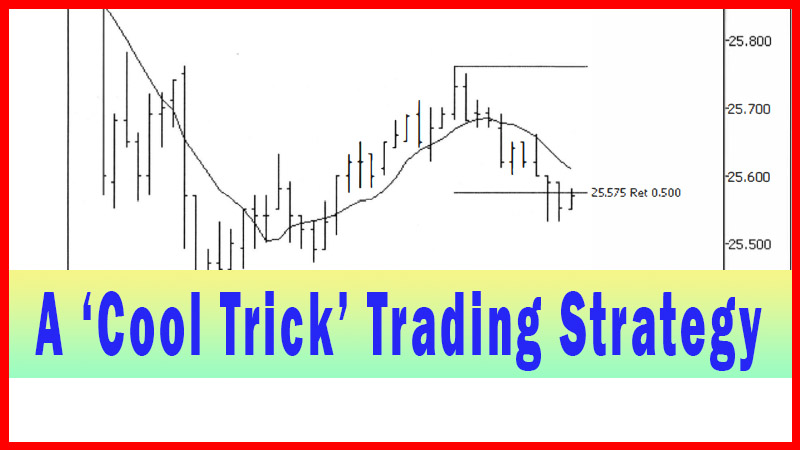
Swing Point Entries Trading Strategy
Swing trading, Double top, double bottom, pivot point Trading, Fibonacci Pullback Trading
Course: [ Best Trading Entry Techniques : Trade Entry Techniques ]
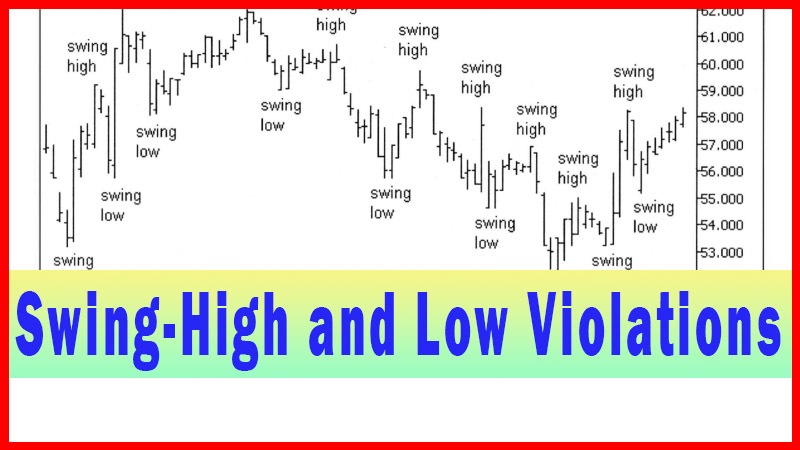
Swing points occurred after the reversal point in the potential trade area. What if there was no tradable swing-point after the reversal? Could a swing- point that occurred before the reversal be used? And what about using a swing-point that forms between a double bottom or a double top.
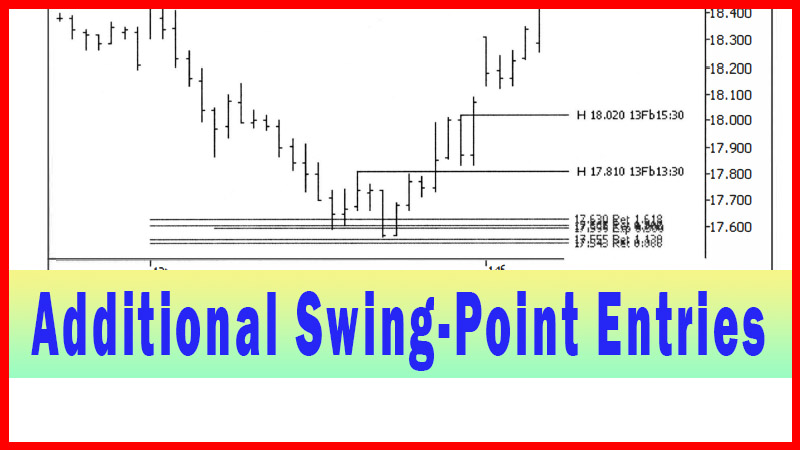
Additional Swing-Point Entries
In Chapter 6 the technique of swing-point
violation entries was covered. All of the examples in that chapter had one
thing in common, though. All the swing points occurred after the reversal point
in the potential trade area. What if there was no tradable swing-point after
the reversal? Could a swing- point that occurred before the reversal be used?
And what about using a swing-point that forms between a double bottom or a
double top?
I have seen a fair amount of work discussing
the relative merits of swing- points before and after a reversal pivot point.
Some authors say that a swing- point before a larger scale pivot is more
important and more useful. Then others say a swing-point after the pivot is the
one that carries the most weight for trading purposes. What about a swing-point
when the reversal pivot point actually has two points to it, i.e., a double
bottom or a double top?
In doing extensive experimentation with
respect to my own trading, I discovered that it didn’t seem to matter all that
much which of the three swing-point variations I used for my trading. What did
matter was that the swing-point was formed with a certain proportion and had a
certain character. I covered that proportion and character in extensive detail
in chapters 6 and 7, and it applies just the same for swing-points that occur
before the reversal pivot and for swings that form as part of a double bottom
or double top.
Keep in mind, when I use the terms ‘double top’ and
‘double bottom’ here, I don’t
necessarily mean in the classical sense. In fact, if the swing-point is to have
the characteristics I have mentioned, it would be precluded from the classical
definition of ‘double top’ or ‘double bottom’,
simply because the two points would be way too close to each other. The term
will be used here just for the convenience, and it shouldn’t be confused with
the much more spread-out classical version of the term.
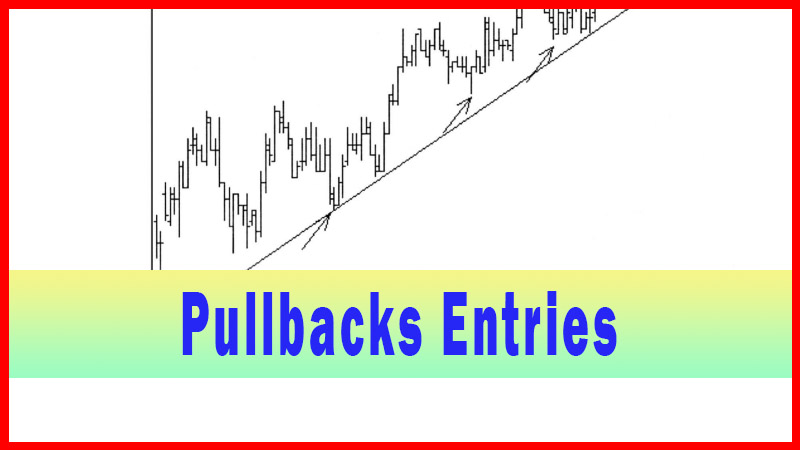
One thing I have noticed is that I find a lot
more trades with the swing point after the pivot (reversal) point than before
the pivot. Although there are plenty of these swings to be found before the
pivot and a fair amount of the double top and double bottom types, I still see
a lot more after the pivot as a percentage of the total opportunities. In
general, then, if I want to use the swing-point techniques I focus on swings
after the pivot, and keep an eye out if something nice shapes up before the
pivot, or ‘around the pivot’, in the case
of the ‘double’ formations. This will allow me to utilize these pre-pivot
swings if they occur, and if they don’t, I simply look for another entry
technique.
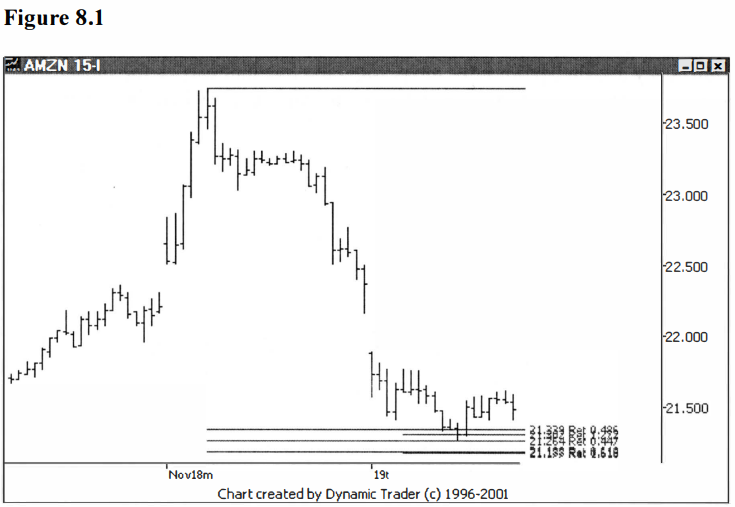
Let’s start out with an example in AMZN. There
is a potential trade area on the 60-minute chart. I’ve dialed down to the
15-minute to look for an entry. AMZN has penetrated the upper end of the
potential trade area and is starting to pull back. See figure 8.1.
At this point I would be willing to take a
trigger because AMZN has penetrated the potential trade area. As this chart
lays out right now, though, I have a few options, or at least potential
options. If AMZN starts to go up right from here, and if I like the swing-high
that has just formed (the pullback so far has penetrated
a 50% retracement), I can use a trade above that high as a trigger. I
could also use the swing-high that formed just before AMZN dropped into the
potential trade area, again if I liked that swing- point. What I want to do is
form possible scenarios, and whether or not I would consider the triggers, so
if they happen, I’ll know how to react. Let’s move ahead on the chart and
reassess. See figure 8.2.
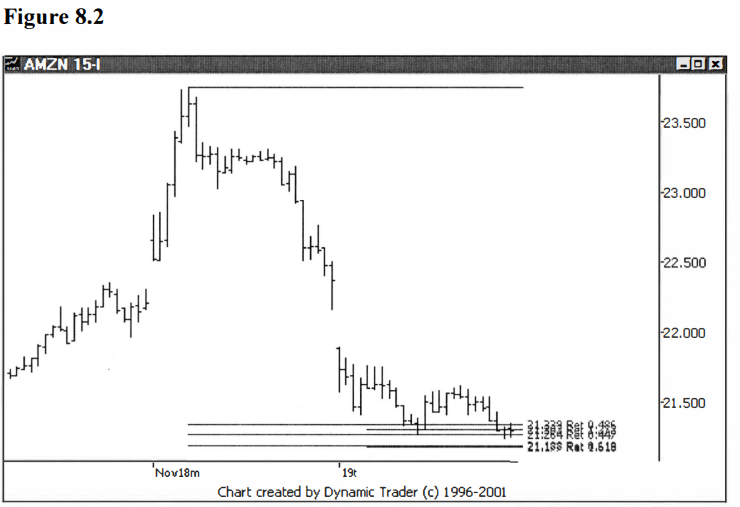
AMZN didn’t go up from that last point; instead,
it went down and set a nominal new low for the move. This sets up a potential
‘double bottom’ and defines a swing-high point that I would consider acceptable
for a trigger. This goes on the assumption that AMZN doesn’t do anything I
don’t like before the trigger is hit, and that AMZN starts toward the trigger
fairly soon.
It’s hard to describe what price action would
invalidate the trade for me; I just know it when I see it. The best thing I can
say is that I’d really prefer for the price to just do what I expect, and that
is to tum somewhere in here and go up in an orderly manner. Anything that
deviates too far from that and I’ll reconsider taking the trigger. I’ll label
the trigger on the chart with a horizontal line. See figure 8.3.
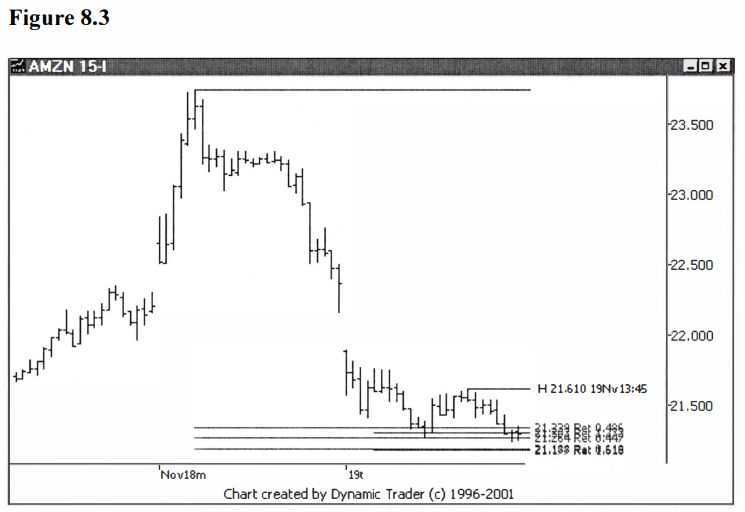
There’s nothing to do now but watch and wait,
and see how AMZN reacts to this area. The trigger is set, and unless some new
price action comes in that invalidates the current trigger, I’m in watch mode.
Let’s move ahead a few bars and see what happens. See figure 8.4.
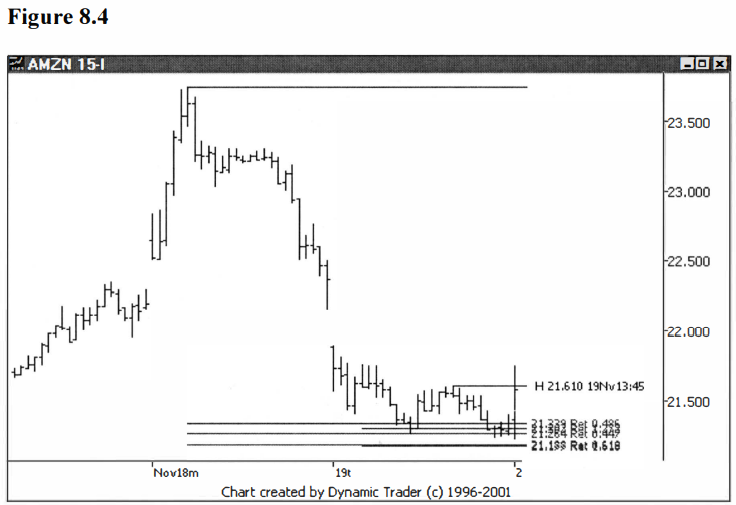
That’s it. As can be seen on the chart, the
trade has triggered, and it has done so on the first bar of a new day’s trading
action. Let’s move ahead a bit and see how AMZN is acting. See figure 8.5.
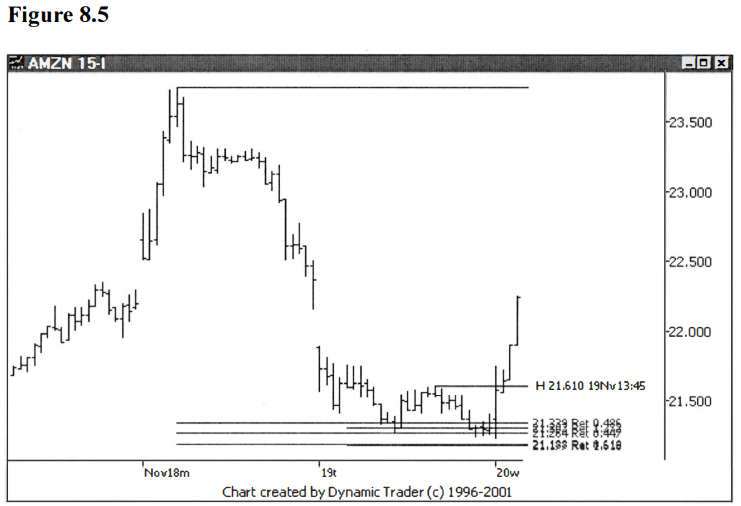
There was a small pause in the area of the
break (which we now know is not uncommon), but then AMZN started up strong.
Unless you thought that tiny rest was enough of a pullback to try and use for
entry (it certainly doesn’t meet the criteria I
have presented thus far), you had no swing-point or pullback opportunity
at all once AMZN started up. Let’s move farther ahead and analyze how AMZN is
behaving. See figure 8.6.
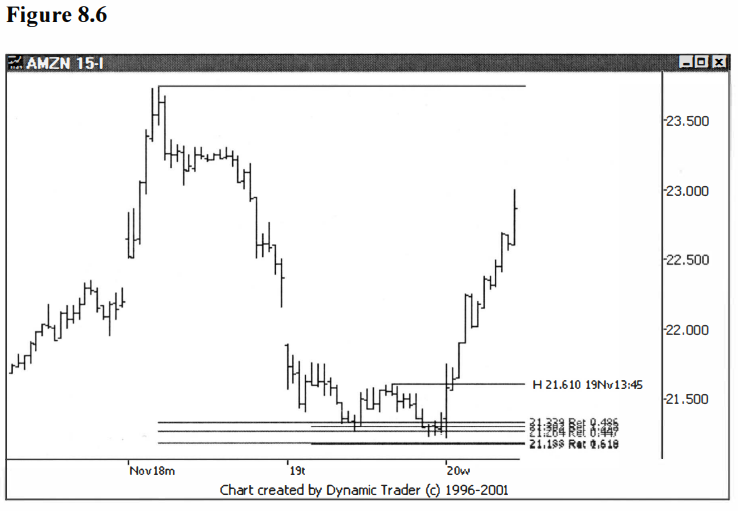
AMZN is just rocketing up. There was one
additional, small pullback on the way up, but it would not be the type I would
use for entering a trade. If the highlighted swing-point was not used for
entry, that was the last chance for this technique, as I’ve outlined it. This
is one of the reasons I utilize this technique when given an opportunity. I’d
hate to be left on the sidelines in a potentially great trade, waiting for a
post-pivot swing-point that never comes. Let’s advance a bit more and make
another assessment. See figure 8.7.
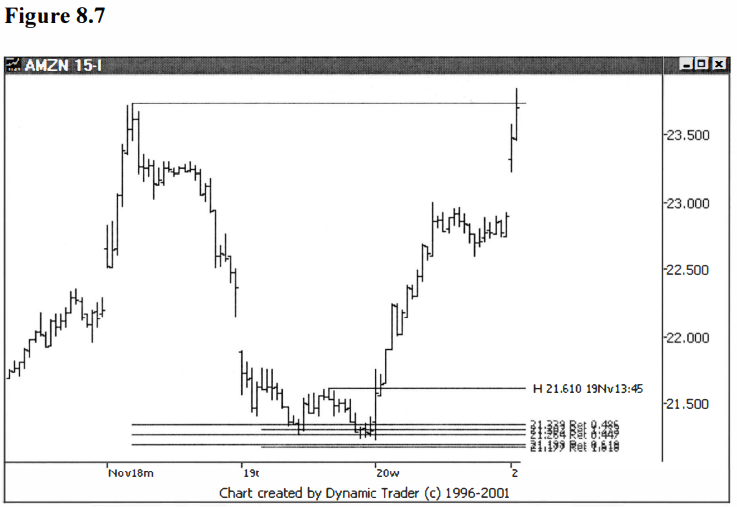
AMZN had a congestion/rest period and then
just started up again, and on a big gap (this might
be considered a ‘continuation’ gap). Although there may be a potential
trade entry in this area, it is so far above the potential trade area that it
would be an entirely different trade at that point. Any trade entry based on
the potential trade area has either long since been executed, or long since
abandoned. My point for showing this additional data is to demonstrate how
sometimes, if an opportunity is presented and passed over, no more
opportunities may be presented.
Now some of you might be thinking that there
was another potential swing- point entry that I haven’t mentioned, and you’d be
correct. What about the swing-high point that stood out fairly well, before
AMZN penetrated the potential trade area? I’ll highlight that potential
swing-high trigger with a horizontal line, and back up the chart on AMZN to the
point where it was just bouncing for the first time off the potential trade
area. See figure 8.8.
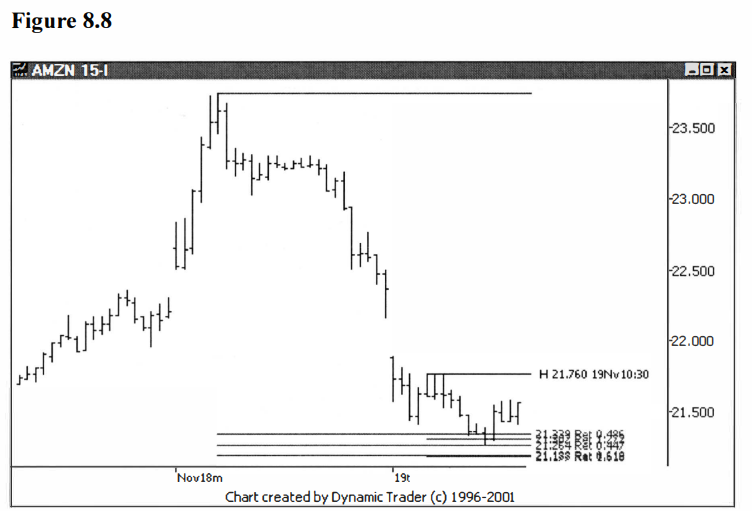
This is a great observation, noting this
swing-high as a potential trigger. The character of the swing, and its
placement with respect to the potential trade area, make it acceptable for me.
At this point on the chart, an assessment has to be made. The question is, if
AMZN goes straight up from here and takes out that trigger, would that meet
your own personal criteria for a trigger? For me, the answer is yes. I
definitely would have this line on my chart, and I would be ready for that
scenario to play out.
I didn’t present this at first because I don’t
want to present multiple possibilities when I first introduce a concept, it may
get too confusing. Once I feel the reader is likely to have the basic idea, I
then feel it makes sense to present multiple choices and opportunities at the
same time. One has to walk before one can run. Let’s see how this potential
trigger would play out. We’ll move ahead on the chart and reassess. See
figure 8.9.
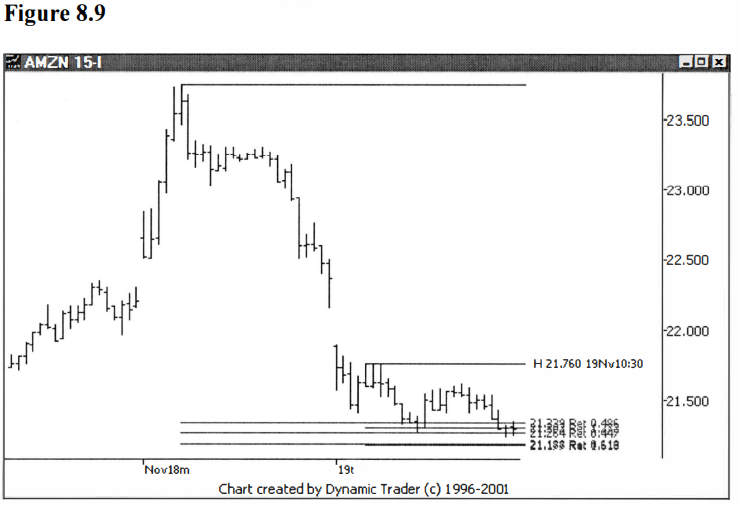
As soon as I see AMZN in this position, I
would immediately abandon the highlighted trigger in favor of the lower
potential trigger. This puts us in the position we were in, in Figure 8.2. This
is the point where I added in the horizontal trigger line on this new
swing-high point. I’ll add it back in, retaining the current horizontal trigger
line for comparative purposes. See figure 8.10.
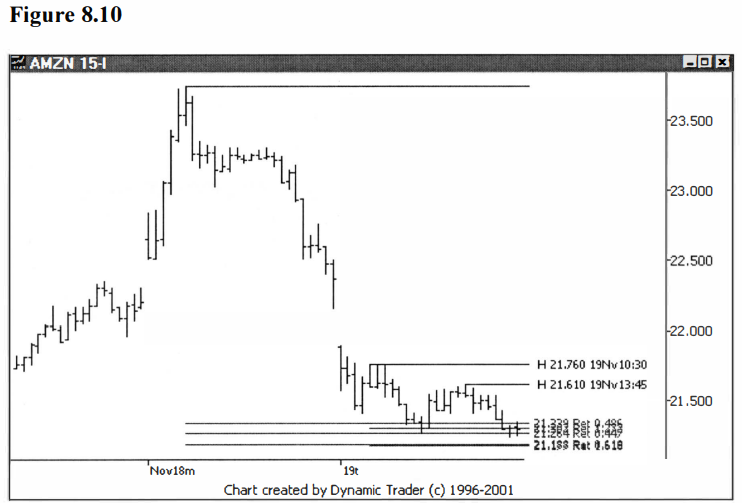
Now, using the same assumptions as before, I
would focus on the lower price trigger, having this newer trigger supersede the
higher price trigger. As a potential trade evolves, I make constant assessments
and changes in my plan. When I see a potentially
better trigger come up, I frequently ‘upgrade’ to that trigger. It’s
an ongoing, evolving process.
Let’s move on to another example. I want to
point out, though, that I chose the last example with AMZN because it had less
than ideal price action. I will choose the next two examples trying hard for
them not to be too ‘well- chosen’. I’ll select them both to be a bit choppy,
with the pullbacks not being the most perfect, textbook pullbacks. The last
example in this chapter, with CAT, will be slightly illiquid in the chosen
timeframe. I’ve done this on purpose, to reflect what a less than ‘perfect’
behaving trade may look like. I’ve attempted to do this throughout my works,
but I’ve particularly focused on this with the examples in this chapter.
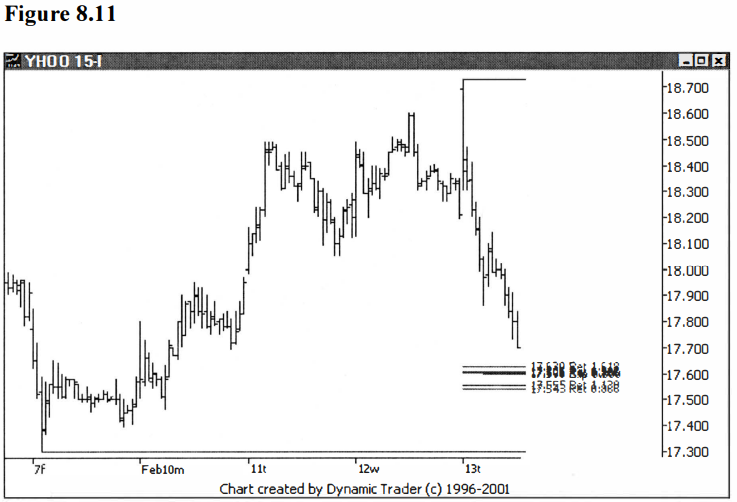
There is a potential trade area on the
60-minute chart on YHOO. I’ve dropped down to the 15-minute chart to look for
an entry trigger. I’ll add a lot of data onto the 15-minute chart to give you
some perspective for the potential trade area as YHOO approaches it, but
generally I’d spread the data out a lot more and only focus on the price action
on the trigger chart as it comes into the area. See figure 8.11.
Let’s move ahead one more bar and see what
happens. See figure 8.12.
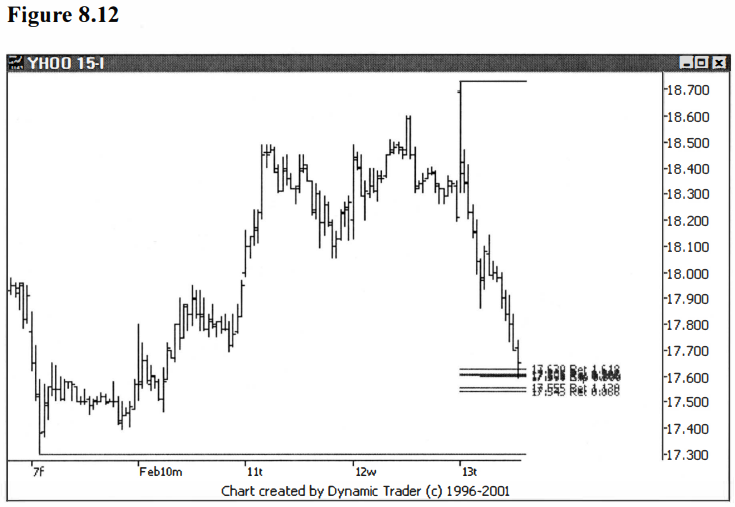
YHOO has penetrated the potential trade area,
and I would now be willing to take an entry trigger. I will watch as the
potential trade unfolds and make assessments as time goes on, trying to decide
on a trigger. Let’s add two more bars and see if I can decide on a trigger. See
figure 8.13.
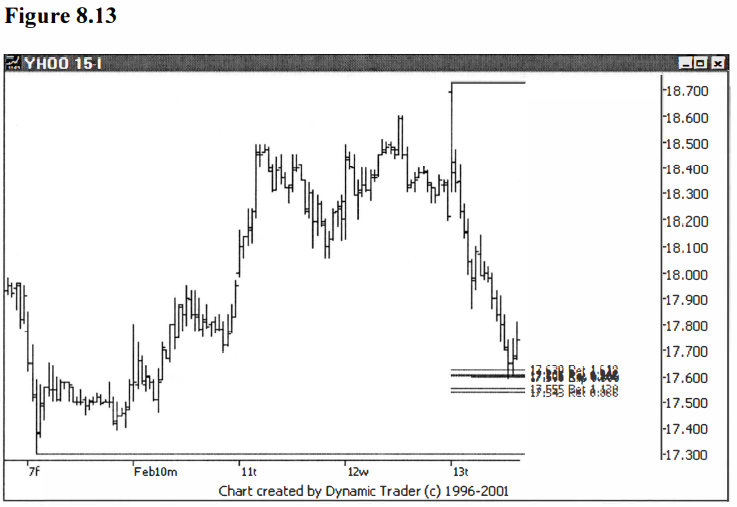
YHOO has bounced off the potential trade area,
and I’m thinking that if it just rockets straight up from here, I’ll miss the
trade. That’s a downside to triggers that key off of swing-points. If you don’t
get any swing points, you don’t get any triggers. If YHOO just went straight up
from here, would other triggers, like moving average crossovers or trendline
violations, work?
Yes, these triggers could be utilized in this
case, since they don’t require any swing-points to be triggered. But perhaps
you’ve decided you want a trigger that is based on a swing-point violation for
this trade. Then all you can do is wait for the trigger to set up, and if it
doesn’t, you have to let the trade go by. I’ll add two more bars and see what
YHOO is showing us. See figure 8.14.
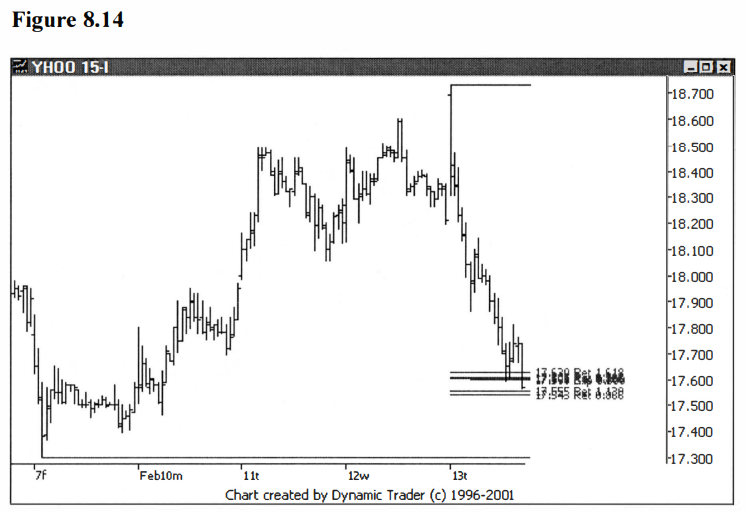
Now that’s a quick change. YHOO decides to set
a nominal new low for the move, and test the lower part of the groupings (my
potential trade area). Not only that, it sets up a possible swing-high point
that I might use for a trigger. I want to see how YHOO behaves as the potential
trade unfolds. If YHOO does what I want, then this swing-high point will make
an excellent trigger for me. And what do I want? It should be clear by now. I
want YHOO to reverse in here and start up, in a nice and orderly manner. This
will be a subjective evaluation, and I do it based on my experience. Let’s go
forward another bar and see what happens. See figure 8.15.
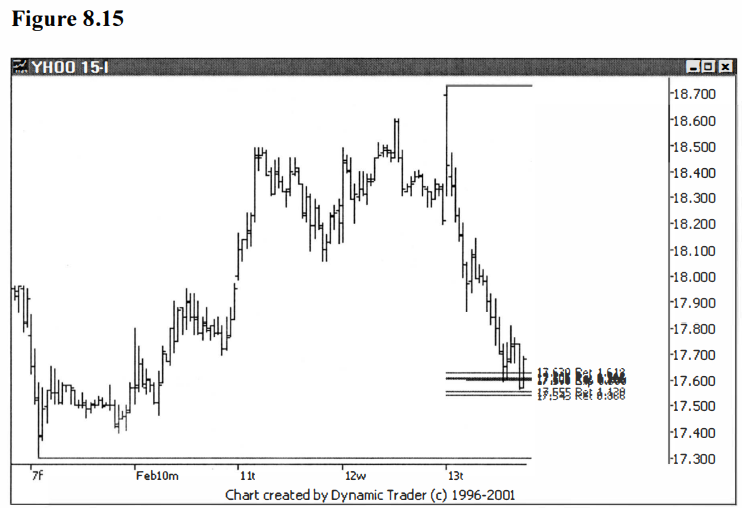
YHOO is reversing off the second move into the
potential trade area, and I like the price action so far. I would now consider
the swing-high point for a trigger, assuming YHOO keeps heading up in an
acceptable manner. I’ll add in my horizontal trigger line at this point. See
figure 8.16.
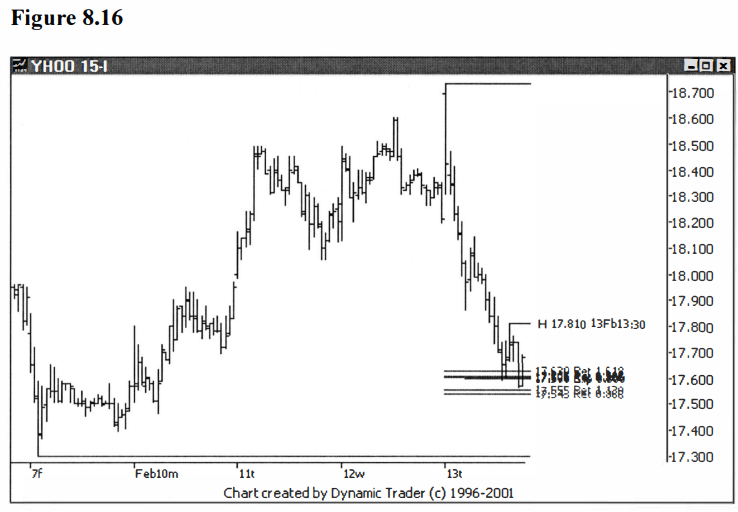
There is nothing to do at this point but watch
as the potential trade unfolds, and assess the situation as necessary. I’ll add
one more bar in and reevaluate. See figure 8.17.
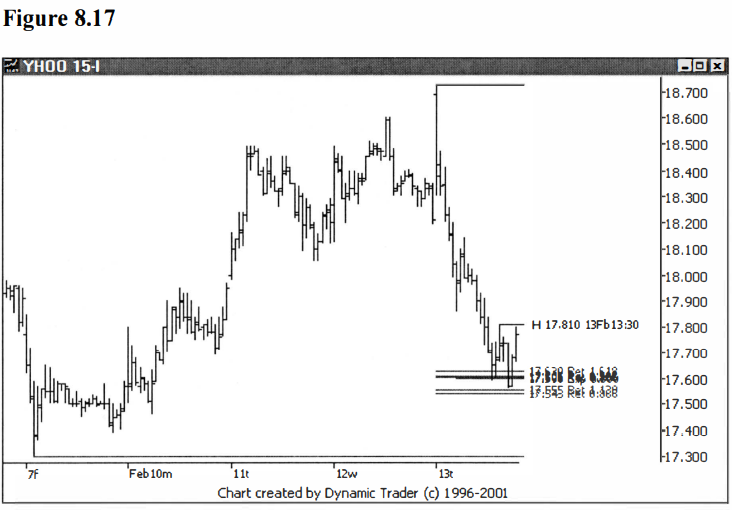
YHOO is acting very well here, heading for the
trigger. I would be very confident at this point that I have done a good job in
choosing my trigger. I would expect that if YHOO is going to respect the
potential trade area, it will overcome this trigger fairly soon. Let’s add
another bar and see if YHOO triggers. See figure 8.18.
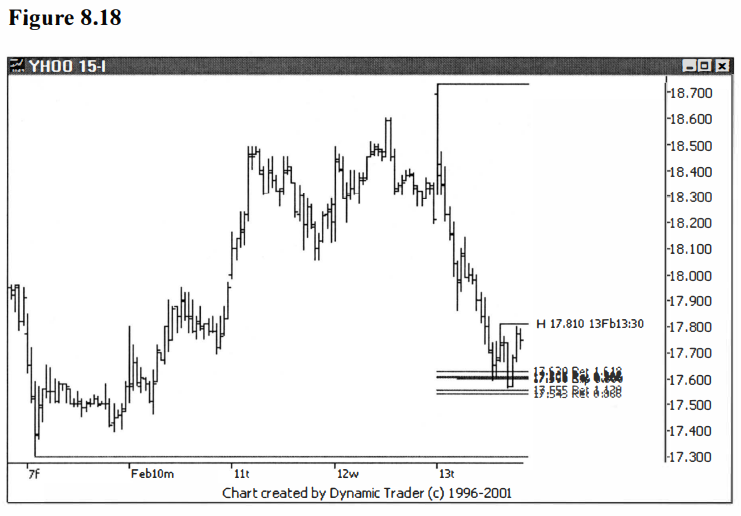
YHOO paints an inside bar, but still hasn’t
triggered. If YHOO trades back down into the potential trade area, I would
likely want to reconsider my trigger. I might be thinking that YHOO is
congesting and trading sideways in the potential trade area, and that is
something I don’t like to see. My experience, in most cases, has been that if I
have chosen my potential trade area well, and the area is going to ‘play out’
and give me a good trade, something should happen pretty quickly, and usually
decisively. I’ll add one more bar and we’ll evaluate the situation. See
figure 8.19.
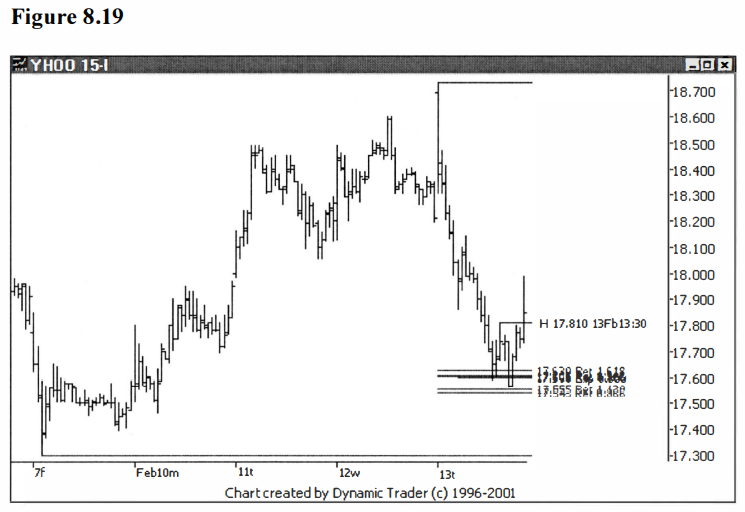
Well, I didn’t have to make any further
assessments or make any other decisions, since YHOO triggered on the next bar.
From what I see on the chart, I think the choice for a trigger was pretty good.
Let’s see how this played out. See figure 8.20.
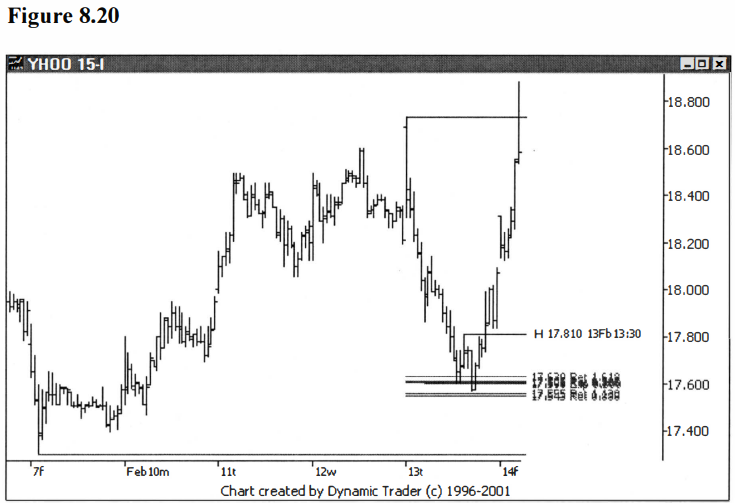
YHOO pretty much just blasted off this area.
There was some ‘congestion’, or a
pause of sorts that is barely visible on this chart, right after the trigger
point. There aren’t any good swing-points for entry from my perspective,
though, once the trigger was hit. Let’s do a close up of the price action after
the trigger. I’ll do a horizontal line trigger on that ‘rest area’ after the
trigger, so we can do an assessment on that spot as a potential trigger. See
figure 8.21.
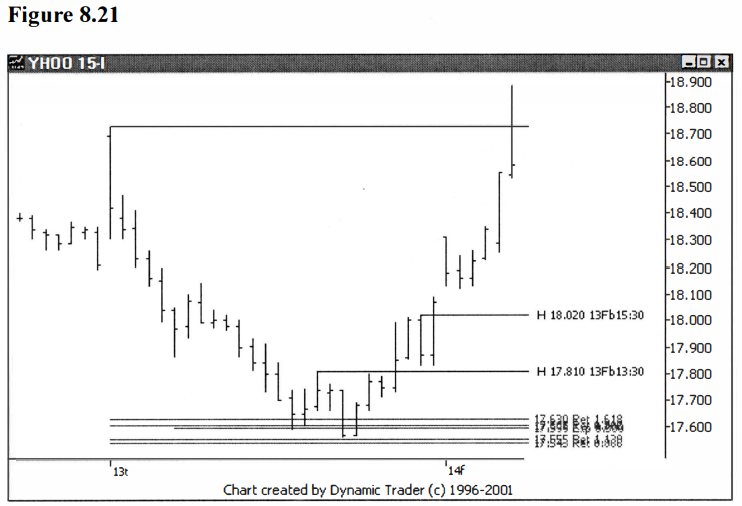
Although the second trigger line up at $18.02
could have been used as a trigger, the swing-point sure didn’t meet my
criteria. If you were to look at the next swing-point up from there, you’d be
way too far up for me to take the trade as it relates to the potential trade
area. This is another example of the highlighted swing-point as the last chance
for using that technique. Again, this is why I watch for these opportunities as
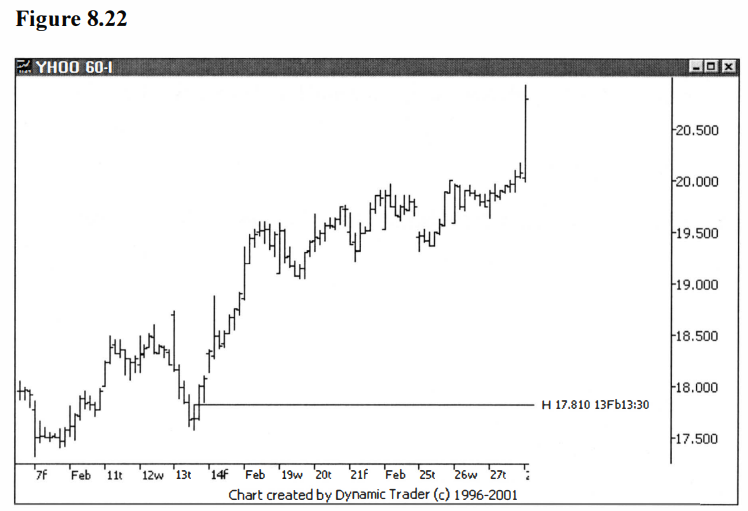
they unfold. I’ll show one more chart of YHOO, this time the traded timeframe,
which was the 60- minute chart, to show the larger perspective. I’ll put the
trigger line on the chart so it is easy to see where the potential trade
started. See figure 8.22.
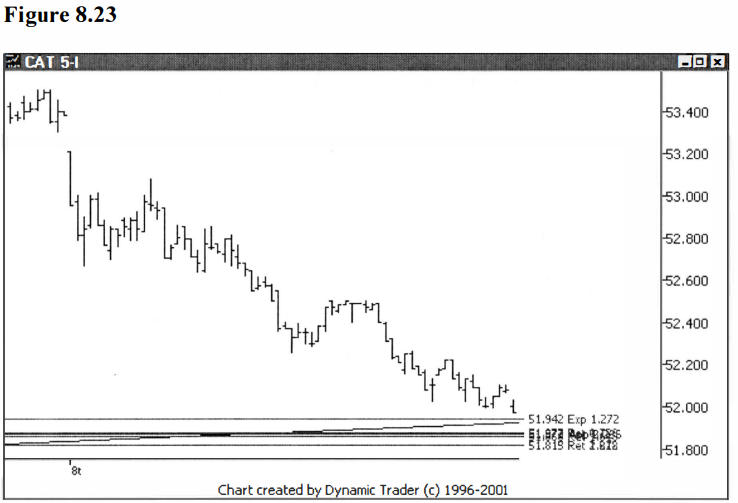
I’ll present one final example with CAT. There
is a potential trade area on the I5-minute chart. This area also corresponds
with a trendline, which is quite prominent on the 60-minute chart. Let’s start
with the 5-minute, trigger timeframe, as CAT heads towards the potential trade
area. See figure 8.23.
Let’s move forward in time and assess the
situation. See figure 8.24.
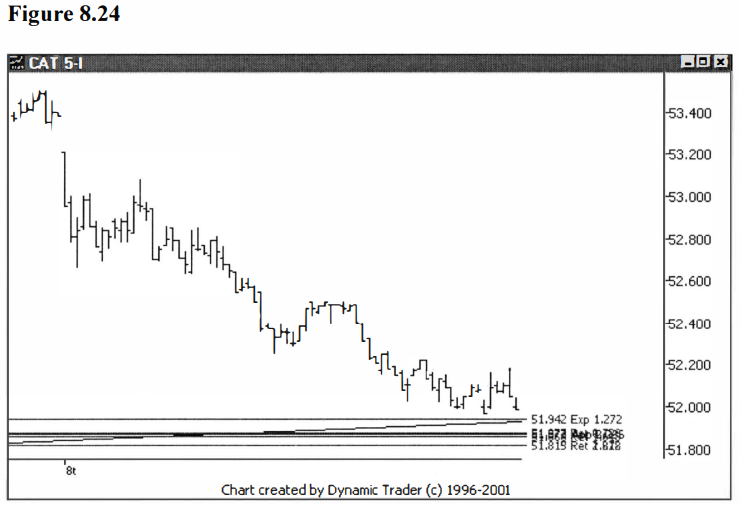
CAT didn’t penetrate the potential trade area
as expected, but instead bounced up a bit. It has then started to roll back
over and head towards the area. In doing so, though, it has created a fairly
nice swing-high. The swing- high doesn’t have that picture perfect look to it,
it has more of a slightly illiquid trading look to it, but it is potentially
more than adequate for trigger purposes. I’ll add one more bar to the chart. See
figure 8.25.
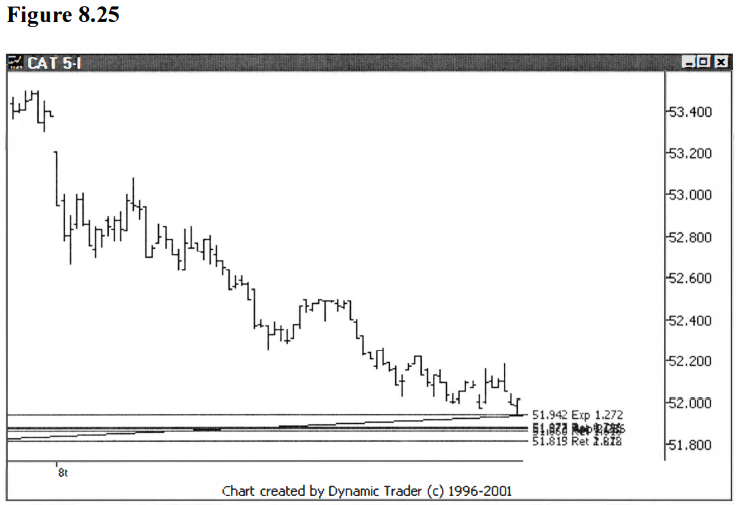
CAT has now bounced off the top of the
potential trade area and the trendline. I would actually prefer that it trades
through the top area just a bit, but I would now accept a trigger. I would
consider the swing-high I mentioned as an acceptable trigger. I’ll label the
swing-high with a horizontal trigger line. See figure 8.26.
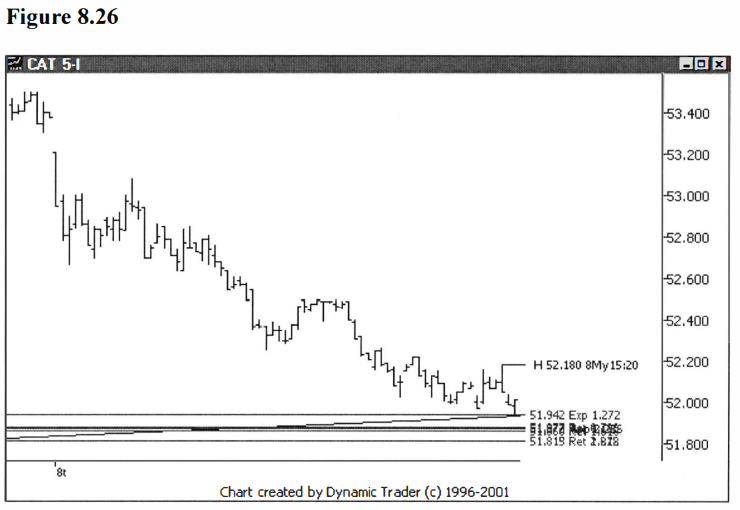
Now I just wait and see how CAT behaves and if
the trade is triggered. I qualify this, as usual, by mentioning that any price
action that I don’t like will have me ‘pulling’ the potential trigger. Let’s move ahead several
bars and reassess. See figure 8.27.
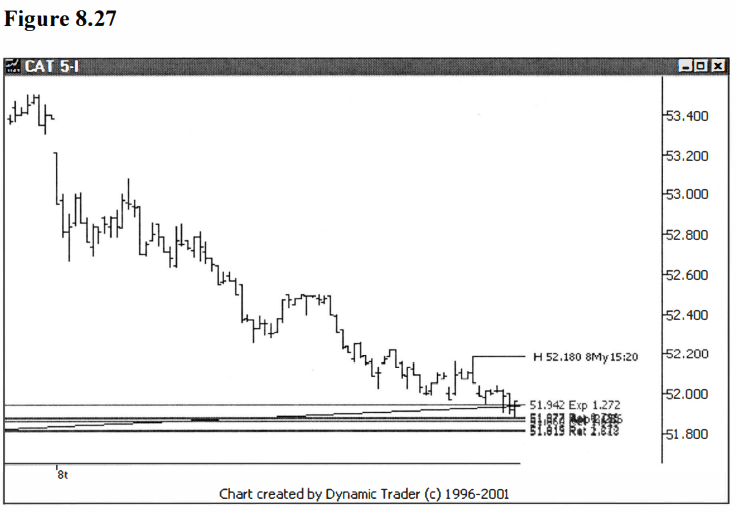
CAT has done what I had hoped it would do, and
that is to penetrate a little bit further into the potential trade area. If it
trades up from here and triggers, I would take the trigger. If CAT continues
down and trades below the potential trade area, I would cancel the trigger and
no longer consider the trade. Also, if CAT, for example, traded sideways in
here for any sustained period of time, I would also cancel the trigger. Let’s
move ahead a few bars and see what happens. See figure 8.28.
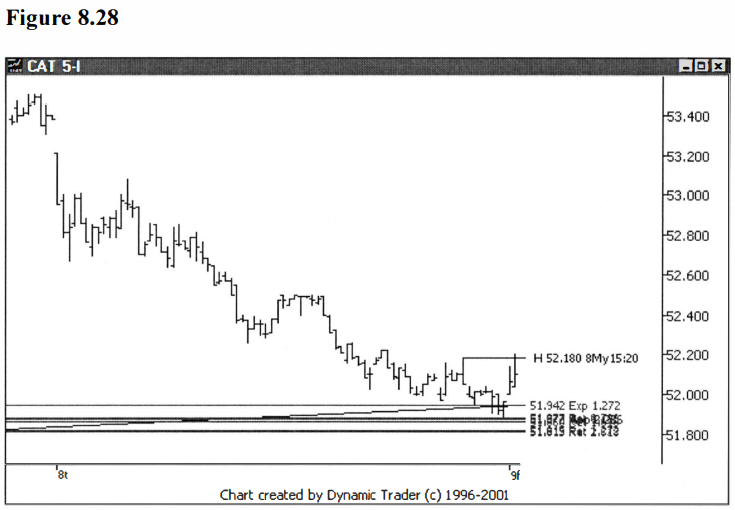
CAT has now triggered on a small gap up
shortly after the open of a new trading day. Let’s add two more bars in and see
how the trade is progressing. See figure 8.29.
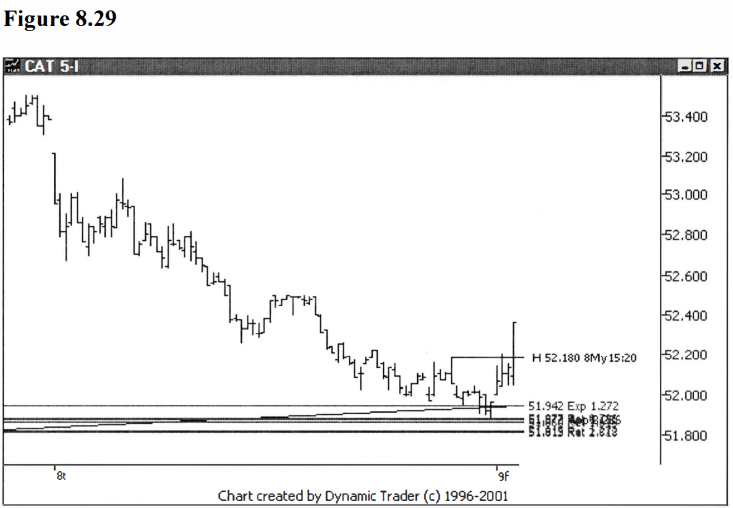
CAT is really going, as it takes out that swing-high
trigger. Let’s add a bit more data and see how this one played out. See
figure 8.30.
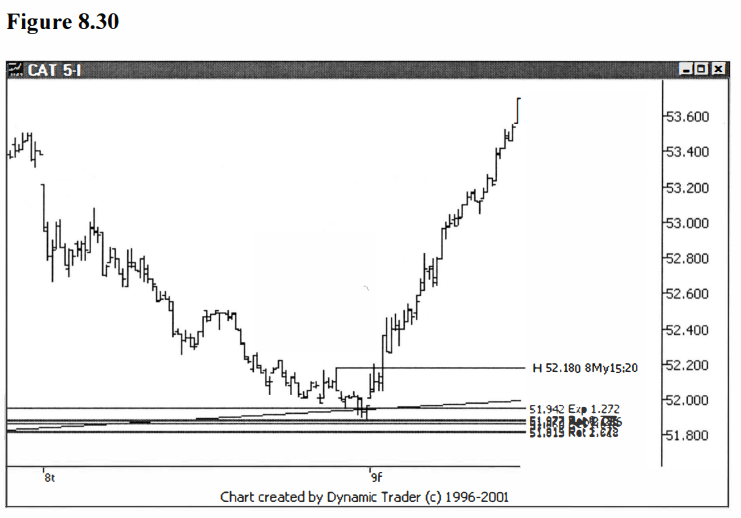
CAT really launched off this potential trade
area, and didn’t give much in the way of swing-points/pullbacks on the way up.
Although the quality of the swing-point used to trigger this trade wasn’t the
greatest, it was as good as I would expect, given the behavior of the issue up
to this point. For my trading, I felt the 15-minute traded timeframe was
adequately liquid for trading, but the trigger timeframe was getting close to
not having good enough behavior to trade.
Given that the 5-minute timeframe is not the
traded timeframe, I might be a bit more lenient in assessing the character of
the price behavior. Still, I need a minimum quality to the swing-points and
pullbacks in order for me to consider their use as potential triggers. What all
that boils down to is that although this swing-point trigger wasn’t the best I
have seen, it did turn out to be the best, and only, swing-point trigger that
met my criteria for this trade.
I’ll finish this example, and chapter, up by
zooming in on the potential trade area and trigger area and looking at two
other potential entry triggers at the same time as this swing-point entry
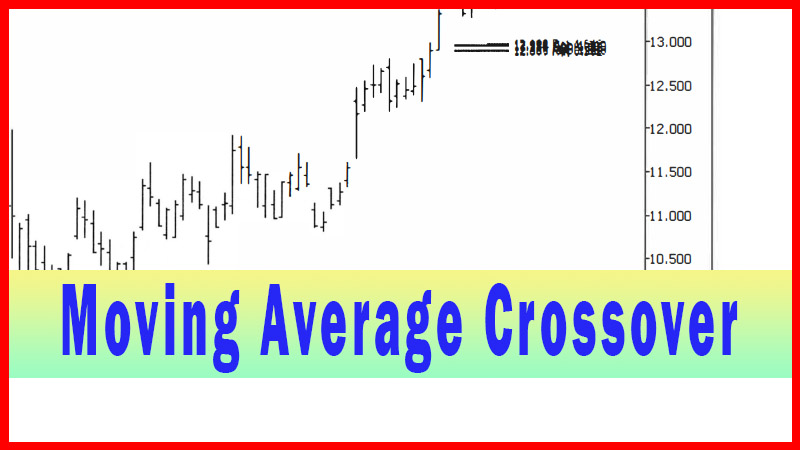
trigger, for comparison. First, I’ll add on the 10-period
exponential and 20-period simple moving averages. I’ll look at the
moving average crossover trigger. See figure 8.31.
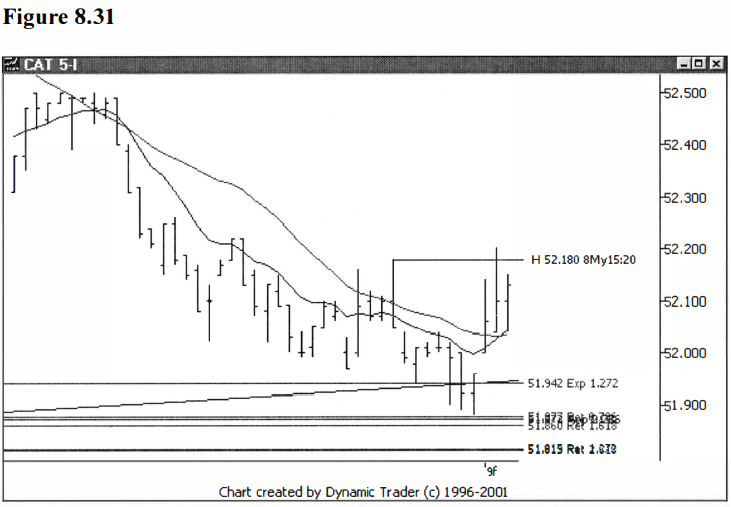
Notice how the trade triggered one bar after
the swing-high trigger, and at a slightly lower price. All in all, though, the
trade triggers at a very similar spot. Let’s throw in a trendline, for use in
the trendline violation technique, and see where that trigger. See figure
8.32.
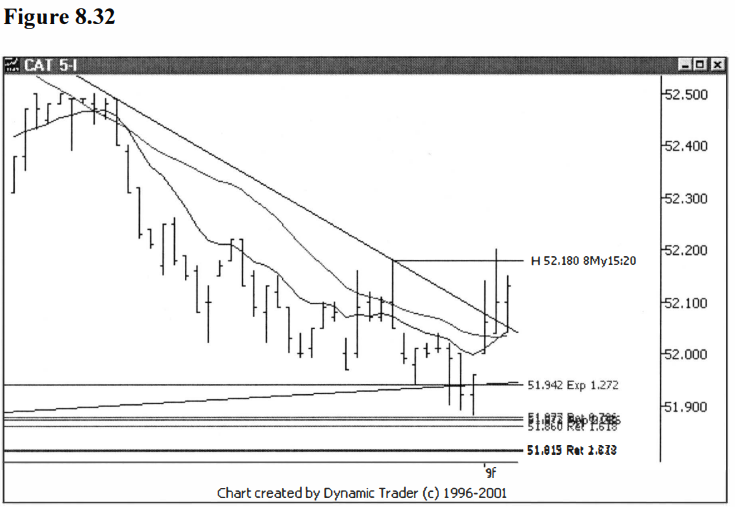
The trendline trigger also produces a very
similar entry. If you waited until the first close above the trendline, your
trigger price would be lower than the swing-point entry, at least in theory.
It’s hard to estimate what an actual fill price might be, and, again,
discussion of the prices in this regard is only for comparative purposes. The
lesson is in how close these trigger prices all are to each other.
I hope it was clear in this chapter just how
similar the application of these techniques is to the presentation made in chapter
6. For all intents and purposes, I trade all three variations of the
swing-points pretty much the same. My main concern is the quality and character
of the swing-point and its pullback, and how it fits in the context of the
current price behavior. I’m not near as concerned with where the swing-point
occurs.
In the next chapter, I’ll introduce one of my
favorite variations on an entry technique that I presented in an earlier
chapter.
Best Trading Entry Techniques : Trade Entry Techniques : Tag: Trade Entry Techniques, Forex : Swing trading, Double top, double bottom, pivot point Trading, Fibonacci Pullback Trading - Swing Point Entries Trading Strategy