Moving Average Crossover Strategy
Moving Average Crossover, trendlines, Regression Channels, Swing low, Swing high, SMA, EMA
Course: [ Best Trading Entry Techniques : Trade Entry Techniques ]
Simple moving average crossover ‘system’, the crossover itself is the sole criterion for taking the trade. But here we are discussing an entry technique that will trigger us into a trade; a trade that we have already decided is in a potential trade area. This trade area is part of our ‘Plan for a Trade’, and is completely independent of the entry trigger, in this case a moving average crossover.
Moving Average Crossover
I like to use the moving average crossover
entry technique quite a bit. But I want to point out right up front that
many writers malign the technique. I’d like to explain why I think that is
before we proceed to the technique itself.
One of the things you most often hear is that moving average
crossover ‘systems’ don’t ‘test out’. What that means is, in back
testing, they don’t make money overall. They may make money in the trending
phases of the market, but I agree that they don’t make money overall.
But I’m not talking about using a moving
average crossover to trigger you into a trade, and then to take you out of the
trade, as these simple moving average crossover ‘systems’ describe. No, far
from it. I’m talking about using a moving average crossover to trigger you into
a trade, as just one small part of a comprehensive ‘Plan for a Trade’.
In a simple moving average crossover ‘system’, the crossover
itself is the sole criterion for taking the trade. But here we are discussing
an entry technique that will trigger us into a trade; a trade that we have
already decided is in a potential trade area. This trade area is part of our ‘Plan for a Trade’,
and is completely independent of the entry trigger, in this case a moving
average crossover.
It’s important to understand that the
crossover is in no way a stand-alone criterion to trade. It’s just a simple
trigger to initiate a trade in an area we have
already decided we want to initiate a trade. That’s one major
difference, and here’s another one. In a moving average crossover ‘system’, you
use the moving averages on the traded
timeframe.
Remember, we first decide on a potential trade
area, and then we drop down to a lower timeframe and look for a trigger. If you
want to use a moving average crossover trigger, you will be doing it on a lower
timeframe than your traded timeframe. This completely breaks this technique
away from any relationship with a moving average crossover ‘system’.
Lastly, since we look at trade management as
an entirely separate critical element of a trade, we are free to choose any
management technique that we want. We can choose to manage this trade without
any moving averages of any kind, if that’s how we want to go. So, you can
clearly see that although you may use a moving average crossover (on a lower
timeframe) as an entry trigger, that use of the phrase is, pretty much, the
only commonality with a moving average crossover ‘system’.
Hopefully, this has lain to rest any negative
thoughts that reference past thinking about such ill-conceived ‘systems’ as the
moving average crossover ‘system’. And hopefully, you can see what I am
presenting for what it is, and no more: just one more technique that you should
experiment with, and possibly consider, to help trigger you into a trade, in the context of your entire ‘Plan for a Trade’.
I explained all this in such detail to clarify
what I am presenting here. I always try my best to explain what it is I am
trying to accomplish in my presentation, and in what context I am suggesting
you experiment with it and see if it may help you. This technique, like
everything I present, is just one small part of a much larger overall plan and
context. It is important that you don’t get confused, in any way, about the
role of this or any technique I present.
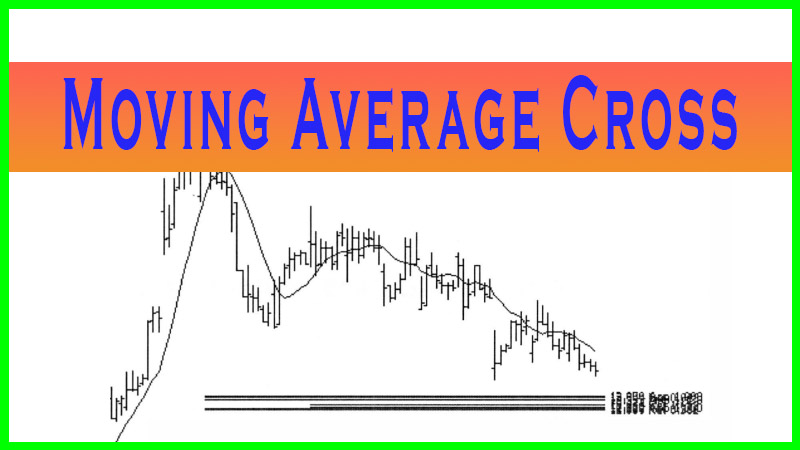
With all that said, let’s look at the
technique. What is a moving average crossover, and how can I use it? A moving
average crossover is simply the plotting of two different moving averages on a
chart, and having the ‘faster’ average cross above or below the ‘slower’ average.
This indicates that the shorter-term trend has now taken precedence, at least
for the time being.
It is for this reason that we may choose to
use this crossover as an indication that the trend has now started in the
direction we are anticipating. Bear in mind, though, this is in no way a
guarantee that this start of the trend will continue at all. You simply have to
let nature take its course, so to speak. You chose an entry based on a
potential trade area, and now you let it play out as dictated by your trade
management plan.
As many who have studied moving average
crossover ‘systems’ have noted, crossovers are prone to massive whipsaws. I
feel this is due, in part, to the fact that the market spends a lot of its time
see-sawing back and forth and all around. As it does this, the moving averages
will cross and re-cross repeatedly, causing these horrendous whipsaws. But the
bottom line is, many of these areas would not be areas where you would even
consider taking a trade. So why would you take the trade there because the
seesaw action caused the moving average to crossover?
The stock answer is that you must take all the
signals you get, or something to that effect. What I’m pointing out is: there
was no reason to believe you had any edge for a trade at that point. Hence, any
entry signal would be wisely ignored. Now let’s jump ahead to what we are
looking at.
We have an area where we have decided that we
want to trade. Any hint that the trade is setting up and triggering would be
all we want. We see a crossover, so we initiate the trade. This is not an area
we expect seesaw action. We expect something to happen here.
There is no guarantee anything will happen in
this potential trade area. There is also no guarantee that the market won’t
begin to seesaw the exact second that we initiate the trade. What we do know is
that our work and research and due diligence have led us to believe we have an
edge in this potential trade area, and that we want to attempt to capitalize on
that edge.
That is where the difference lies. We use the
crossover when we have decided this is an area, we can expect something to
happen. When you see people use moving average crossovers to whipsaw themselves
into oblivion, you will usually find these are areas where, if you just looked
at the chart action without the moving averages on it, you would expect the
market to seesaw. It is rarely a surprise.
Let’s move on to some examples. I am going to
apply two favorite moving average crossovers to the two examples from the last
chapter. These two ‘settings’, if you can call them that, are by no means
anything special. I like to use these two the best, but that is because they
fit my style and the markets, I trade the best. As I outlined in the last
chapter, you should experiment with the concept and find what works best for
you, if anything.
My most favored setting is using a 5-period
and a 15-period simple moving average. My next favorite is a 10-period
exponential and a 20-period simple moving average. The latter setting
allows me to use Bollinger Bands around the longer period moving average, the 20-period, as
that is the default setting for the bands, and my most commonly used setting
for them.
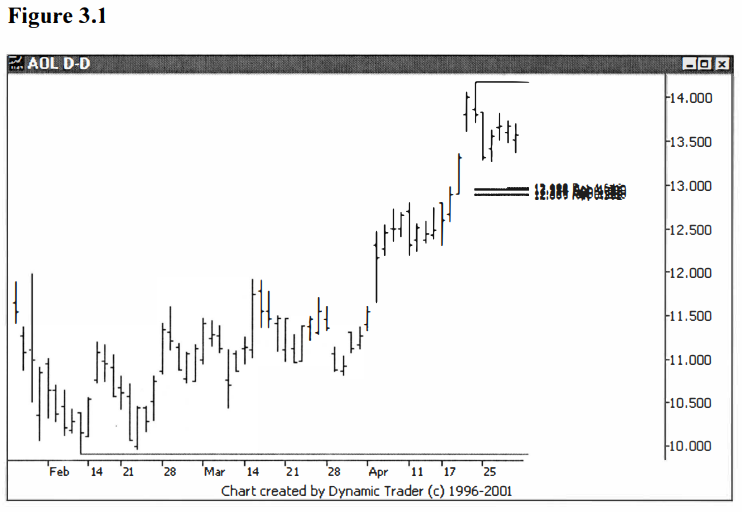
In the last chapter, our first example was AOL
on a daily chart. Let’s look, again, at the trade as it enters the potential
trade area. See figure 3.1.
Now let’s look, again, as it enters the potential
trade zone on the 60-minute chart. I’ll add on the 5-period and 15-period simple
moving averages, just as I added the 10-period simple moving
average in the last chapter. See figure 3.2.
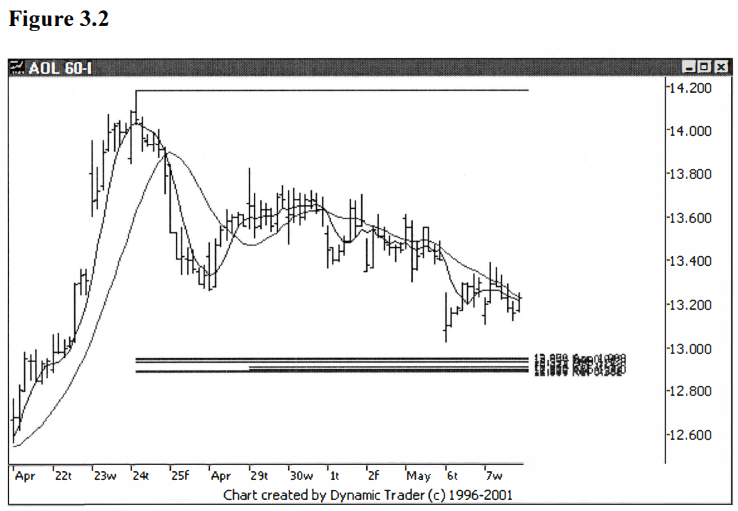
Notice how the 5-period simple moving average
never crossed the 15-period simple moving average during all that ‘chop’ that
occurred around May 1-3, despite multiple bar closings above the 15-period
simple moving average. You can see how this technique, in general, will be less
sensitive, and hence less prone to false signals. The trade-off? (You know
there will always be one!) Most of the time you will get in later and be
farther from your stop. You pay a price for more confirmation. Let’s move ahead
in time. See figure 3.3.

As noted, before, AOL is trending smoothly
into the potential trade area, and now with the two moving averages as a guide,
the behavior again looks very good. Let’s move forward, just a bit more. See
figure 3.4.
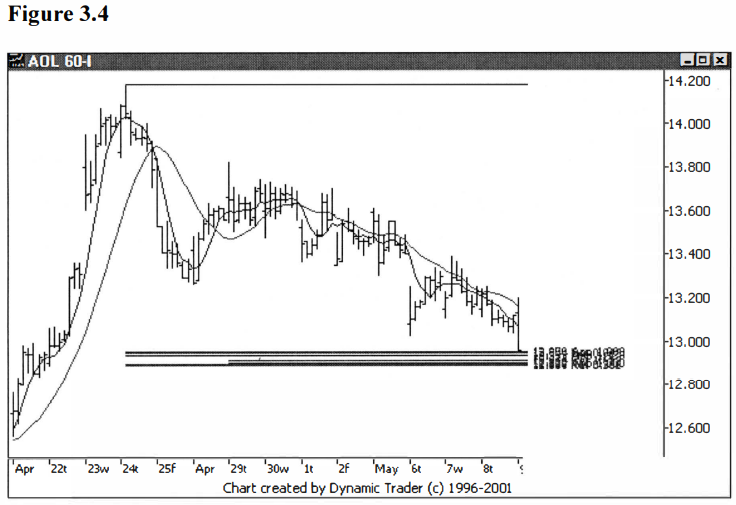
AOL is trending down nicely into the potential
trade area, with the moving averages trending down nicely just above the price
action. So far, the trade is behaving excellently with respect to the moving
averages. Let’s go forward a few more bars, again. See figure 3.5.

AOL comes off the area and starts to move
sideways. It is now moving above and below the very fast 5-period moving
average, which is now turning up slightly. Let’s add one more bar to the chart.
Figure 3.6.
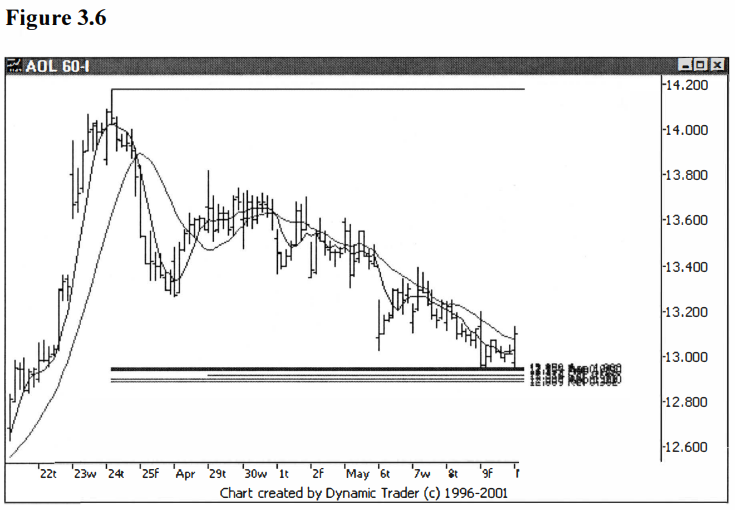
We now have a bar close above both moving
averages, but nothing close to a cross of the 5-period average above the
15-period average. So, although AOL is moving up here, we don’t have a trigger.
Let’s look at the same chart from the last chapter, with the 10-period simple
moving average on the chart. Recall that the trigger was the first close above
the average. See figure 3.7.
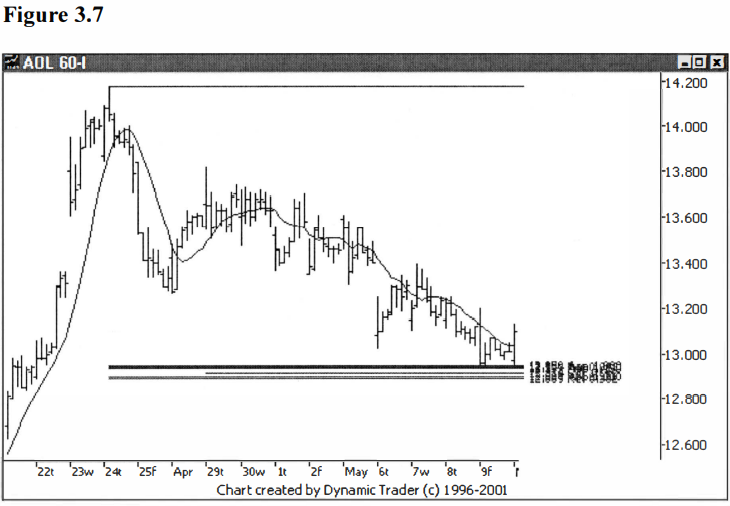
Using the 10-period simple moving average
cross trigger, the trade was triggered at this point. But using the 5/15-period
simple moving average crossover trigger, the trade is still in the wait and see
mode. It generally takes more to get a trade to trigger with the crossover
technique. Let’s add one more bar and see what unfolds. See figure 3.8.

We now have two bar closes above both
averages, but still no crossover. As I’m wont to say: “No trigger, no
trade”. You can see that a crossover is very near at hand, and I
would suspect that any more upward movement will bring the crossover, but I
don’t recommend jumping the gun on triggers. Let’s add one more bar and see
what the moving averages do. See figure 3.9.

Well, finally, that’s it. The trade is now
triggered; we have a moving average crossover. The closing price on this last
bar is $13.17. Compare this with the previous example using the 10-period
simple moving average cross entry, which had the trigger bar’s close at $13.10.
You paid more, but not very much, for the added confirmation.
Now, the questions that undoubtedly come to
mind are: ‘So, what is the actual trigger, when the moving averages just
crossover the first time, or when they crossover and the bar closes? And how
about the price action? Does it matter if the price is above the averages, or
not?’ These are great questions.
Hopefully, you have an idea what I’m going to
say here. What I’m going to say is that you must experiment and decide what
works best for you. I can (and will) tell you what I like best, but that is for
my trading. I can’t say it’s going to be the best for you. I, personally,
usually like to wait for the first bar close after the crossover, and I like
the price above the averages for long trades (below for shorts, of course).
But this is not a hard and fast rule. One
thing I frequently see is that many trades will do a small pullback just after
the crossover occurs. This will frequently bring the price action back down
below the averages. It can even re-cross the averages back down; only to have
them cross back up and off the trade goes.
If you choose a stop, for example, just below
the groupings you used to determine the potential trade area, this small
pullback will not come anywhere near your stop. Hence, the crossover gets you
in, and then you forget all about the moving averages. You don’t use them in
any way for your stop action.
What’s the point to all this? I have a few
techniques where I initiate the trade on this small pullback, which will most
frequently have the averages crossed up as discussed, but the price dropping
back below them. I will discuss this variation further in a later chapter.
Suffice it to say, though, just as with the variations we discussed in the last
chapter, you have to tinker around with them and decide what, if anything,
works for your trading.
I won’t repeat chart examples showing how the
AOL trade played out, since we have already covered that in detail in the last
chapter. The reader is referred to the previous charts in chapter two for
review, if needed. Instead, let’s look at this example again, this time using
the 10-period exponential and 20-period simple moving average crossover
trigger.
Let’s just jump right in and show the same
potential trade, right before the moving averages might be getting ready to
crossover. This is right at the same point where the 5/15-period set were just
getting ready to crossover. See figure 3.10.

So here, too, the averages are looking like
they are about to crossover, but haven’t yet. Recall that with the 5/15 moving
average combination shown in figure 3.9, they crossed on the next bar. Remember
that the 10/20 moving average combination should provide even more confirmation
(at a price, as always), and hence generally will be even later. Let’s see what
happens. See figure 3.11.
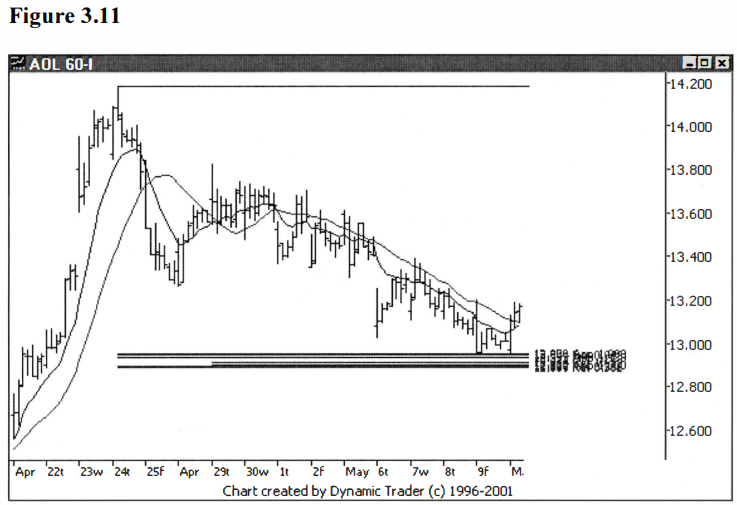
Interesting, the averages haven’t crossed,
like they did with the 5/15 combination. This is what one would suspect, but it is
still interesting to see it play out. If AOL keeps going up a crossover would
be expected on the next bar. Let’s move ahead one more bar and see if we get
the crossover. See figure 3.12.
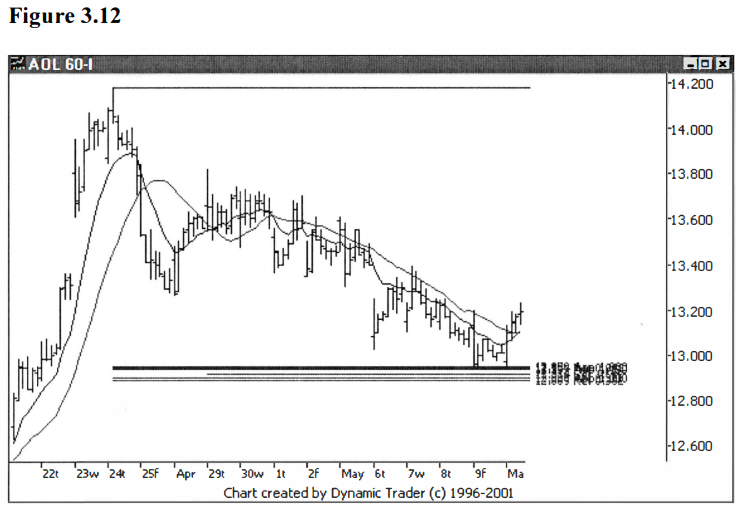
Okay, there it is. It’s just barely a
crossover, but it is enough. The closing bar price is $13.19. Recall that the
closing price for the 5/15 combination was $13.17, and for the 10-period by
itself it was $13.10.
So, more confirmation was obtained by going to
a crossover technique and going to longer period averages, but at the cost of a
higher entry price. Also note, as I’m sure you have, at just how little the
actual price difference is. This will not always be the case, but it should be
clear that the variance in these techniques is a lot less than one might expect
at first glance.
I would also like to take a second here to
point out an observation on the actual crossover itself. As you watch a
crossover develop in real time, you will frequently see the crossover form and
then ‘uncross’ as the price changes. I generally use closing bar prices to
generate indicators, and most charting software will form the closing price
hash mark on the last bar from the last trade. But until this bar has completed
and the next bar has started, this value will change as the last traded price
changes.
Since this ‘closing’ price is used, in this
case, to calculate the moving averages, the last value of these averages will
change repeatedly, until the final value is in. For this reason, I don’t
consider a crossover a crossover that I would trade until the bar that creates
the crossover has completed. Otherwise, it may be a ‘head fake’, and
the crossover will be just a ‘phantom crossover’.
That’s not to say that you would not want to
explore such pre-mature signals. I just want to point out what can happen, and
leave it up to you to decide how you want to design your entry signal. Just
like there were many options to how one might handle the moving average cross
entry technique, there are many potentially useful ways to use the moving average
crossover technique, too.
At this point, let’s take a brief look at how
these two crossover entries compare to the two moving average cross entries
presented in the last chapter, using our second example with CSCO. First, for
review, let’s look again at the 60-minute trigger chart of CSCO, using the 20-period simple
moving average cross entry. This is the same chart shown as figure 2.14.
See figure 3.13.

As discussed in the last chapter, the trade
would now be triggered at this point, using the 20-period simple moving average
cross entry. For the sake of the example, and so we can do some comparisons,
the closing price on the trigger bar is $15.46. This is, of course, not to
suggest that anyone could or would have gotten that exact price in a trade, but
it helps us compare techniques to each other.
Let’s now look at the three other techniques
that we want to compare to this example. First, let’s look at the same
technique, the simple moving average cross, but with a shorter period average,
the 10-period. This is the trigger we used in the first AOL example in the last
chapter. See figure 3.14.
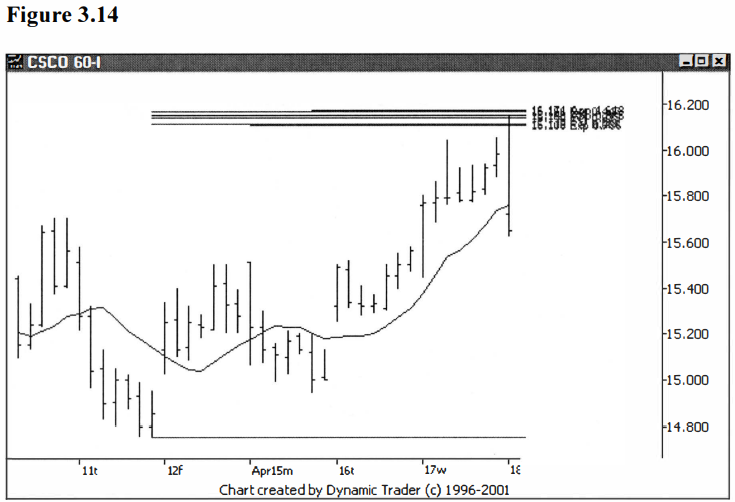
Notice how the shorter 10-period simple
moving average triggered the trade two bars earlier than the 20-period,
as shown in figure 3.13. The closing price of the trigger bar in this case, is
$15.65. You would have gotten a fairly higher price using the ‘quicker’ trigger, as
you might expect. Let’s now see how these two compares to the two crossover
triggers. First, let’s look at the ‘quicker’ 5/15 crossover. See figure 3.15.
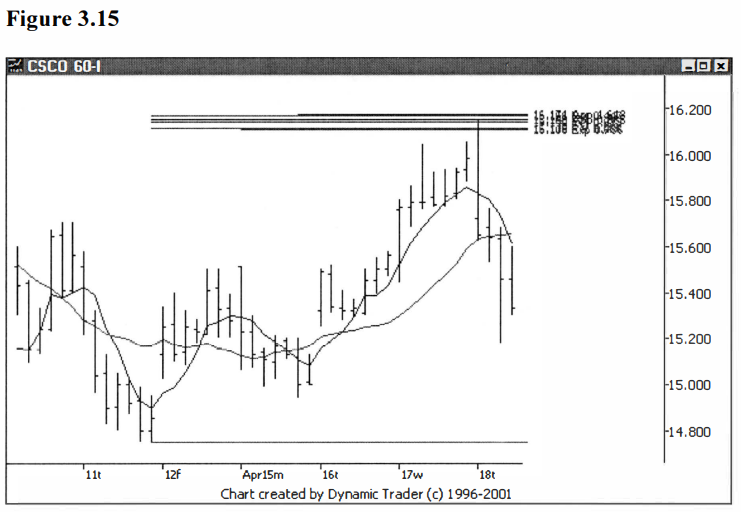
This entry triggered exactly as expected,
after the two cross triggers. It triggered one bar after the ‘slower’ 20-period cross
trigger. The closing bar price was $15.33, lower than either of the
cross triggers. Let’s now look at the 10-period exponential, 20-period simple
moving average crossover entry. See figure 3.16.

This trigger was even later, as one would
expect, with a closing bar price of $15.38. But a very interesting thing
happened. That price is actually five cents higher than the last trigger using
the ‘quicker’ crossover with the 5/15 combination. Now why would that be?
One thing I notice quite often is that if you
are looking for confirmation before you initiate your trade i.e., you aren’t ‘fading’ the entry
right at the trade area, you are usually quite a bit away from the trade area.
The general area you see as ‘enough confirmation’ is also perceived
by a lot of other traders and money managers. This is also an area where profit
taking may set in for those that did fade the entry for a quick trade.
Hence, this confirmation area is frequently an
area where a pullback may occur. Sometimes the price may pull back and jump
above the moving averages (on a short trade; reverse, of course, for longs). This
would be a better entry, but then you would be taking a trade when the price is
on the ‘wrong’ side of the moving average, and moving against you at that
particular moment.
Personally, I don’t like to take trades like
that unless I am particularly looking to enter the trade on a pullback after a
crossover. And if I am looking for that type of a pullback, I will usually have
some additional criteria that I am looking for, before I would enter. The point
I am trying to make is that many times you will see some type of a move against
you after these triggers i.e., you’ll have to ‘take some heat’.
If the trade is going to be one of the trades
in the ‘winners group’, this heat will rarely threaten your
stop. If you wait for the heat and try to enter at that point, you may get a
better price, but you will miss a lot of trades. This would be more like the ‘first pullback
after a crossover’ technique. It is a very valid technique, but is in the
group of high confirmation techniques. It can be a very useful and very good
technique, but its occurrence will be very infrequent, as compared to the
techniques just presented.
Remember that I prefer to use the ‘least restrictive’ technique
that I can. The pullback after a crossover is only going to suit my needs if I
want a great deal of confirmation. I mention all this because I want to make it
clear that you won’t always get a better price just because you used a lesser
confirmation technique. Usually this will be the case, but since a pullback may
come at any time, in individual cases anything can happen.
Take a look at some heat that would have to be
taken on this CSCO trade. With the last trigger, the trade would have been
initiated after three inside bars. Another inside bar printed after these
three, and this amount of sideways uncertainty is sure to resolve itself soon.
Many times, the first move will be a head fake, and the ‘real’ move will be
just the opposite. Look, first, at the initial move. See figure 3.17.

CSCO gapped up huge, and above both the moving
averages, trading one cent above the high of the expansion bar down that was
used to create the four inside bars. But it couldn’t hold this high and sold
off rapidly, creating a large expansion bar down that closed near its low.
Even if this initial heat would have been very
scary to watch, it’s likely you had your stop somewhere above the grouping in
this case. Remember, the trade timeframe is the daily. If you look on the entry
timeframe and try to micromanage the trade, not only can it scare you out of
trades that you shouldn’t get out of, it takes your perspective away and
creates impressions that are out of context for the trade.
Hence, this gap opening is likely just the
type of pullback I was talking about, and as you remember from the previous
chapter, CSCO did drop considerably. Let’s look, one more time, at what CSCO
did after it gave the trader a little heat. See figure 3.18.

That gap up was it, and it went basically
straight down from there, trading as low as $12.28 before reversing back up.
Try not to lose perspective on the trade when
you drop down to a lower timeframe for your entry. Don’t expect every entry to
be the best possible point of entry, or to not take any heat. Have your stops
pre-decided and let the trade play out.
I have never had much luck trying to
second-guess trades after I have opened them, especially by micromanaging on
the lower timeframe. Just be aware that pullbacks are common after most of
these types of entries. Be prepared with your trade plan, and this type of heat
will just become part of the routine.
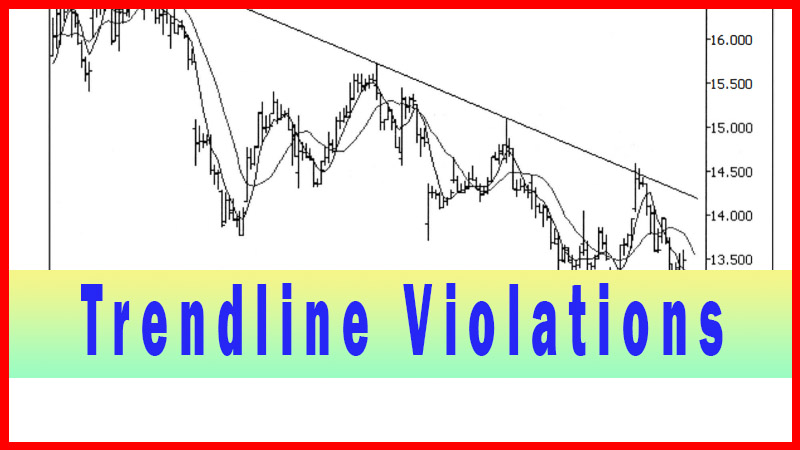
Let’s move on to the next entry technique, one
that, in many ways, is similar to the moving average cross technique, and that
is trendline violations.
Best Trading Entry Techniques : Trade Entry Techniques : Tag: Trade Entry Techniques, Forex : Moving Average Crossover, trendlines, Regression Channels, Swing low, Swing high, SMA, EMA - Moving Average Crossover Strategy