Pullbacks Trading Techniques
Pullback Trading Strategy, Impulse Pullback, Fibonacci Retracement, Best Trading Strategy
Course: [ Best Trading Entry Techniques : Trade Entry Techniques ]
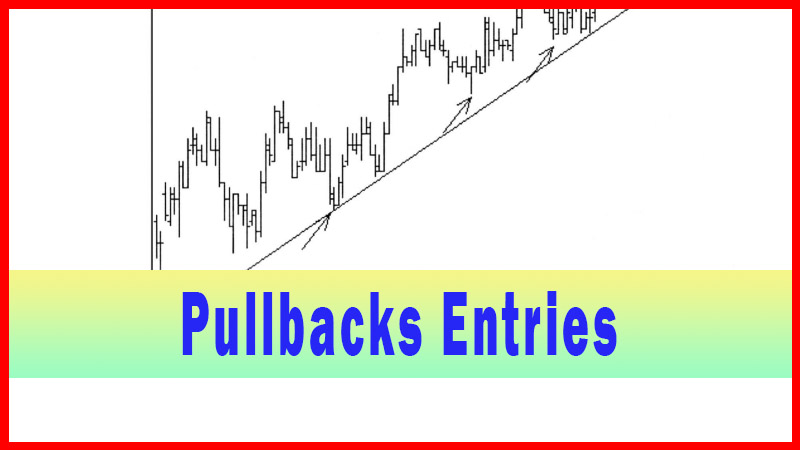
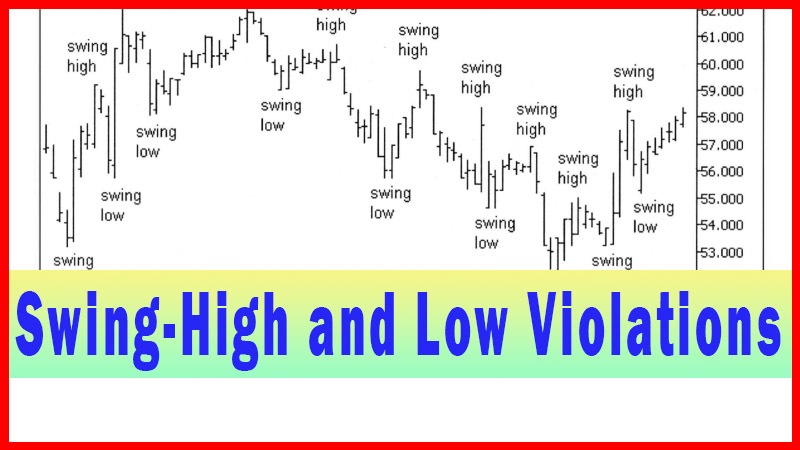
The entry technique I will present using pullbacks is based on the groundwork laid in the last chapter on swing-high and low violations. Although there is a near infinite number of ways that pullbacks can be used for trading, I will confine this chapter to one basic variation.
Pullbacks Trading
The entry technique I will
present using pullbacks is based on the groundwork laid in the last chapter on
swing-high and low violations. Although there is a near infinite number of ways that pullbacks can
be used for trading, I will confine this chapter to one basic variation. That
is not to say I don’t use other pullback techniques, or that I don’t consider
other techniques to be worthwhile.
In fact, quite the contrary is true. It’s just
that volumes could be written on pullbacks, and it would be outside the scope
of this book to do more with the concept than I plan to. I have chosen one of
my most commonly used pullback entry techniques for presentation. The technique
I have chosen dovetails the best with the material presented thus far, and it
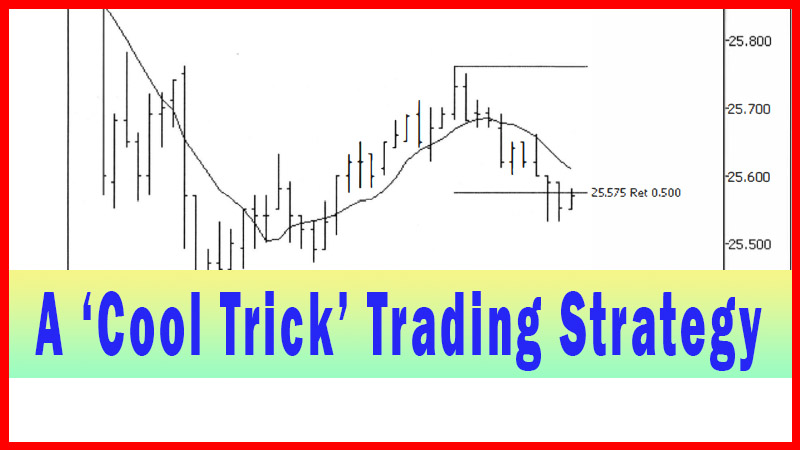
is also incorporated into the ‘cool trick’ I will present in chapter 9.
As I implied at the end of chapter 6, the
pullback technique I will present is just a way to anticipate, perhaps ‘jump the gun’, on the swing-high or low
violation technique. I am simply going to take a guess, albeit an educated
guess, as to when I think the pullback may end, and take the trade at that
point. This will have the effect of getting me in earlier than the swing-high
or low violation technique, but perhaps, too, getting me into a trade that may
not play out as anticipated.
I generally use this technique when I have the
setup for the swing-high or low violation in motion, and I get the feeling that
the trade is really looking good to play out as I expect. This can be a subtle
thing, such as how the buyers or sellers are acting, what the volume on each
bar is looking like, how other indices and issues are behaving, how this issue
looks on an even lower timeframe and a host of other things I watch. I can’t
lay this out for you exactly; it’s a subtle, experience-based thing. But when I
feel that the issue is about to explode and I’m running out of time, I frequently
switch to this technique on the fly.
The setup, as I’m describing here, is the same
as the setup from the last chapter. The key is to recognize a pullback that has
the characteristics that you find acceptable. For me, as I mentioned, I want the pullback to start fairly soon, pullback at
least 50% and have nice time symmetry.
The only real characteristic that I just
described, as far as I’m concerned, that may be hard to decide on is how far
the first thrusting move should be before the pullback starts. I can see on the
chart, by eye, where the area is that I want the first move to go to. The
question is, what characterizes that area, so that you can see it similar to
the way I do? I’m not sure I can really qualify it for you, but I can give some
hints to help guide you.
Ultimately, though, even if the hints are
followed, it may still lead to some areas that I would look at and see right
away that they are not what I would utilize. This is just recognition, gained
from experience, and I can’t give that to you. Let’s go back and look at a few
charts from the last chapter and critique them, looking for clues to my
thinking process. We’ll start out with the mini 3-minute chart example from
figure 6.5. See figure 7.1.
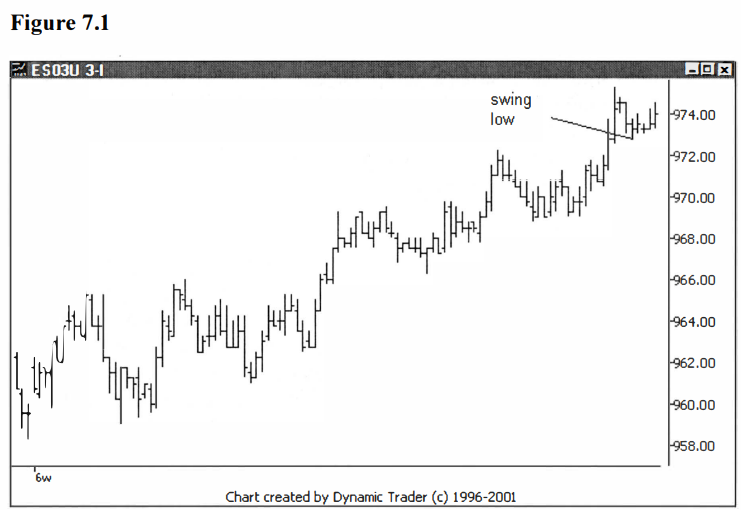
The first thing I would note here is that the
first thrust is a bit on the small side. I would have preferred the first
thrust to go a little further. Why do I think this? I’m looking for the first
move to go more than what could amount to a small and simple pullback in the
current trend. Pullbacks that are 3-5 bars are commonly jumped on, in this case
from the buy side. A pullback that goes 5 bars or more starts leaning, in my
opinion, towards being a greater correction, and starts to tip the scales more in
favor of the potential turning point. I’m also looking for the first move to be
proportional in size to other moves the issue has been making up to this point.
Generally, I’m not looking for the first move
to be the size of the larger pullbacks to the trendline, but more like the
first moves off of the trendline. Keep in mind, I say trendline here just as a
guideline. Sometimes the issue doesn’t fit a trendline well. In this case I
just look at the oscillations of the issue, and see the relative size of the
various swings that it lays out. This gives me an idea in my mind of what I may
be looking for. I look most closely at ‘first thrusts’ from the larger
corrections. This is the approximate amount I am looking for on a new first
thrust in the possible new trend.
In figure 7.1 I see what looks like a good
candidate. See figure 7.2.
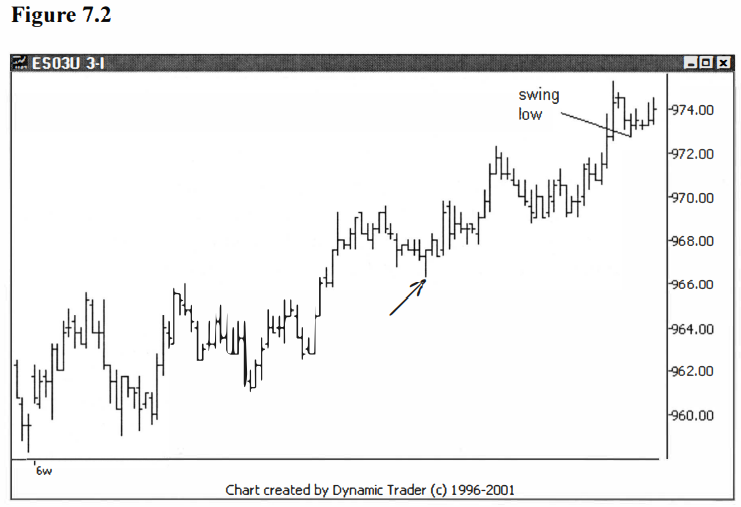
The first thrust up from where the arrow is on
the chart looks to me to be an average first thrust move for the issue here.
The move is 3.50 points. I also see two more first thrust moves that I could
focus on. Let me add arrows to the chart for those two moves. See figure
7.3.

The first move on the left of the chart was
4.25 points, and the last move, on the far right of the chart, was 2.50 points.
The average of the three moves is 3.42 points, or to the nearest tick, 3.50
points. That’s the exact value of the first thrust choice I made from figure
7.2, as looking like an average first thrust type move.
I picked it because it was in the middle of
the values that I saw on the chart, and thus I expected that it would be a good
representation. I didn’t do a lot of calculations to come up with that, you can
just look at the chart and figure it out. Now where would 3.50 points put the termination
of the first thrust down off the top? I’ll add that to the chart, to see where
I would be looking for a first thrust to go. See figure 7.4.

The area for an ‘average’ first thrust would indeed be lower. For me, the area
around 971.75 would have been a lot better of an area for the swing-low to
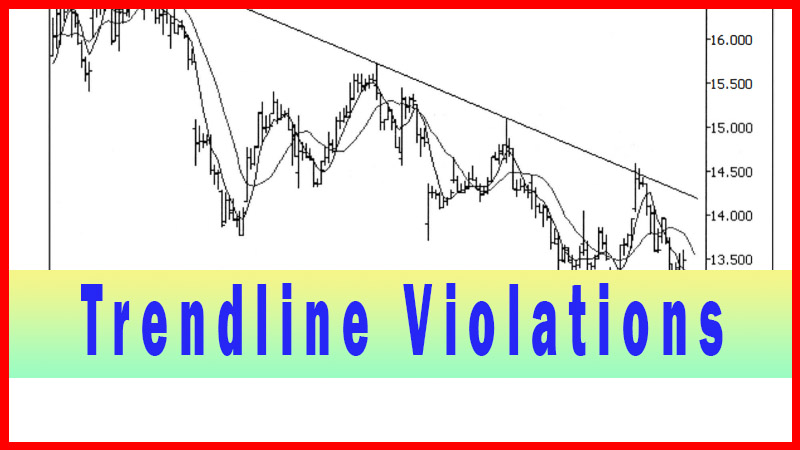
form. Let me add back in the trendline, and we’ll see something quite
interesting. See figure 7.5.

Note the proximity of the trendline to the
labeled area of 971.75. I do not believe this is a coincidence. I find the
first thrusts are frequently in or about the area of the trendline. Also notice
how the area I was looking at around 971.75 is also at just about the same
price level as the last swing-high before the final top. I also believe that
that is not a coincidence. I frequently observe the first thrusts going to
areas of previous swing-points like this.
Given all this information, why would I have
still considered this a good candidate for a swing-low violation entry? There
are several reasons. The most important thing to consider is that this is not a
perfect world. You will rarely satisfy all the criteria you are looking for. So,
at some point you make a judgment call based on experience.
I felt the trade setup, i.e., the potential
trade area from the higher timeframe, was a very good setup. I liked the
general behavior of the mini on the lower timeframe chart, as it approached the
area. I also noted that I could have a tighter protective stop loss with the
smaller initial thrust, since 1’d be closer to the potential trade area. Based
on experience, I felt the swing-point was acceptable.
Let’s look again at the swing-high from figure
6.11. I observed that the first thrusts were approximately the same at this
time as in the last example, about 3.50 points. I added the 3.50 points to the
potential reversal point in the trade area, and labeled the chart with a line
at 981.25. I also included the trendline that was used for the trendline
violation technique. See figure 7.6.
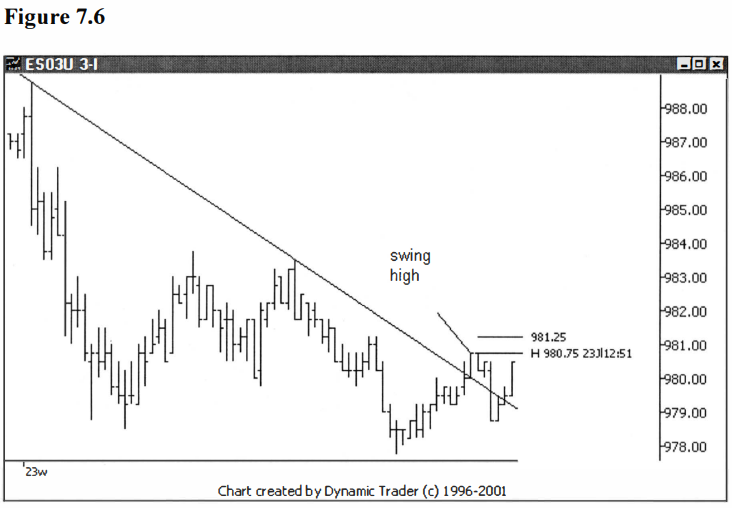
It is clear to see, and again interesting to
note, that the first thrust is very close to the expected first thrust and is ‘in or about’ the
area of the trendline. I think this should provide enough additional information
for the reader to be able to get a handle on the character of acceptable
swing-points and pullbacks. To complete this phase I will reassess the example
of the swing- point I didn’t accept as a candidate in the last chapter, as
shown in figure 6.4. Let’s look at that chart again. See figure 7.7.
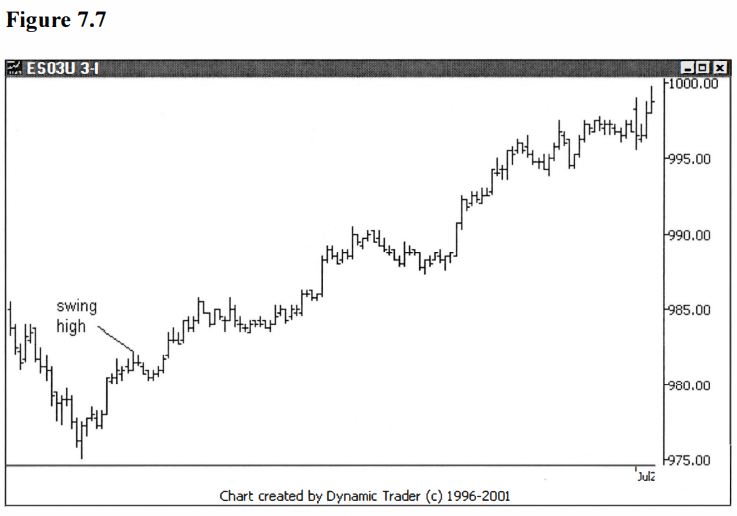
This was the swing that I felt was just too
far from the potential trade area, and I accepted not taking the trade using
this technique. I did mention that the area that looked good was perhaps just
above the very small swing and pullback area (between the reversal point and
the swing-high labeled on the chart), and that that smaller swing-high was just
too quick off the bottom and didn’t pull back enough for me.
Let’s now put the trend line on the chart,
and, since the first thrusts are still around 3.50 points at this time, I’ll
also add the line for 3.50 points off the bottom. This shows me the area that I
would normally be looking at. Keep in mind, I determined this 3.50 points as my
own approximation as to how I felt the issue was trading at the times these
charts were unfolding. I am in no way implying that the issue trades like this
anymore, or that the 3.50 points was anything special.
In fact, the 3.50 points may not have been
correct for anyone’s trading except my own, even at the time these charts
actually unfolded. Each trader must determine for himself or herself what
parameters may work for them. I say all this because it is critically important
that all readers understand that I am using these examples to explain my
thinking process, not to give details of how I think any particular issue
should be traded. The examples are used only to show how I reason out my
trading process.
Let’s move on to the chart. See figure 7.8.
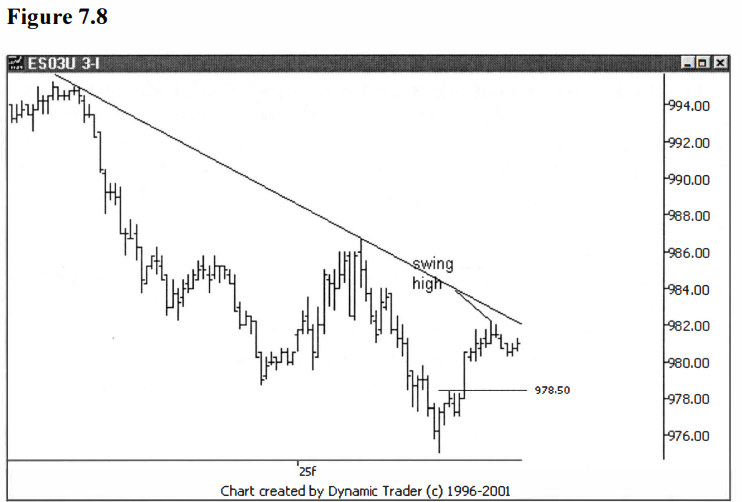
This is quite interesting. It turns out that
the smaller swing was right at the expected area for a first thrust (a
coincidence?), and the swing-high labeled was, in fact, way too far from the
potential trade area. But notice the trendline. Even the way too far up
swing-high didn’t get to the trendline. What does that say?
When you first look at the trendline, as it is
considered as a potential entry trigger, you must evaluate if it makes sense to
consider its use. In this case just two points determine the trendline, and the
second of those points comes after a significantly large countertrend move.
This is going to have a large part of the price action well away from the
trendline. This can be seen by the large air gap between the prices and the
trendline between the contact points.
What this tells me is that I would be using a
trendline that hasn’t been tested at all (no third or fourth contact point,
etc.), and one that is going to be far from the potential trade area. Although
either of these conditions doesn’t necessarily preclude the use of the
trendline as a potential trigger, both together greatly decrease the utility of
the trendline for me. Combine these two conditions with the fact that the
trendline is way above the area where I would expect the first thrust move to
go, and that would pretty much preclude my using it.
This is all interesting, but this is a
discussion right now on the swing-points and pullbacks, so how does this relate
to that topic? Well, I was saying that generally the first tradable swing-point
and pullback frequently happens in or about the trendline area, and in this
case that wasn’t even close to correct. This should be an alert to the trader.
As I alluded to before, I will commonly put three or four techniques on my
chart and see how they look as the potential trade develops.
This not only allows me to ‘shift on the fly’
with my choice of techniques (if I want to), but it also allows me to
look for ‘anomalies’. I’m looking for
anything that doesn’t fit, and in this case the trendline being so far from the
preferred area for the first pullback to occur would get me ‘digging into’ the
trade a bit more, looking to understand why that might be. Another thing I
frequently notice, and I consider this one of my best-kept ‘secrets’ (until
now, that is!) is that the first pullback will usually occur three to five bars
after the crossover of a 5/15 period simple moving average.
This is not to say that a pullback always
occurs, or always occurs in this area, just that when it does occur my
experience is that it most often occurs in this area three to five bars after
the crossover. This also helps me in my determination of the viability of a
swing-point for use in the swing-point violation technique, as well as the
viability of the subsequent pullback for the pullback entry technique. The lack
of this criterion won’t preclude the move from my consideration, but it will be
one of the factors I will use in my consideration.
At this point I feel I have given the reader a
detailed look into my thought process for determining the relative
attractiveness of a given pullback for use with the swing-point and pullback
techniques. Using this information, with some experimentation and practice,
each trader should be able to make an informed decision about potential
candidates that meet their own personal criteria. All that is needed, now, is
how I trigger a trade that has pulled back.
Like many of the techniques presented so far,
there, of course, isn’t one clear-cut answer. I use several different triggers,
depending on the individual situation. Each trader will have to decide if he or
she finds benefit from my particular triggers, or if they want to formulate
ones of their own.
I have three basic triggers that I use for
most pullback entries. All are fairly simple and straightforward. To start
with, I use a similar concept to not taking a trigger until the potential trade
area is penetrated. In this case, the pullback must be at least 50%, and once
it has reached that amount, I will then accept a trigger. I will first briefly
present the three triggers, and then go into details and examples on them.
The first trigger is simply a fade entry once
the minimum 50% retracement has occurred. The fade may be immediate or I may
wait for a ‘slowdown’ or ‘pause’ in the action, and then enter. The second
trigger is taking out the high of the last bar of the pullback, once it has
reached the minimum 50% required retracement
(reverse for short trades). The third trigger is the ‘cool trick’ entry
I will present in chapter 9. If this one set up, it is my preferred method.
Let’s look at MSFT on a 15-minute chart. I
found a very nice-looking potential trade area on the 60-minute chart, and I
have dialed down to the 15-minute to look for an entry. The potential trade
area is around $25.40. A pullback is starting and I’m waiting for the 50%
retracement to be penetrated. See figure 7.9.
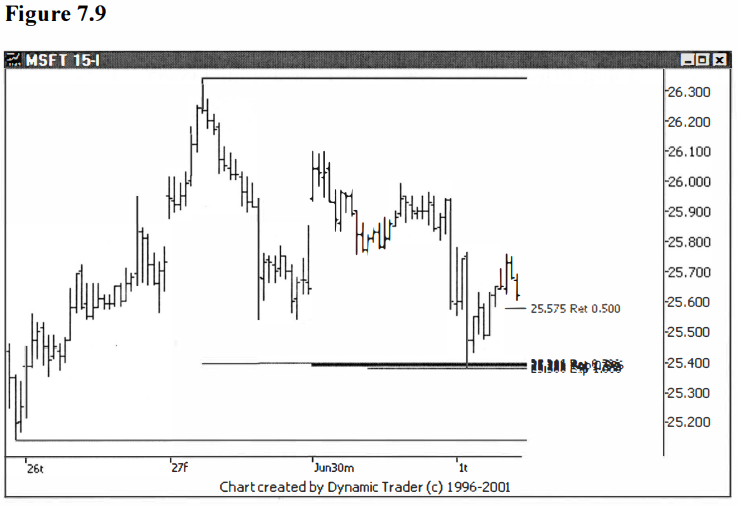
As soon as MSFT trades at $27.57 I would
consider an entry trigger, assuming, of course, that this happens fairly soon
and in an orderly manner. This goes without saying, but I’m mentioning it to
make it clear that this is a here and now opportunity. The part I don’t mention
on each and every example is that I’m assuming it continues its pullback and
penetrates the area below the 50% retracement, and doesn’t do anything that I
don’t like the looks of. If i t goes sideways, for example, for the next ten
bars and then goes below the 50%, I will have abandoned the trade long before
that point. Each trader needs to decide individually what is acceptable price
action as potential trigger time nears, but it must always be considered.
Let’s advance one more bar and see what
happens. See figure 7.10.
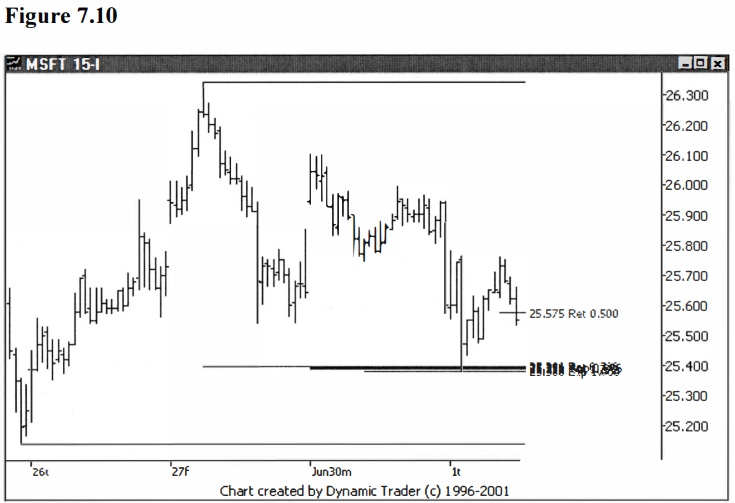
The trade would now be triggered on a fade
entry. Although there is no way to know if an actual fill could have happened
at $25.57, let’s use that price for the sake of the example. If I were in this
trade my most likely stop placement would be just under the potential trade
area (which is around $25.40). I can now also be looking for trigger entry type
number two, above the top of this last bar. The last bar has a high of $25.66.
Let’s add another bar and see if MSFT is going to
trigger the second entry type, or if the first entry is going to take some
‘heat’. See figure 7.11.
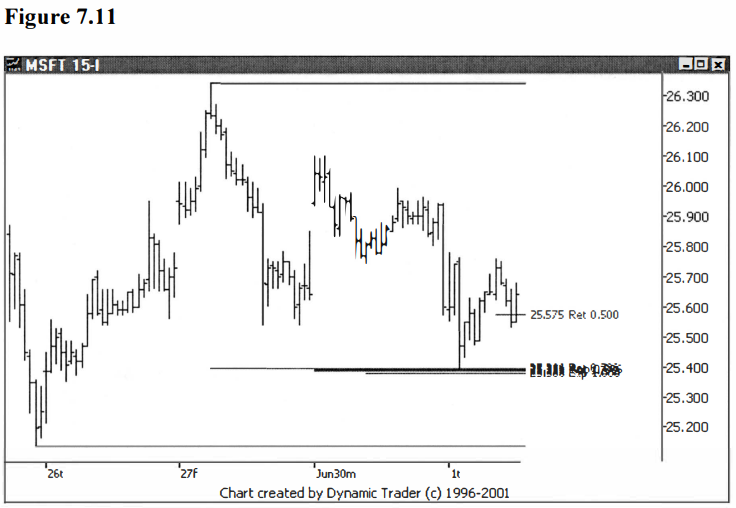
The trade would now be triggered by the second
method, trading over the high of the previous bar. For the example, let’s use
the price of one cent over the high, so that would be $25.67. For the
additional educational value, let’s note that the swing-high point is at
$25.76. Using one cent over the high as the example price for the swing-high
violation trigger, that trade would trigger at $25.77. So, you can see that the
fade entry is $25.57, the trade over the bar high entry is at $25.67, and the
swing-high violation entry is at $25.77.
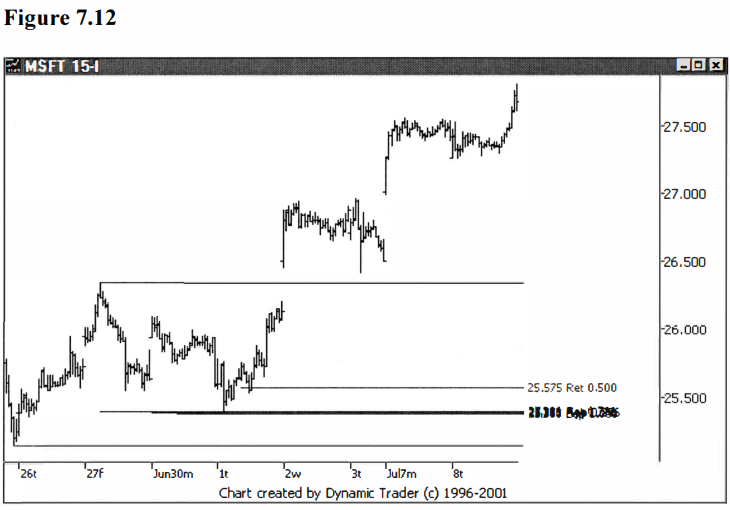
It’s just a coincidence that the increment of
increase in each case is ten cents. You can see how each entry costs you a bit
more, but generally will give you a little bit more confirmation. But, just as
before, you can also see that, in the context of the 60-minute traded
timeframe, the differences are very small. I’ll add in quite a bit more data to
this chart to show how this trade played out, to put the differences in the
entry into context. See figure 7.12.
I will refer back to this example in chapter
9, when I cover the ‘cool trick’ entry. I wonder if the ‘cool trick’ will wind
up giving an entry very similar to the current entries? I think you know the
answer to that one.
Let’s look at one more example of a pullback
entry and then move on to the next technique. Well look at UPS, using the
swing-high and pullback from figure 6.15. I’ll start with the daily chart,
showing the pullback as it is forming, with respect to the 50% retracement. See
figure 7.13.
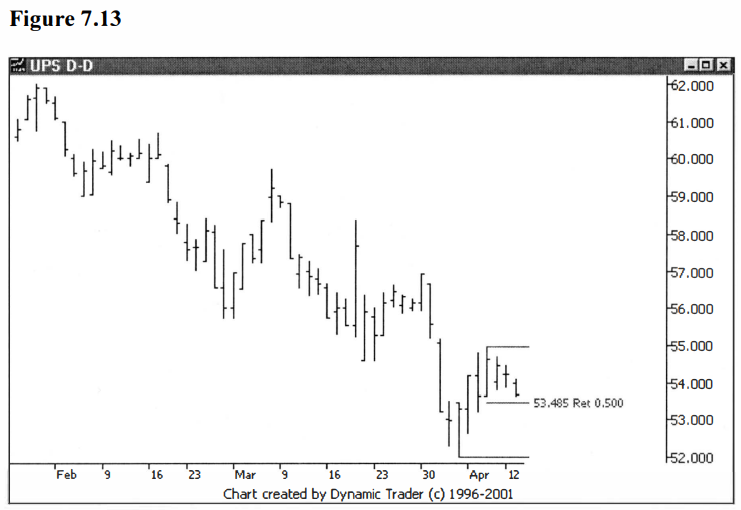
UPS hasn’t quite pulled back my minimum 50%,
so I’m not ready to accept a trigger just yet. I’ll move one bar ahead and
reassess. See figure 7.14.
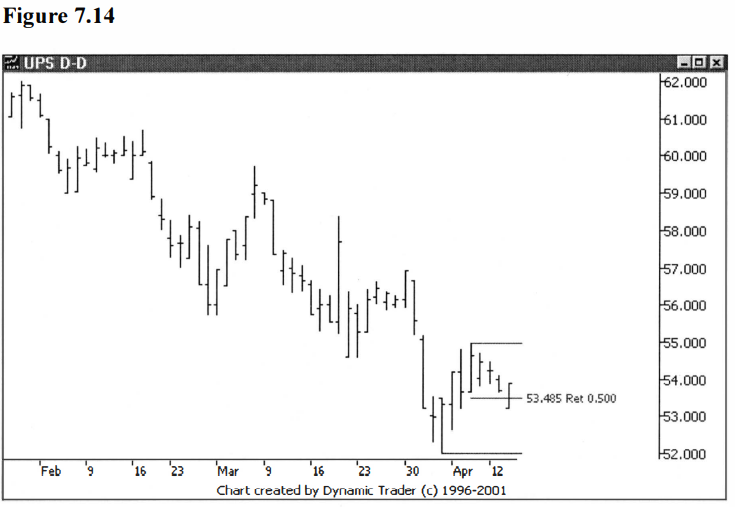
UPS has now penetrated the 50%
retracement minimum and has thrown a very strong reversal bar. This last bar opened at the low of the bar
and closed at the high of the bar. A fade entry would be triggered at the trade
below the 50% retracement line. For this example, let’s say that trigger price
is $53.48. I would be looking, now, for a trade above this last bar, for a
trigger of the ‘trade above the high of the
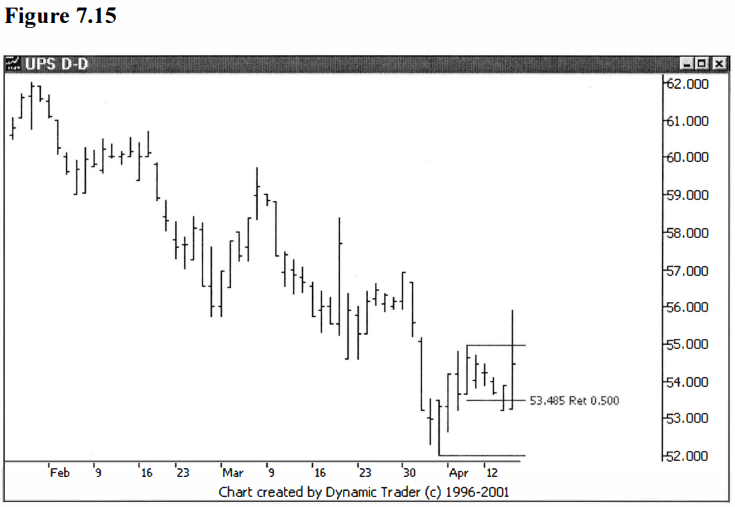
previous bar’ entry. I’ll move
one more bar ahead and see if UPS triggers. See figure 7.15.
 e
e
UPS blasted above that last bar, triggering
not only the trade above the high of the bar entry, but also the swing-high
violation, on the same bar. For the sake of this example, we’ll say the second
entry trigger price is $53.90, and the swing-high violation entry trigger price
is $54.98. The prices are all fairly close, again, given the price of UPS. You
definitely trigger at a better price, though, by anticipating the swing-point
violation with this technique. I will refer back to this example, also, when I
present the ‘cool trick’ in chapter 9.
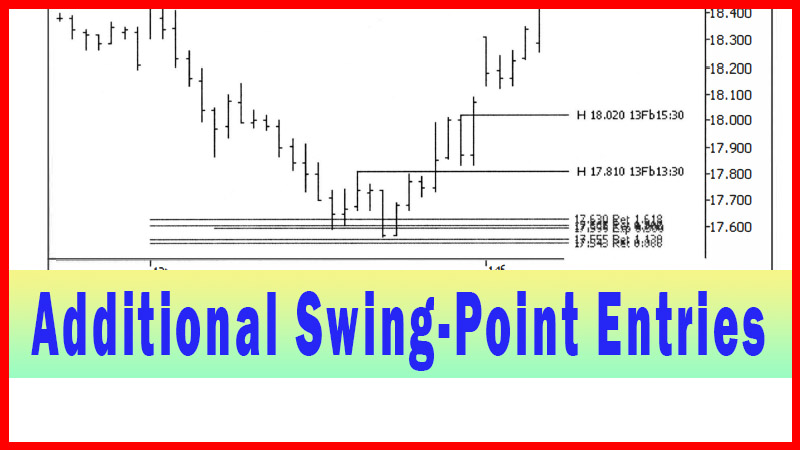
In the next chapter, I will revisit
swing-point violations, but this time with a new twist. By adding this new
twist, it will add many potential entry opportunities for trades. It will also
address, at least partially, the problem of what to do if you simply don’t get
any swing-points or pullbacks after the potential trade area is penetrated.
Best Trading Entry Techniques : Trade Entry Techniques : Tag: Trade Entry Techniques, Forex : Pullback Trading Strategy, Impulse Pullback, Fibonacci Retracement, Best Trading Strategy - Pullbacks Trading Techniques