Trendline Violation Technique
trendline trading, Trendline Breakout, Trendline Breakout and Retes, Best trading strategyt
Course: [ Best Trading Entry Techniques : Trade Entry Techniques ]
The trendline violation technique when an issue is oscillating along an axis as it heads into a potential trade area. This type of price action is very difficult to use with moving averages, since you may get multiple false signals. In general, this oscillating price action can be difficult to trade.
Trendline Violations
The next technique I will present I call the trendline violation
technique, and for obvious reasons. The trigger into the trade will
be when a trendline is violated by the price action. But violation of what
trendline? And when do I like to use the technique?
I am really partial to the trendline violation
technique when an issue is oscillating along an axis as it heads into a
potential trade area. This type of price action is very difficult to use with
moving averages, since you may get multiple false signals. In general, this
oscillating price action can be difficult to trade.
If you still want to trade an issue that is
demonstrating this type of price action, perhaps because the traded timeframe
setup is particularly nice, this can be a good technique to use for entry.
Understand, though, what the expression ‘difficult to trade’ means. The
bottom line is, it really means your stop will have to be wider and/or you’ll
hit fewer trades. And perhaps make less when you hit one.
That all translates to making less, on
average, per trade. That, then, alters the reward/risk ratio. Just because you
can trade something doesn’t mean it fits into your game plan. Sometimes it
does, but what I want to point out is, sometimes it doesn’t. Fully assess
trades that are more ‘difficult’.
Let’s look at AMZN, which, in this example, is
headed for a potential trade area on a daily chart. The potential trade area is
a huge Fibonacci support zone, based on the groupings technique. Keep in mind,
the entry techniques presented here are not specific to the Fibonacci groupings
techniques only, I just use them for examples because they are one of my main
ways of trading. See figure 4.1.
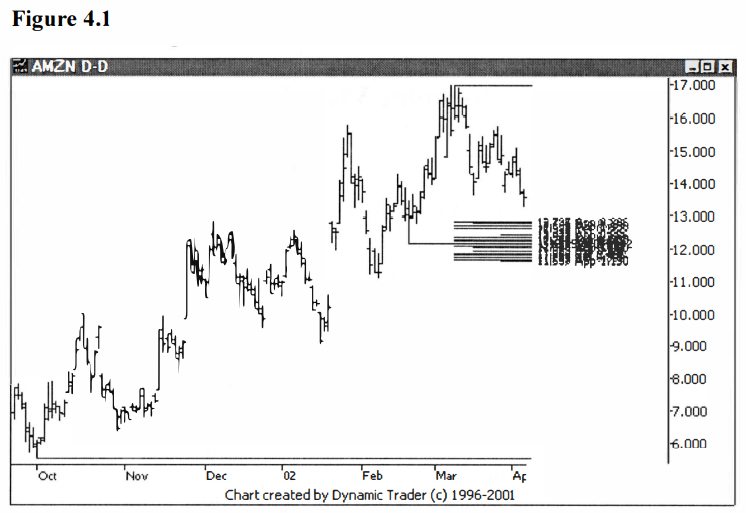
The assumption on this trade is that the
uptrend will reassert itself, reversing off of the area of one of the three
Fibonacci groupings. At this point an entry technique is sought, and that would
be on the lower timeframe. In this example we’ll look at the 60-minute chart.
For the sake of clarity, I will not include
all the Fibonacci groupings on the 60-minute chart. We can note that the first
grouping will be reached as soon as the price drops below $12.80. Once that has
happened, i.e., the potential trade area has been ‘penetrated’, any valid
trigger that I have decided on would be accepted. Let’s look at AMZN on a
60-minute as it approaches the potential trade area. See figure 4.2.
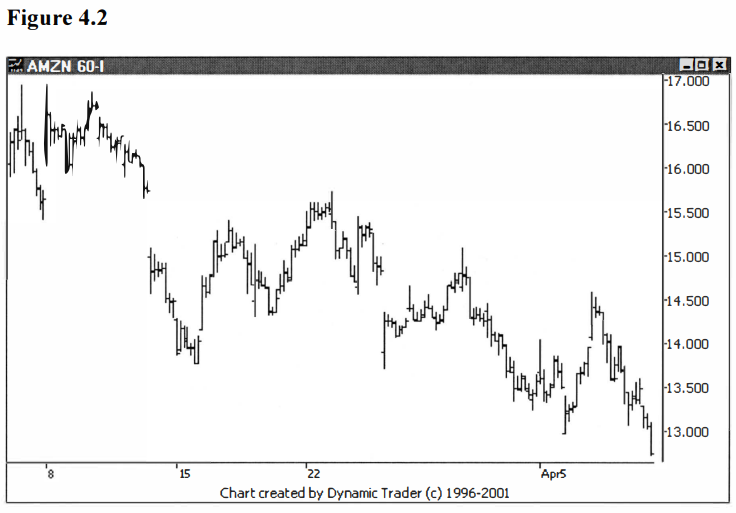
AMZN has now traded into the potential trade
zone here, with the low on the last bar being $12.71. At this point I would now
be looking for my trigger, whatever trigger I have pre-chosen, to initiate me
into a trade. For comparative purposes, let’s add in the 5 and 15-period simple
moving averages to the chart, and see what observations we might make. See
figure 4.3.
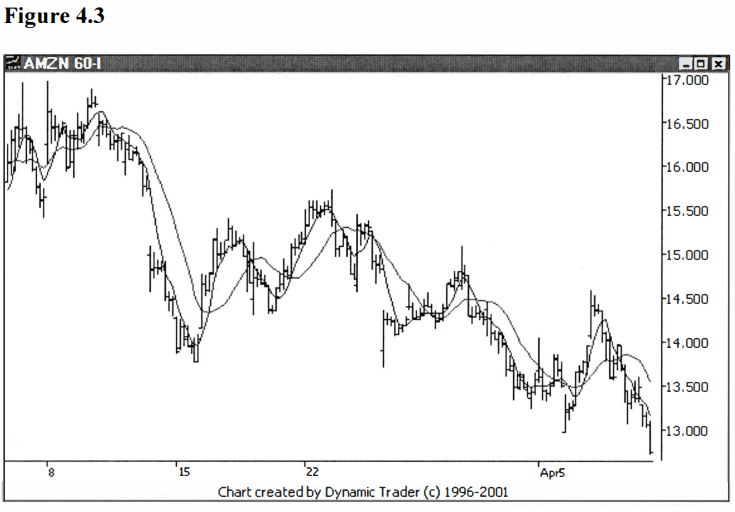
Notice how AMZN is oscillating up and down in
fairly broad swings as it trends down to the potential trade area. This doesn’t
preclude the use of a moving average crossover trigger, but it does make me
less inclined to use it. In my experience, I have seen more false starts when
you see action like this.
Admittedly, though, when I look at figure 4.3.
I have to say that it is fairly orderly. Hence, based on what information I
have up to this point, this is an example where I almost feel it is a coin toss
between using the moving average cross trigger and ‘paying up’ for more
confirmation and waiting for a trendline violation. Let’s add a trendline in
and reassess. See figure 4.4.
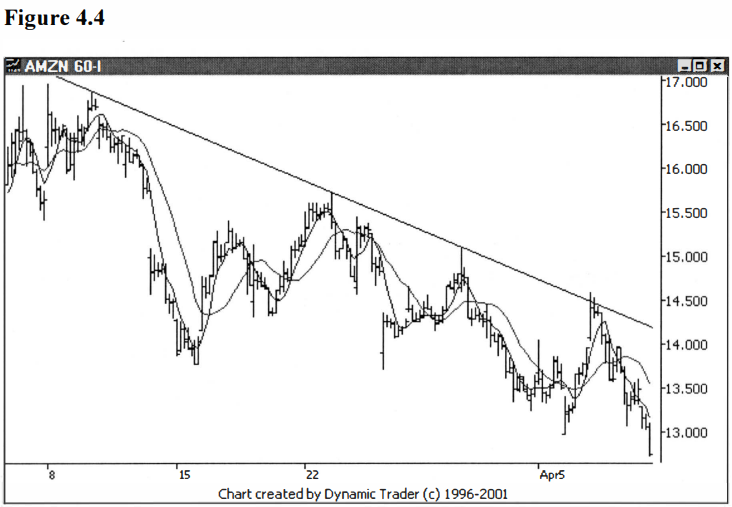
I drew the trendline from the first two points
where you can see contact between the price and the line. It’s amazing how the
third point of contact was such a sharp reversal, right at the contact point. I
would hazard a guess that a few people were watching that trendline. The fourth
point of contact slightly exceeded the trendline, with no closes above the
line. It then sharply reversed once again and set a new low, this time right at
the top of the groupings. Let’s move ahead another four bars and see what’s
happening. See figure 4.5.
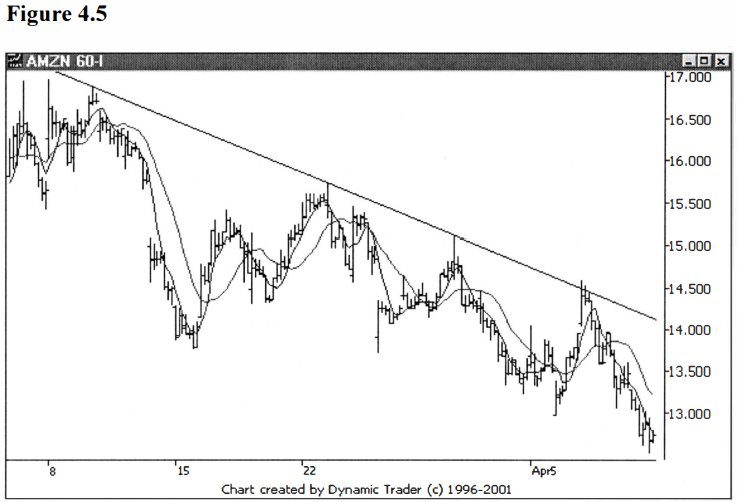
The price has dropped a little bit further,
but it is a very smooth, orderly decline since the reversal off the trendline.
I particularly like using the trendline at this point because it has been such
a great guideline thus far. Many traders are likely watching it, and a
violation will surely initiate action on the part of some of these observers.
The downside? Everyone is watching a trendline
that is guiding trade so well. That may make it difficult to use when the entry
time comes. A moving average crossover trigger would likely come first, and one
might opt to use that as an entry to anticipate the trendline violation.
One possible option is to use the moving average
crossover trigger, and if the trendline isn’t then taken out as
expected, close the trade. At that point the trade would likely be a small
profit or a scratch. Let’s move another five bars ahead. See figure 4.6.

AMZN has come off the top of the groupings
very strongly, and we now have a moving average crossover trigger. Keep in
mind, we are examining the trendline violation technique in this chapter, but I
want to watch the moving average crossover trigger at the same time, for the
additional educational value this should provide.
As you look at this chart, you can clearly see
we have a battle going on between the very short-term uptrend that has begun
from the reversal off of the top of the groupings (and pointed out to us by the
moving average crossover trigger to the upside), and the downtrend, as clearly
defined by the down trendline. Why would I play a trade like this, then?
Recall that my traded timeframe is the daily
chart, and I have formed my potential trade area based on that daily chart. The
downtrend that is guided by the trendline is on my entry chart, and that is a
lower timeframe 60- minute chart. I expect the daily chart will prevail, and
the uptrend will reassert itself.
I find that in almost all the trades I look
at, there is always a battle between two (or more) timeframes, and I am forced
to play one against the other. As I have outlined in some of my other works, I
call this ‘the trader’s dilemma’. Unless I am specifically trading against the
larger timeframe trend, I just about always bet on the larger trend. In this
case, we would be betting on the larger timeframe trend by going long at this
point. Let’s note that the closing bar price after the moving average crossover
here is $13.53. Now let’s move ahead another six bars. See figure 4.7.
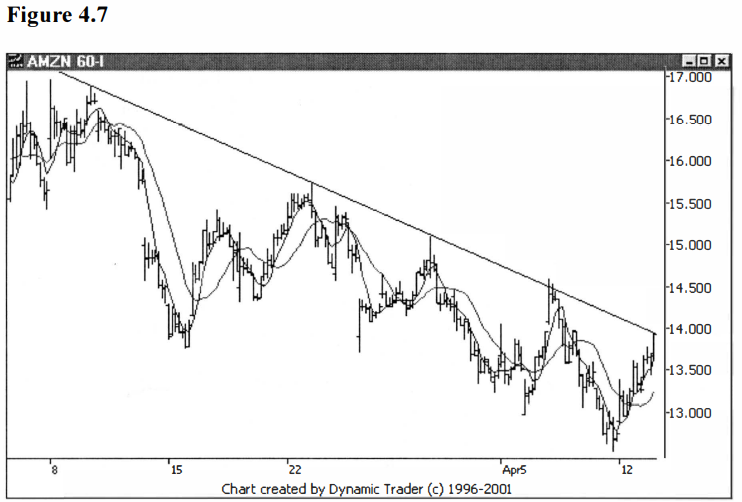
AMZN is now right at the trendline. It’s done
or die time, when the buyers and sellers will be making critical decisions. My
expectation, based on my experience, is that the most common scenario is for
the issue to pullback, hence pulling in some shorts who expect the trendline to
hold, and then once it’s dropped a little bit, the real buyers will step up and
take all the rest of what the shorts have to sell, and it will then tum up.
Once the trendline is then taken out the shorts will cover and off it will go.
I can hear a lot of readers right now saying ‘Well, we know what
is going to happen on the next few charts now, since he already knows the
outcome, or he wouldn’t have just set us all up for that scenario.’ Actually,
no. I do know what the outcome was already, since this is past history, we are
reviewing, but I put that comment in just as I would have thought about it as
this unfolded in real time. And as you’ll see, that scenario isn’t how it
played out. Let’s first move just one more bar ahead. See figure 4.8.

AMZN has continued up and violated the
trendline with a firm close above the trendline. Whether you chose a price
cross above the trendline or a close above the trendline (or anything else you
may have decided on ahead of time), the trade would now be initiated at this
point.
For our example, let’s note the trigger bar’s
closing price, which is $14.05. This is a full fifty-two cents above the
closing price for the moving average crossover trigger bar. If you waited for
this trigger, you paid up a lot more. I would consider this if I felt I got
something for that extra money I paid, and in this case what I would feel I got
was a greater likelihood this trade is going to work out as I planned it.
Let’s move ahead one bar and see how the
market is reacting to this ‘breakout’ above the trendline. Note that AMZN has been going nearly
straight up for $1.57. I prefer not to hit an area of strong support or
resistance that I hope to break with the issue possibly running out of
steam. I’d prefer to see a few rests stops before it hits the critical area.
Also note that, as I mentioned before, it’s
common for an issue to pullback near or shortly after a moving average
crossover with the type of period lengths we have been looking at. On the
timeframe we are looking at, the 60-minute, we didn’t get any notable pullback
after the crossover. This may mean we are out of steam and the slight trendline
violation won’t hold, or that this thing is strong and we, as they say, ‘are gone’.
See figure 4.9.
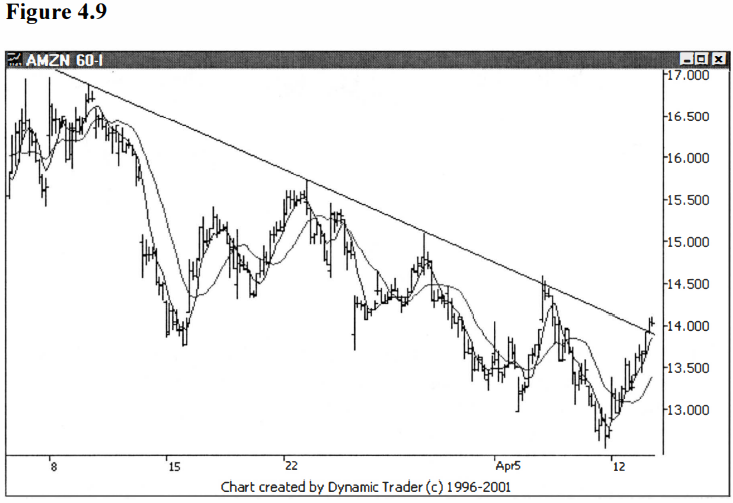
AMZN exceeded the ‘breakout’ bar by one
cent, but otherwise essentially printed an inside bar. This is a period of
indecision, and all we can do is wait and see how it plays out. Our stops would
already be set and we would do nothing but let the trade play out.
I just like to assess what I see to help
evaluate trade behavior and see if I can learn anything useful that I may use
in my future game plan. My reason for such detail here is to help you see what
my thought process is and how I come to make the decisions I do, based on ‘experience’.
I’m trying to share some of my experience, simulating how I get some of that
experience. Let’s go forward and see how this is playing out. See figure
4.10.
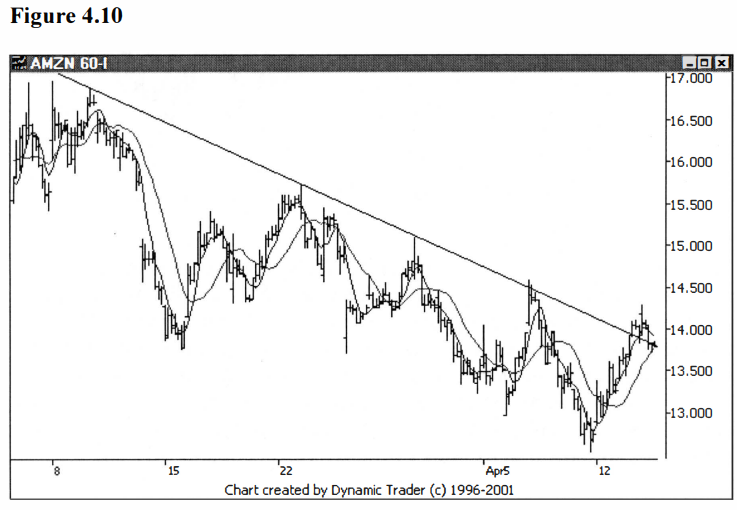
Well, AMZN went up a bit after the ‘inside’ bar,
and now has pulled back below entry, right to the trendline. This is all normal
behavior and may be the rest before the launch I frequently see. Regardless of
the stop you chose, it would likely be well below this tiny pullback, and not
threatened at all at this point. Again, we are just trying to glean educational
information out of the price behavior at this point, and all we can do is let
the trade, itself, develop, as we stick to our pre-determined game plan. Let’s
move forward and see how the players are going to react to this small dip. See
figure 4.11.
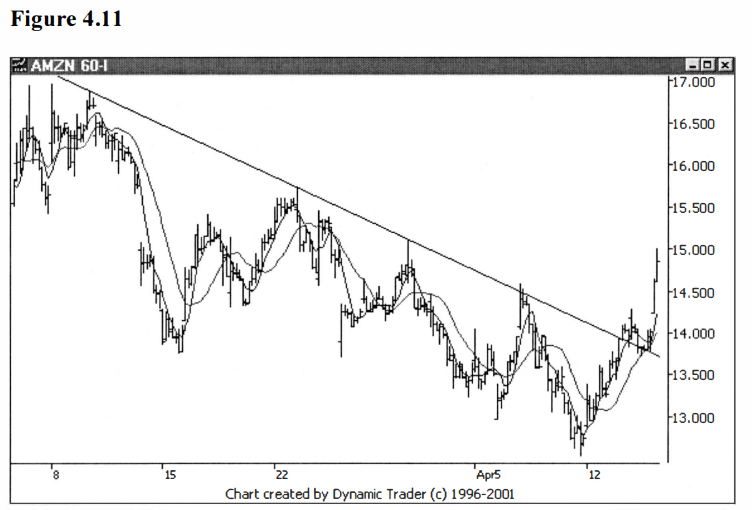
They decided to take the small dip, and AMZN
is now clearly broken out above the trendline. The slight pullback was a quick ‘test’ that was
bought, and the trade is now working out quite well so far. But remember, the
traded timeframe is the daily chart, so I’m not going to try and micromanage
the trade on this lower timeframe 60-minute chart. First, let’s see how the
trade played out longer-term, on the 60-minute chart. Since the chart had to be
compressed quite a bit to show all the data, we’ll follow that up with the
daily chart, to show it in its proper perspective. See figures 4.12 and
4.13.
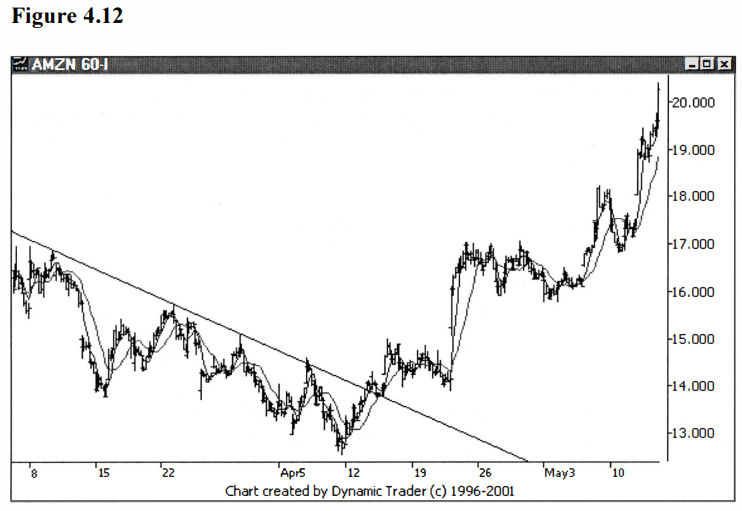
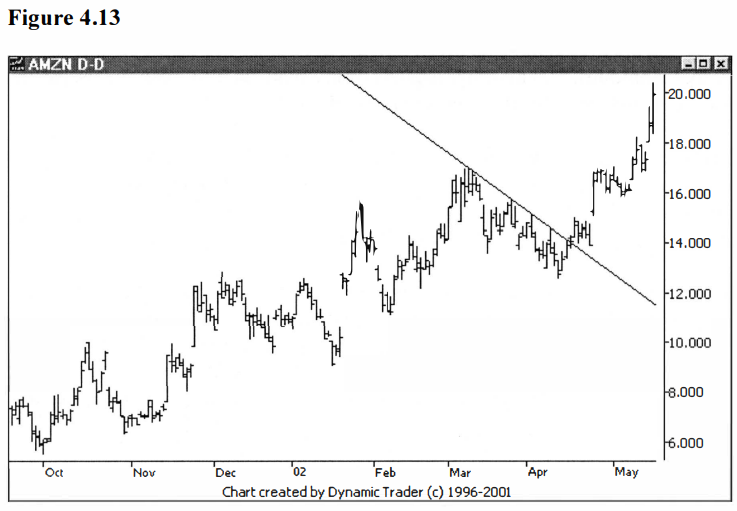
AMZN rested for a while after the trendline
break, but hardly pulled back at all. If your game plan allowed you to be
patient i.e., it had no type of fairly short-term time stop, you would have
been able to capitalize on quite a strong up-move. This up-move was very
consistent with the type of moves already seen on the daily chart, and should
have come as no surprise in the context of your overall plan.
In looking back at this example, it is fairly
clear that this was a trade where you couldn’t clearly see what the best choice
was for an entry plan. By this, I don’t mean that you couldn’t see any good
choices, but that one choice didn’t jump out as clearly superior over the rest,
at least in my experience. This is quite commonly the case.
Since you have no idea what the future holds,
you won’t ever know until after the fact what the best choice would have been.
This is something one has to get used to as a trader. You play the
probabilities, and that includes the choice of entry techniques. You must
decide, using your experience, what the probabilities tell you about a given
setup, and then make your best decision. After that you can only let it play
out according to your plan.
You then incorporate that additional
experience into the mix, and try to assess the probabilities better the next
time around. I have never found there to be one clear-cut ‘right’ answer, at
least not before the fact. I choose my entry techniques, and all other aspects
of my plan, as best I can, by assessing the likely outcomes of the scenario at
hand.
With all that said, I want to present one more
example, this one where I think the trendline violation is clearly superior to
the moving average crossover technique. The problem is, any time this technique
is clearly superior, you may not want to take the trade. Let me explain.
The times when you may want to avoid the
moving averages, whether it be moving average cross or moving average
crossover, is when the market is ‘choppy’. When the issue is trending, let’s say, but
jumping all herky-jerky above and below a moving average or regression line as
it trends. It is still trending, but not in a smooth, orderly fashion. In
general, when I notice this, I just stay clear of
the issue.
Sometimes, though, I find a potential trade
area that looks just great on the traded timeframe, but it is choppy on the
lower timeframe. The moving average techniques just get whipsawed, so I opt to
pay up and go for the more confirmation technique of the trendline violation.
Not necessarily because I want more confirmation, but because this may be the
least restrictive technique that I can use for the issue, the way it’s
behaving.
You have to look at the way the issue behaves
and try and match up a technique that will work. If you have more than one that
looks good, then, as I mentioned, I use the least restrictive technique, the
one that gets me in the soonest, paying the least ‘premium’. And when won’t the
trendline technique be useful? Well, for example, how about if you can’t draw a
nice trendline?
Many times, an issue won’t grant you the nice
points necessary for a trendline. Or what if you can draw a trendline (or
multiple trendlines), but the issue doesn’t seem to respect them to any great
degree? Well, then I wouldn’t use this technique. The nice thing about these
techniques is that you can see, before you reach a potential trade area, how
the issue is acting with respect to a broad choice of the different techniques.
To summarize, I find the trendline violation
technique as the best choice when the issue is choppy but a trendline can be
drawn, and the trendline looks to guide the trade. This happens here and there,
because it may be the only obvious guide the trade has, and hence many starts
to watch it. Gaps and irregular trade are brutal on moving average
calculations, but have very little effect on a trendline.
When you have an issue that is gapping all
over the place and chopping as it trends into the potential trade area, look to
the trendline technique as a possible entry technique. Keep in mind, though, I
think it should be the rare exception when an issue that behaves like this
should be traded at all.
Let’s look at the example, now, where I think
the trendline violation technique would clearly be the choice. FLEX trades in a
very choppy manor, with large gaps being pretty much the norm. The company is
actually headquartered in Singapore, but it trades on the NASDAQ. It trades
somewhat like an ADR in the way it gaps nearly daily, sometimes with quite
large gaps.
I noticed a pattern develop on the 15-minute
chart, and the 60-minute and daily charts gave me the context I needed to
confirm the potential viability of my potential trade area. The trade was
actually a reversal trade and not a trend continuation trade (which is my most
common type of trade), and hence I was looking for a technique with a pretty
fair amount of confirmation. I wanted to be a fair amount away from the
potential trade zone, in exchange for what I would expect to be a greater
likelihood of the trade working out. Let’s first look FLEX on the traded
timeframe, the 15- minute, as it is approaching the potential trade area. See
figure 4.14.
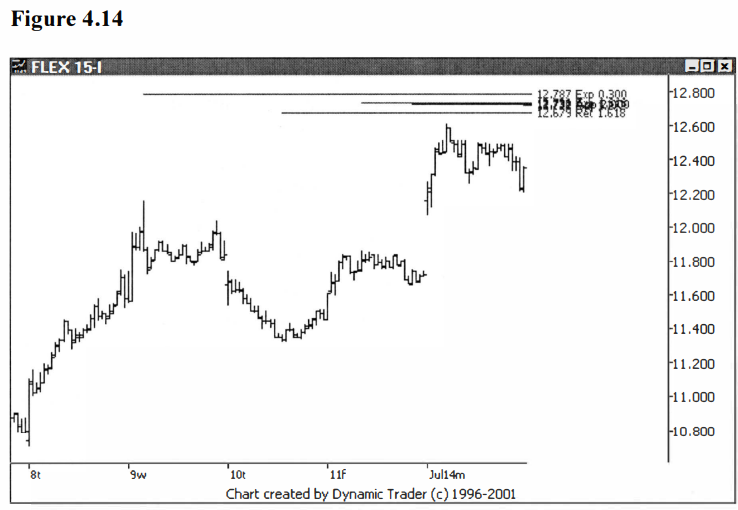
FLEX approached the potential trade area and
backed away, ending the day in the middle of the day’s range. Let’s move
forward to the next bar, which will be the opening bar for the next day. See
figure 4.15.
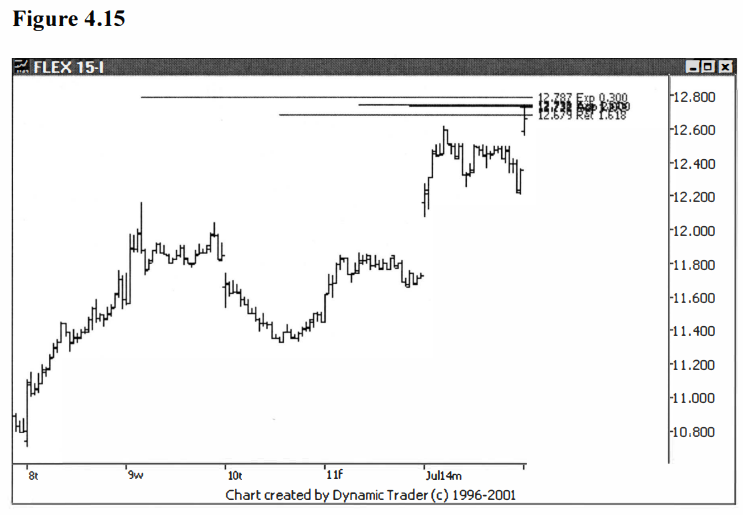
As is so common with FLEX, it gapped open, and
right into the potential trade area. Once this area is penetrated, I drop down
to my lower timeframe and look for my trigger. I will show the 5/15 simple
moving averages on the charts so we can examine that trigger as we look at the trendline violation
trigger. First, let’s look at the 5-min chart the day before the gap
up into the potential trade area. See figure 4.16.
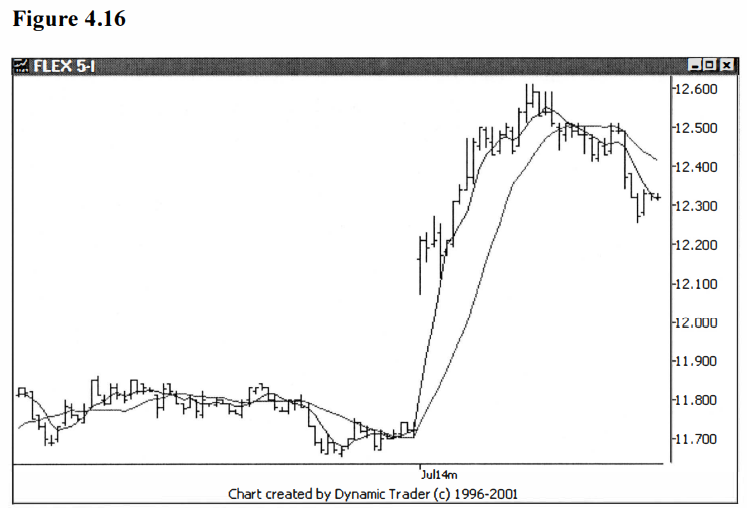
FLEX appears to be behaving fairly orderly
with respect to the 5-minute moving averages. The biggest problem is with all
the gaps, which can really skew the moving average calculations. Let’s move
forward on the 5-minute chart, jumping ahead to the end of the next day. See
figure 4.17.

Well, now we have some data we can discuss at
length. The open on July 15 was the gap up move we saw, into the potential
trade area. At was at that point that I stated I would be willing to take my
trigger and initiate a trade. If you were inclined to use the moving average
crossover technique, you would have a trigger very soon after the open.
But notice how skewed the moving averages are
by that gap open. You have a crossover, but it is clear that at that point the
longer period moving average, the 15-period, still hasn’t overcome that gap
yet. That indicates that the crossover is not a ‘smooth data’ cross, if
you will. Take note, though, the most interesting thing to me is the multiple crossovers and re-crossovers as the day
wears on.
Granted, you could be triggered into this
trade by the moving average crossover and be just sitting tight, waiting for
your game plan to play out. But I would not be confident that any of these
crossovers mean anything. Now you can guess that I picked a trade that is going
to work out so I can demonstrate the trendline violation entry, and that is a correct
assumption.
Given that, it’s apparent that the moving
average crossover entry is going to work out okay.
That may all be true, but this is just one
example, and one with a predetermined outcome. When I evaluate a trade after
the fact, one of the things I like to look at is how the issue behaved in the
areas that I considered technically significant. That’s how I judge the action
in the issue, that is, how well it appears to react to areas where I expect
reactions. Sure, the moving average crossover may work here, but it appears
like it would just be luck, not technical factors. Let’s look at more data on
the 5-minute chart, to see where the trendline is in all this, and what it is I
am looking at for my trigger. See figure 4.18.
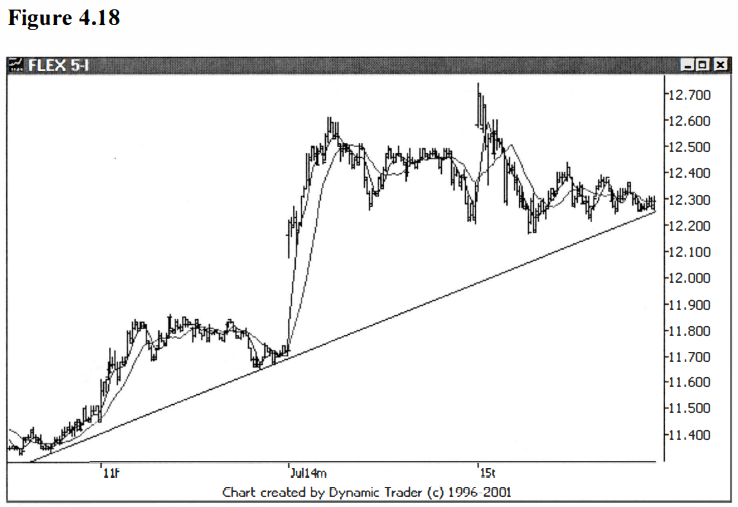
Now that adds the needed perspective. You can
clearly see that FLEX has mostly traded sideways for two full days, and is
approaching the uptrend line. This line is pretty obvious to most traders, and
hence I would expect it is being watched closely. Note, too, that this
trendline has just the two points needed for its construction. It hasn’t been
tested at all. If buyers are going to come in, this is an area I would expect
them to really buy the stock.
If the potential trade area is not to be a
reversal point and FLEX is going to set a new high for the move, this is where
I expect the move up to start. This is what I mean by choosing a trigger
technique and area that has some technical significance. Let’s zoom in on this
area as FLEX touches the trendline for the first time. See figure 4.19.
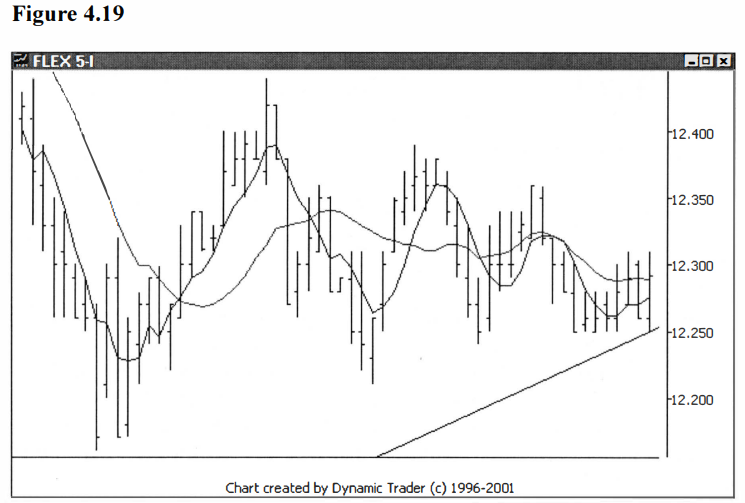
Although this is well after the first moving
average crossover following penetrating the potential trade area, just look at
those repeating crossovers! I would just have no faith in using crossover
triggers with this issue, on this timeframe. Let’s jump two bars ahead and
assess the situation. See figure 4.20.

Wow, look at the price action. You have a big jump up off of the trendline, a quick reversal back down, and a close below the trendline. The trade would now be triggered using the trendline violation technique. But is this really a significant event that just happened, or is happening? When I look at the sideways action on this chart without focusing on the trendline, I would think that nothing has really happened that is of any significance. Let’s move one bar ahead. See figure 4.21.
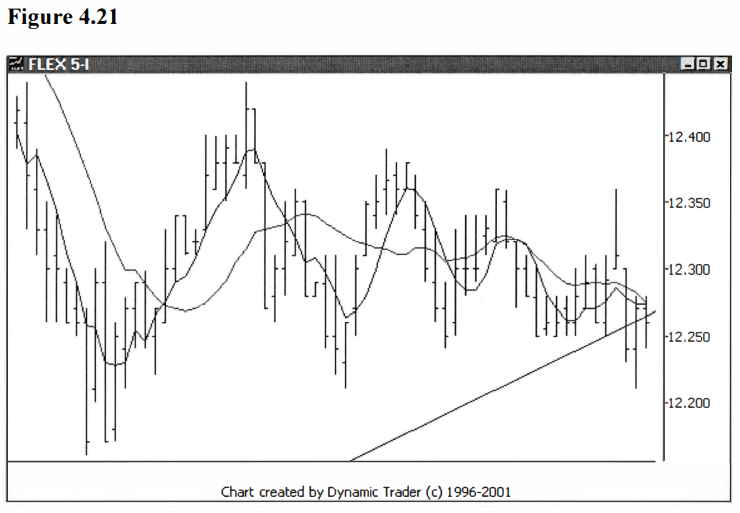
Not much has happened yet. We have an inside
bar with a close lower than the open, and below the trendline. A period of indecision,
which, as you know by now, is common as an important technical area is
approached. I’ve found that most trades that work out ‘play around’ the
technical breakout area before launching. Let’s keep advancing and see how this
one goes. See figure 4.22.
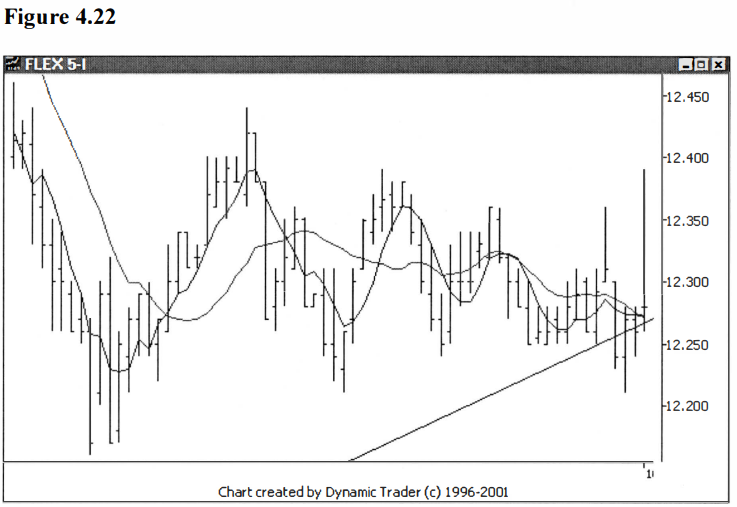
Wow, again. This is one choppy trading stock.
A huge up bar that traded way above the trendline. (This bar is also the
opening bar for the next trading day.) But notice that the bar is a doji
bar that closed on the low end of the bar, and couldn’t hold its gains.
This wouldn’t stop me out since my stop would
be up above (likely just above all the congestion on this chart, or perhaps
above the potential trading area, if I was very confident in the pattern), but
it sure would make my heart jump for a minute. Let’s keep going and move ahead
another bar. See figure 4.23.
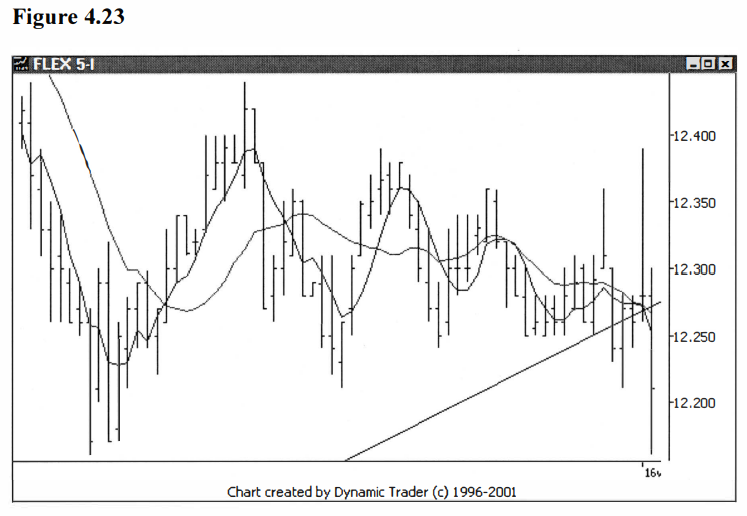
Now that’s more like it. We have a quick
reversal back down, trading to the low of the entire congestion area. Any move
below this low should ‘kick it off’. Let’s move two bars ahead and see what
happens. See figure 4.24.
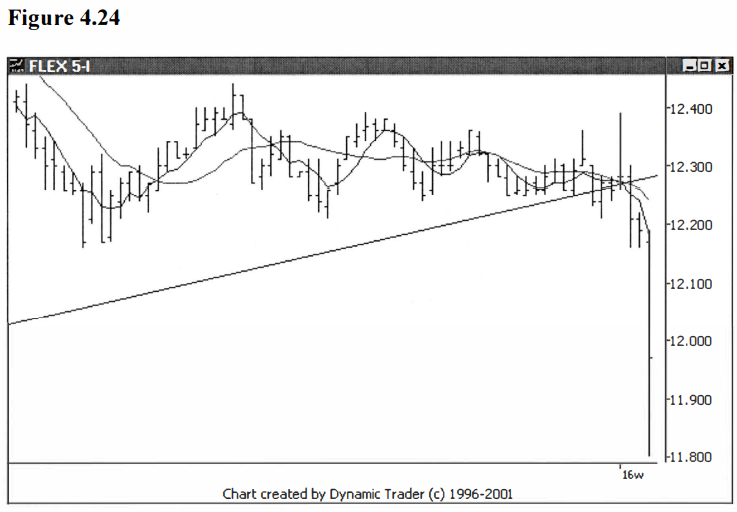
There it is. An inside bar and then the
sellers crush it. Notice how the breakdown in the stock coincides with the
breakdown through this trendline? If buyers had decided to come in at the
trendline, which is a likely place for them to do just that, the moving average
trigger would have been a stop out, but the trendline violation would not have
triggered. That’s the tradeoff. The moving average trigger would have you in
earlier, but it will give you more false starts.
When I see an issue that chops and gaps all
around the moving averages but I still see a trade I like, I lean towards an
entry like this one. On this trade, I liked the potential trade area because it
was not only an Elliot wave pattern, but also another trading pattern I use,
right on top of the same area, with outstanding Fibonacci convergences. Let’s
take one look at how this played out on the traded timeframe, the 15-minute
chart. See figure 4.25.
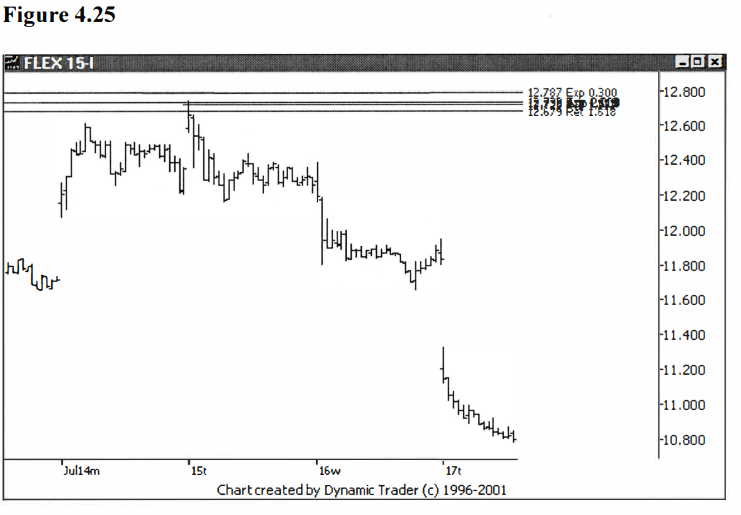
This trade went on to yield plenty of profit
potential after the trigger. It’s amazing to me how a stock that trades as
choppy as FLEX still frequently follows technical patterns so well.
The trendline technique can be a very useful
technique to have in one’s arsenal, but experiment with it and decide if and
when it may help your trading. It’s a technique that I apply when conditions
call for it, but that is not the majority of the time. I consider it a more ‘specialized’ technique.
Best Trading Entry Techniques : Trade Entry Techniques : Tag: Trade Entry Techniques, Forex : trendline trading, Trendline Breakout, Trendline Breakout and Retes, Best trading strategyt - Trendline Violation Technique