Swing Low and Swing High Trading Method
Swing Trading Strategy, Swing Trade, Lower Timeframe trade, Moving average, Crossover Trading Strategy
Course: [ Best Trading Entry Techniques : Trade Entry Techniques ]
I have read do a fine job at coming up with extensive sets of rules to define what is and isn’t a swing point. I’ve also seen a few sources that refer to a simple set of rules, such as a swing-high simply has the bar to the left and right of it with lower high points (reverse for swing-lows).
Swing-High and Low Violations
One of my favorite techniques for entries is
violation of swing-highs and lows. This is a fairly commonly presented
technique, but hopefully the twist I will present, like most of my material,
will be different. In my experience, whenever I have seen entry via a
swing-high or low violation, it has been on the traded timeframe. I’m not
saying that no one has presented these violation techniques any other
timeframes, only that I haven’t seen it in the material I’ve covered.
As the reader should now be familiar with, one
of my main tenets is to decide on your ‘potential
trade area’ on the traded
timeframe, and then to drop down to a lower timeframe to decide on, and
implement, the entry technique. I will continue in that vein in this chapter.
As I just mentioned, this is the main concept that I have not found when I read
the available works. I see a lot of mention about using these swing-high and
low violations, but always on the traded timeframe.
For me, that just doesn’t make sense, for the
same reason it doesn’t make sense with other entry techniques. You are not
taking advantage of a ‘fine- tuned’ entry by going down to a lower timeframe and
taking advantage of the price action in the potential trade area. And on top of
that, you will generally be a lot farther away from a logical protective stop
area if you make the entry decisions based on the traded timeframe. Hence, I
will present this technique, again, in the context of a lower timeframe from
the traded timeframe.
Let me first explain what I mean by a
swing-high or low, and a violation of that swing-high or low. When an issue trends,
it will commonly pullback a bit and then resume the trend. When it does this,
the swing it just formed will create two small turning points, termed swing
points. If the swing point is a high point, it is further term a swing-high,
and conversely, if the point is a low point, it is further termed a swing-low.
I will not get further into defining these
terms here. Many references I have read do a fine job at coming up with
extensive sets of rules to define what is and isn’t a swing point. I’ve also
seen a few sources that refer to a simple set of rules, such as a swing-high simply has the bar to
the left and right of it with lower high points (reverse for swing-lows).
From a practical standpoint, for my own trading, I don’t need to define a swing
point with a set of rules; I simply recognize one when I see it.
When I look at a pullback and attempt to
decide if it's a good swing to consider using in an entry plan, I mostly look
for proportion. I want the swing point to be a certain distance from what I
expect is the major turning point on the traded timeframe. But I also want the
size of the swing to be the right amount. And I want the time factor i.e., how
long before the swing started and how long the swing has lasted, to be in the
right balance.
I expect you are saying ‘I’m fine with all
that, just tell me what all those proportions and guidelines are, and I’ll be
ready to go.’ Unfortunately, you won’t like my answer to that, at least not at
first. My answer is, as I’ve said, I don’t have any rules for that. But the
good news is that I can eye a ‘good’ one in one second flat. And with practice,
you should be able to make a decision by eye, too.
To me, a good analogy would be deciding on
swinging at a baseball pitch. Sure, some are way out of the box and not even
worth discussing. What about the rest of the pitches, though, the ones that may
or may not be good ones? How do you explain and define what you will swing at? Generally,
a batter will tell you he just knows it when he sees it. And I can tell just by
looking which swing-points I will consider for use as an entry technique.
Let’s look at a few swing-points to start, and
then I’ll move on to trying to show what I do and don’t like about certain
swing-points. Once we have the idea of what a ‘good’ swing-point looks
like, I’ll present the entry technique I use, using the swing-point violation.
Take a look at UPS on a daily chart, with what I consider the important swing-highs
and lows labeled on the chart. See figure 6.1.
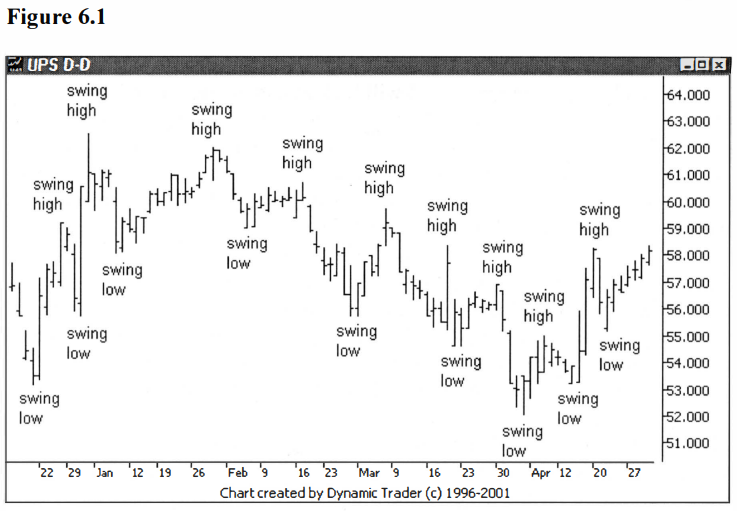
This labeling shows what I consider the
pertinent swing-highs and lows from a trading standpoint. Depending on the
definition used, there could be others. My goal here is to show not only what a
swing-high or low looks like, but to label only those that seem to fit the
timeframe of the chart we are looking at. To my eye, these points jump right
out.
Some of these swing-points may also have a
greater significance on a larger timeframe, pointing out larger timeframe
turning points, but for now we are only concerned with the swings as they
relate to this timeframe. Note how the swings are all very similar to each
other, with none really standing out from any of the others. UPS is trading
with quite a distinct rhythm on this chart, with all the swings being
candidates I would consider for use in potential trade entries. This is not the
norm, though.
Most of the time there will be a lot more
variance in the swings, with many not being of a proportion and character that
I would use for a potential trade entry. The most important thing to remember
is that I will apply this technique just like the others I have presented thus
far. I will find a potential trade area on the timeframe I plan to trade, and
then drop down to a lower timeframe to look for an entry technique.
It is on this lower timeframe that I will look
at and assess the swing-points that I see on the chart. I will be looking for a
swing-point right around the potential trade area that has the proportion and
character that I want. If other swing-points in other areas don’t have the
desired character, I’m not going to be that concerned. As long as the
swing-point that I will use for the actual trigger has what I want, I will
utilize it.
Let’s look at a swing-point on the S&P
e-mini 3-minute chart. The 3-minute chart is my lower timeframe chart in this
case, as I’ve spotted a potential trade area on the larger timeframe 13-minute
chart. I’m looking at the 975 area as a potential trade area for a short trade.
I’m watching to see if a tradable swing-point low forms after I penetrate the
potential trade area.
Since we haven’t yet gotten to the actual
technique, I’ll present the trade with the results on the chart, in one shot. I’ve
outlined the swing-low that I would have used for the trigger. See figure
6.2.
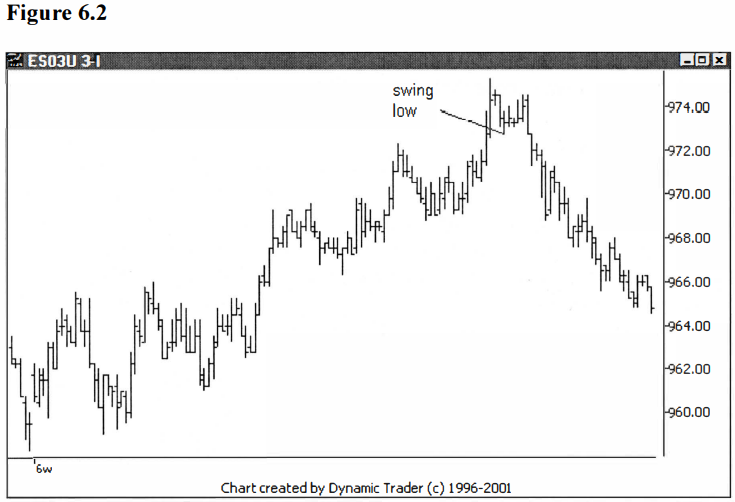
I like this swing-low because it began to form
shortly after the potential trade area was penetrated. It pulled back up
shortly after that, and began to reverse before it reached the previous peak.
This would be a so-called ‘failed test’ of the immediate high of the move. As you can see
from the chart, this was the last swing type move before the mini dropped right
off.
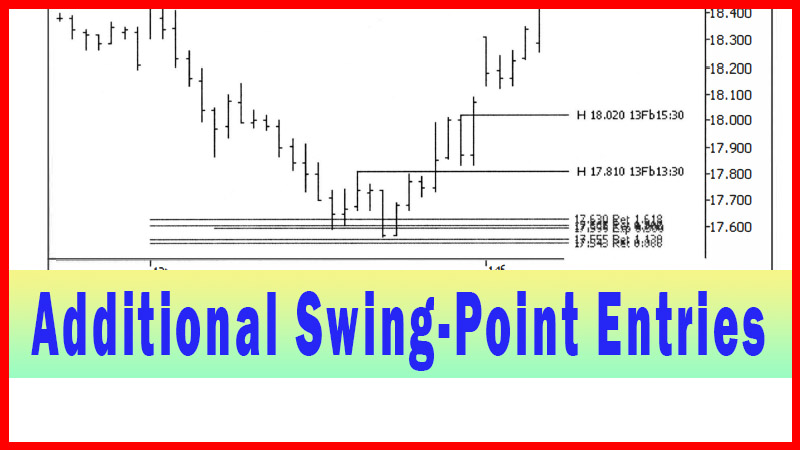
Keep this example in mind, as I will refer
back to it when I explain the actual technique itself, and compare the
technique to some of the ones we have covered so far. At this point, let’s look
at another swing-point in the mini that I consider a tradable swing-point. I
was looking at a potential trade area at 978 on the 13-minute timeframe. I
dialed down to the 3-minute timeframe and was looking for a swing-high point
that could possibly be used for entry. I’ve labeled the chart with the
swing-high that formed right after the mini traded into the potential trade
area. See figure 6.3.
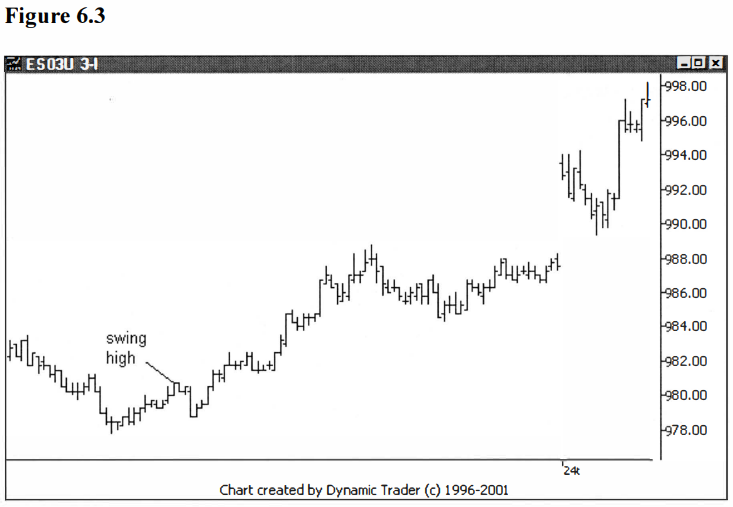
Notice that the proportion and setup of this
swing is very similar to the last example. The main notable difference is in
the time balance between the first impulse
of the uptrend that formed the swing-high, and the pullback to the swing-low.
In the last example it was fairly balanced time-wise, but in this example the
pullback is an approximate 25%-time retracement. Generally, I like the pullback
to be between a 50%o and 100%-time retracement, but if all the other aspects of
the pullback and the formation of the swing-point are acceptable, I wouldn’t
let a 25%-time retracement preclude my taking the trade.
Let’s move on to an example of a swing-point
that I wouldn’t consider. That’s not to say that it couldn’t lead to a great
trade, as it very well might. But I choose my criteria for a reason. One of the
main things I look for when I’m choosing an acceptable swing-point is that it
is still fairly close to the potential trade area. This allows me to set a
protective stop fairly close to my entry point.
Although a trade using a swing-point that is
far away from the potential trade area could still use the area just below that
swing-point as the protective stop area, this is technically not as strong,
since this stop comes from the entry timeframe, not the traded timeframe.
Hence, I prefer to use a swing-point entry that is close to the potential trade
area and a more technically strong protective stop, usually just below the
potential trade area. Let’s look at another example in the mini, again showing
the 3-minute trigger chart. The potential trade area was around 975. See
figure 6.4.
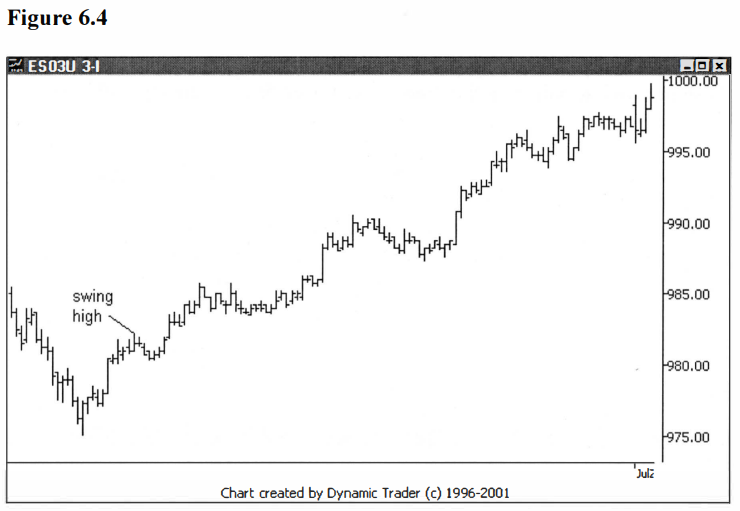
Notice how far above the reversal point this
pullback starts. And notice how shallow the pullback is. Generally speaking, I
am looking for the pullback to start sooner and for the pullback (retracement)
to be at least 50%. This pullback is less than a .382.
And as I mentioned, you could still trade this
swing-high, but logical stop placement would be more difficult. As you can
clearly see, this turned out to be a smoking trade. But if I were looking to
enter using the swing-point technique, 1’d have been left out. Such is trading.
If you stick to your trading plan guidelines, you’ll sometimes miss great
trades.
It’s my opinion that if you try to come up
with a plan that makes sure you never miss any great trades, you’ll probably
not miss those great trades, but the trade-off will likely be an enormously
great deal of losing trades. If your game plan works, don’t fret over missed
trades, it’s part of the business.
I can hear some people saying ‘Hey, what about that smaller swing that formed between
the reversal point in the potential trade area and the swing- high you highlighted?’
In my opinion, that small swing-high would not meet my criteria for a tradable
swing-high. Not only did it not move far enough off the reversal point
(time-wise or point-wise), it didn’t pull back enough either. An acceptable
swing-point would have formed at a point between these two swing-points, and
pulled back at least 50%. It also would have shown a good time balance.
Let’s move on to the actual technique itself.
The trade will be triggered when the issue trades above the swing-high in an
uptrend or the issue trades below the swing-low in a downtrend. This will be a
lot easier to see if we just move on to a chart. Let’s go back to the first
example in this chapter, as shown in figure 6.2. I will back up the chart a bit
in time and show the trade as it unfolds. See figure 6.5.

The mini has traded into the potential trade
area and has formed an adequate swing-low for entry purposes. At this point the
next step is to draw in a horizontal line from the swing-low, going to the
right. Once this line is breached, the trade will be triggered.
As with the other techniques presented so far,
you will have the choice of triggering the trade when the price simply trades
through the trigger line, or waiting to trigger until you get a close after
crossing the trigger line. Unlike the previous techniques where I generally
wait for a close to trigger me into a trade, I usually trigger on this
technique with a simple price cross of the trigger line. Let’s look at the
chart with the trigger line drawn on the chart. See figure 6.6.

The trigger line is at 972.75. Any trade below
972.75 would trigger me into the trade. Since the tick value on the mini is
0.25 point, the trigger price for initiating a trade for me would be 972.50.
Let’s look at the chart, moved ahead one more bar. See figure 6.7.
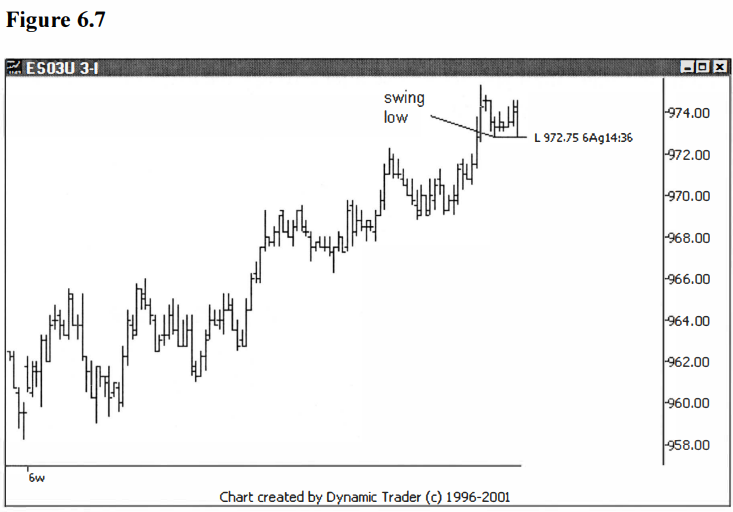
The mini traded right down to the trigger
line, and although it is difficult to see on the chart because of the trigger
line, the last bar closed on the low, right at 972.75. One more tick down is
going to trigger the trade. Let’s move ahead one more bar on the chart. See
figure 6.8.
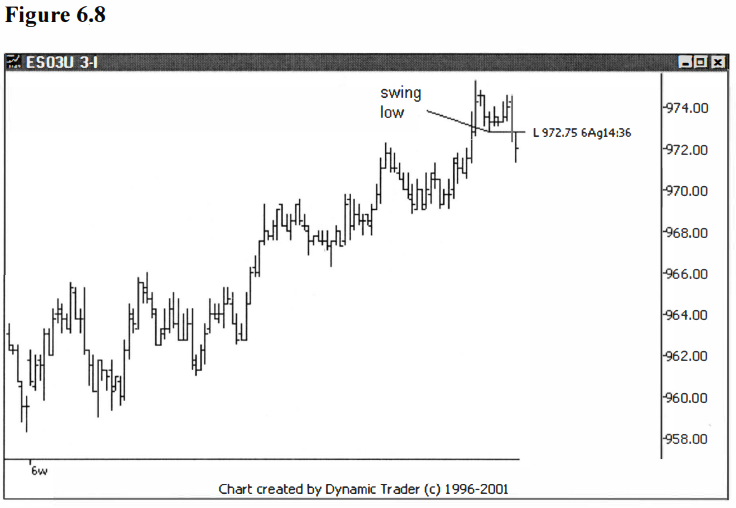
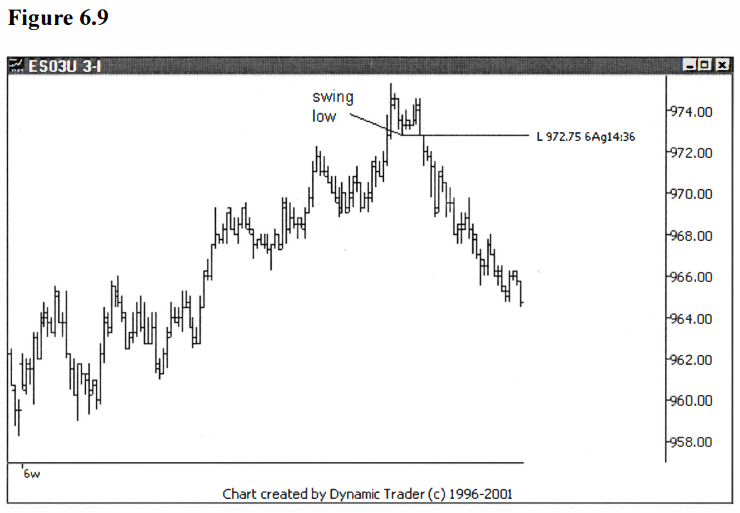
The trade is now triggered at this point,
whether you chose the simple price cross or the price close below the trigger
line. Let’s look, again, at how the mini behaved after the trigger. See
figure 6.9
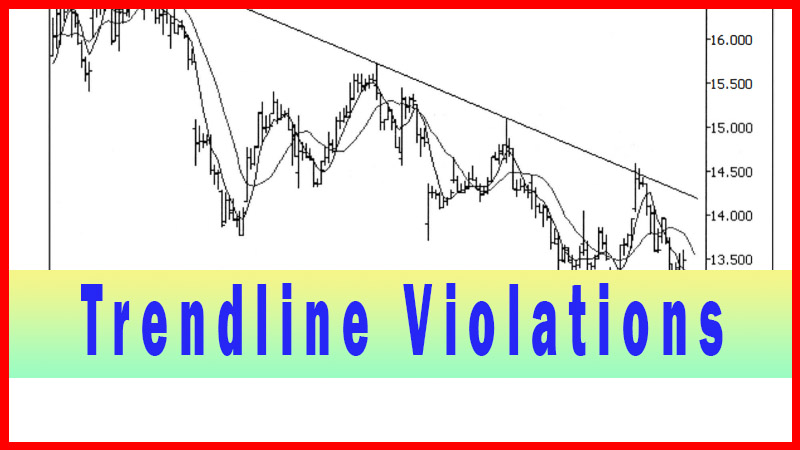
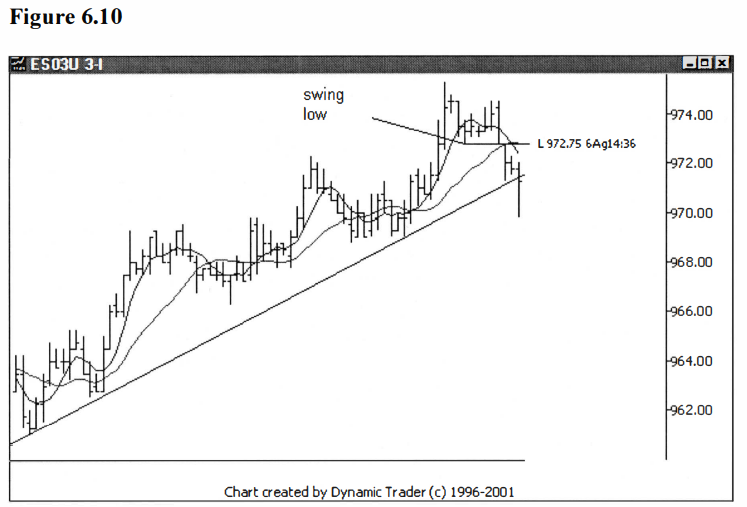
I want to make a quick comparison here with a
trendline trigger and a moving average crossover trigger. I’ll use my favorite
for the moving averages, the 5/15 simple moving
average combination. I’ll put both of these triggers on the chart
with the swing-low entry, for comparison. See figure 6.10.
Now that’s interesting. We are seeing just
about the same thing we’ve been seeing all along. I do believe a pattern is
emerging. All three entries are, indeed, very close. Usually, the 5/15 simple
moving average crossover will trigger first, and then the trendline. One might
expect that the swing-point technique would trigger after both of these
techniques because it is a higher confirmation technique, and one that
generally triggers later.
Sometimes this is the case, but sometimes it
is not. This is due to the fact that the there is some discretion to the choice
of swing-points that are considered for the trade. I prefer a swing that is
close to the potential trade zone, and hence will trigger fairly early in the
move. This means the swing- point entry may not come up and trigger that often,
but can give you a price that is better, the same, or not as good as the other
techniques. It’s not uncommon for me to have my chart set up like figure 6.10,
so I can observe multiple possible triggers at the same time.
So what are the different trigger prices for
the three techniques on chart 6.10? The first trade below the swing-low trigger
line would be at 972.50, and the first closing bar price below that
trigger line is 972.00. The following bar is the trigger bar for the moving
average crossover, and that bar closed at 971.75. The bar that follows after
that is the trigger bar for the trendline
violation technique, and that bar has a closing price of 971.25.
Now, again, I’m not stating that anyone could
or would get filled at those exact prices, but they allow for comparison. And
as you can see, the prices are all within 1.25 points of each other. I think it
is getting clearer that the variation between the techniques is minimal and
that any of them can be adequate for most circumstances. You can do some
fine-tuning to choose the best parameters and the best technique for an
individual trade situation, but don’t get carried away with the time invested
in making your choices, either.
Let’s look at another example, the one from
figure 6.3. I will make this example short by putting all three of the triggers
we looked at in the last example on the chart in one shot here. See figure
6.11.
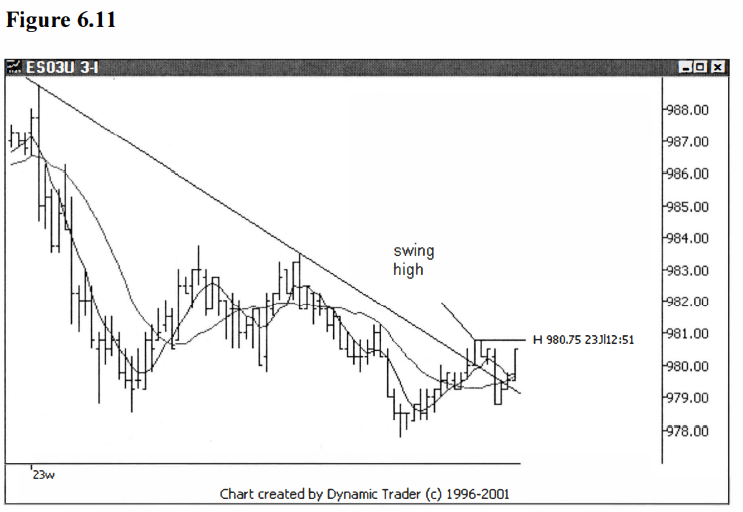
At this point both the moving average
crossover and trendline techniques have triggered, but the swing-high violation
has not. Let’s move one more bar ahead and see if the swing-high triggers. See
figure 6.12.
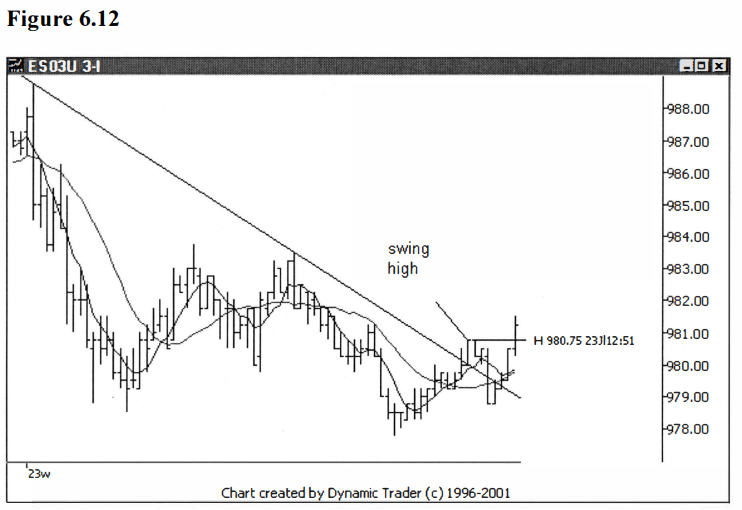
One more bar was all it took to trigger the
swing-high violation trade. On this trade the order of triggering was more what
one might expect, starting with the moving average crossover, then the
trendline violation, followed by the swing-high violation.
Again, for comparative purposes, the moving
average crossover trigger price is 979.50, the trendline violation trigger price
is 980.75, and the swing-high violation would be at 981.00. The price on the
first bar to close above the swing-high trigger line is 981.25. All in all,
these prices are very close, and the price is greater as the greater
confirmation technique is applied, as one might expect.
Before moving on to the next chapter and
technique, I want to point out one interesting observation I see on a regular
basis with respect to this technique. Let’s take another look at UPS, as shown
in figure 6.1. See figure 6.13.

Here’s the same chart as figure 6.1, without
all the swing-point labels. I’m going to add a swing-low trigger line to the
low on February 7 and expand the chart out a bit. See figure 6.14.
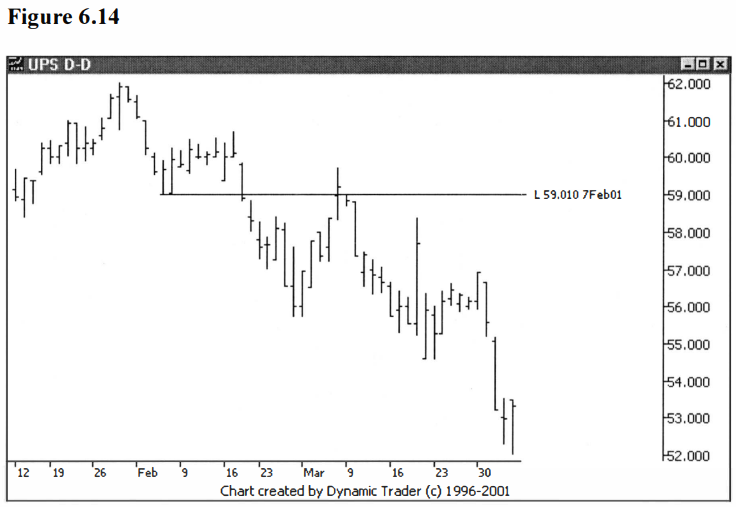
The trade was triggered by violating the
swing-low trigger line, and UPS began to fall off nicely. But then it began to
rebound and went right back up to the trigger line, and even traded above it.
UPS reversed again in this area and resumed the downtrend. I have found it to
be very common for an issue to trade back up to, and even slightly through, the
trigger line. It doesn’t happen all the time, but it sure seems to happen
often.
This can scare a trader out of a good trade if
he or she stays on the trigger timeframe or revises the stop loss very quickly.
I just want to point this out so you can be on the lookout for it. Let’s look
at one more example on this same chart. I’ll leave the swing-low line on the
chart, and add a swing-high trigger that comes up just a little bit later on. See
figure 6.15.
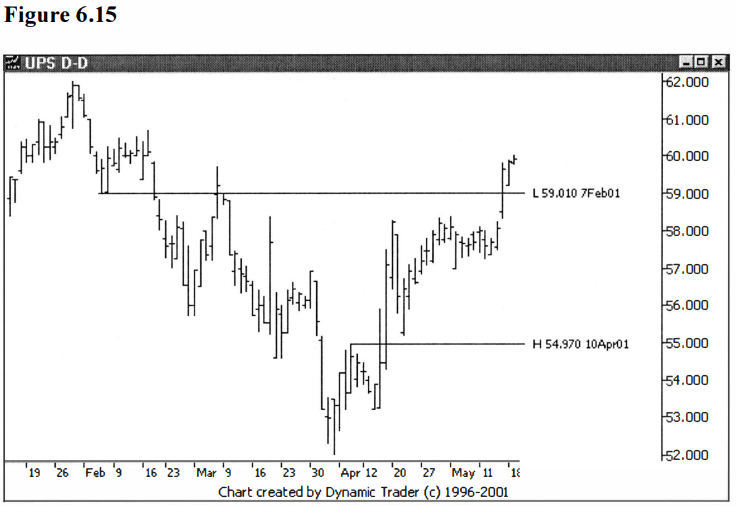
Notice how UPS traded through the swing-high
trigger line and continued up $3.55 before pulling back. And when it pulled
back, it came back almost all the way to the trigger line. Again, it doesn’t
happen every time, but it happens often, so keep a watch out for it.
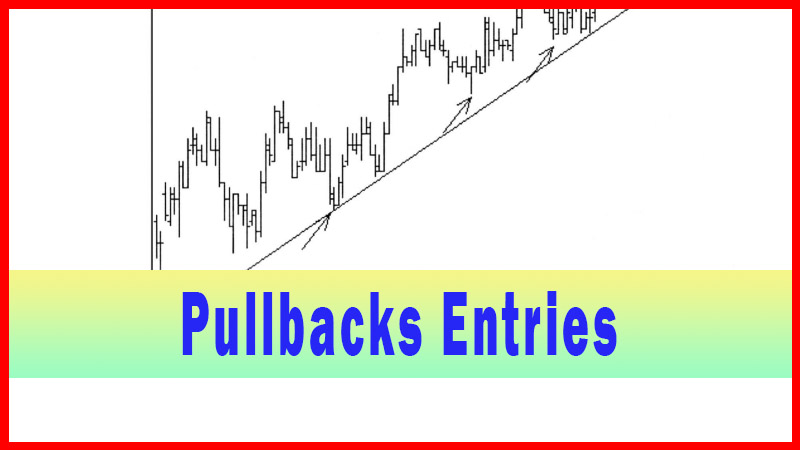
The next chapter is on the pullback technique,
and that doesn’t sound related at all to the current technique. But, in fact,
the way I use it, it is a variation on the swing-point technique. The pullback
technique is a way to anticipate the trigger on the swing-point entry
technique, in order to get a better price. The downside? You’re getting less
confirmation, so you’re more likely to get a false signal.
Best Trading Entry Techniques : Trade Entry Techniques : Tag: Trade Entry Techniques, Forex : Swing Trading Strategy, Swing Trade, Lower Timeframe trade, Moving average, Crossover Trading Strategy - Swing Low and Swing High Trading Method