Using Cycles to Identify Larger Directional Forces
Harmonic Elliott Wave, Expanded Flat, Wave Structures, Bearish structure
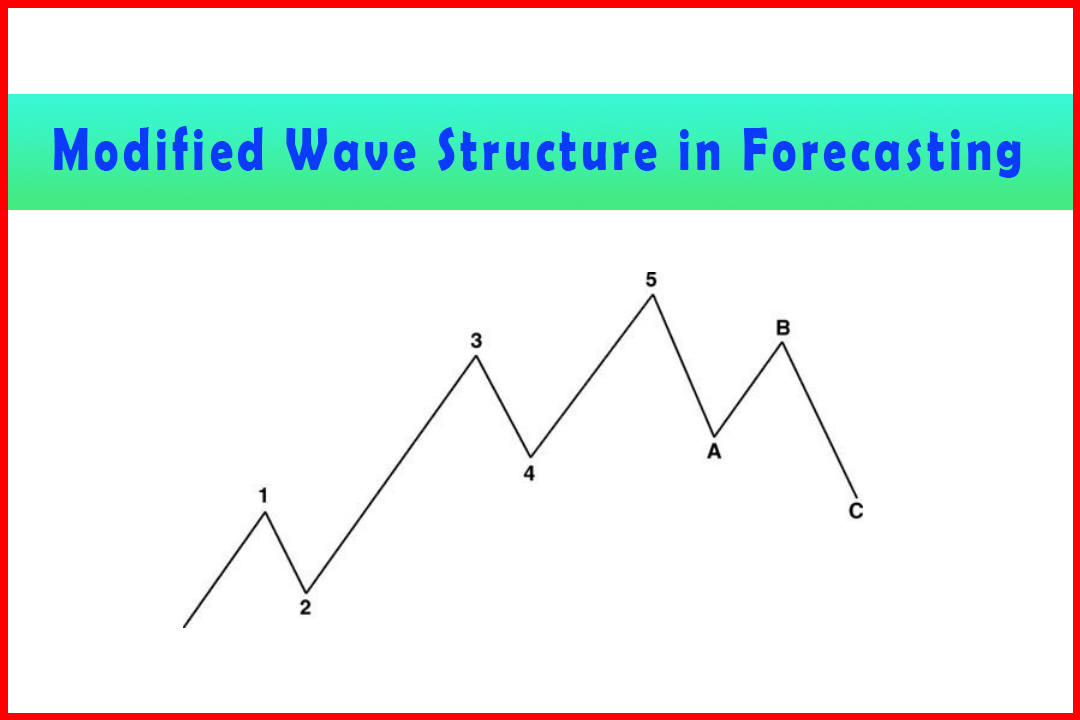
Course: [ Harmonic Elliott Wave : Chapter 5: Modified Wave Structure in Forecasting ]
Elliott Wave | Forex | Fibonacci |
Harmonic Elliott Wave is an amazing tool that provides structure, expectation, and a great deal of accuracy that can be even pin point in the shorter time frames.
Using Cycles to Identify Larger Directional Forces
Harmonic
Elliott Wave is an amazing tool that provides structure, expectation, and a
great deal of accuracy that can be even pin point in the shorter time frames.
However, as with any technique it is not foolproof as patterns and structures
can change as markets evolve.
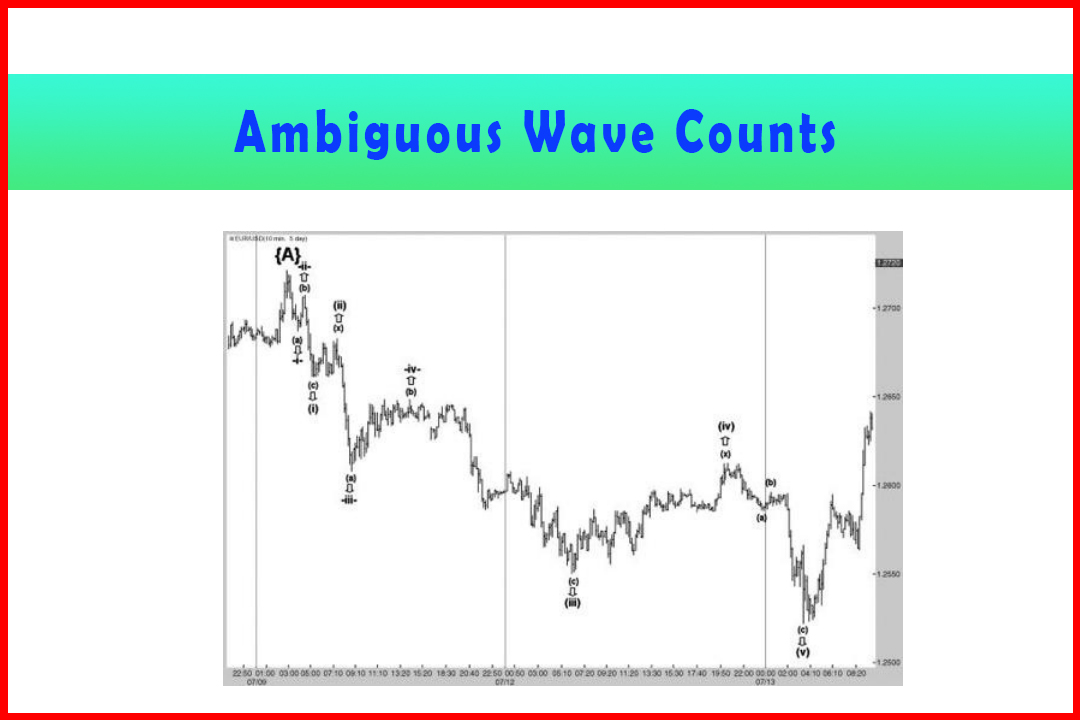
For
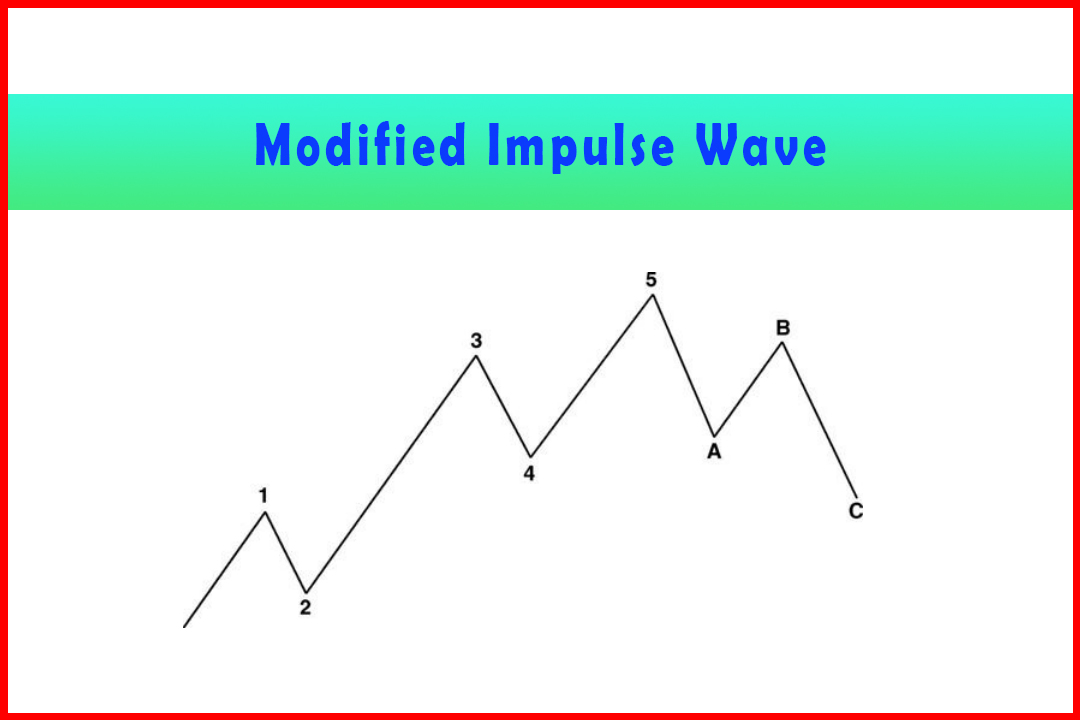
example, Figure 5.18 displays two examples of how assumed wave structures can
change and yet retain the same internal wave development. The top structure
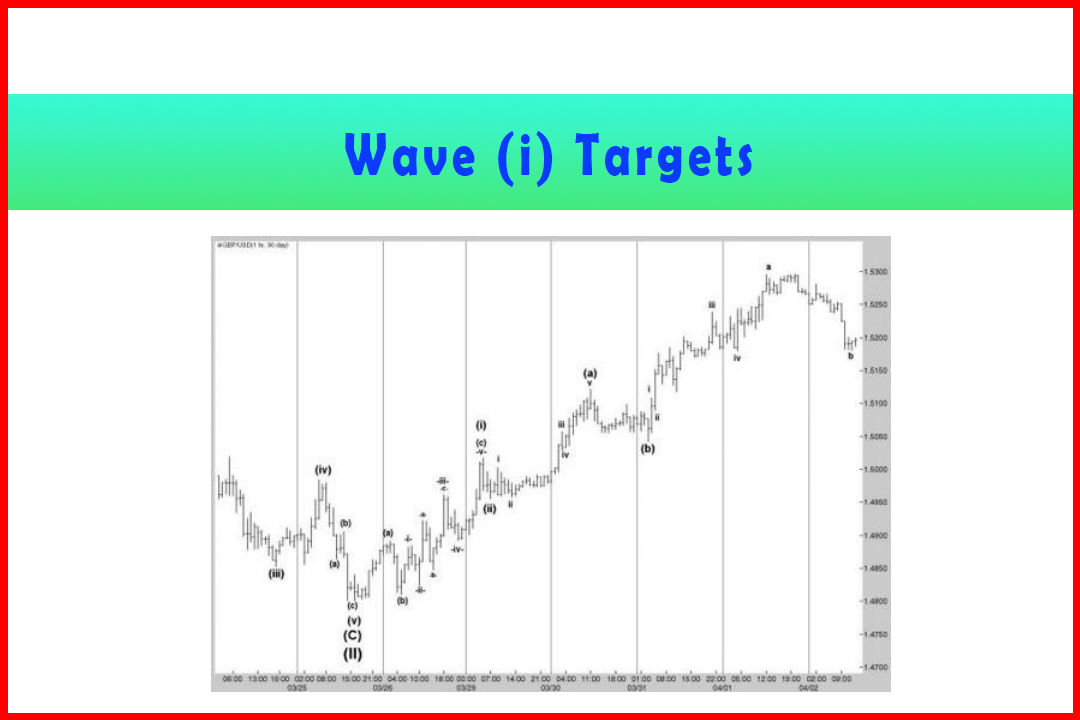
shows an assumed Wave (i), almost 100% retracement in Wave (ii), followed by a
Wave (a) to just above the Wave (i) high that is actually the same wave count
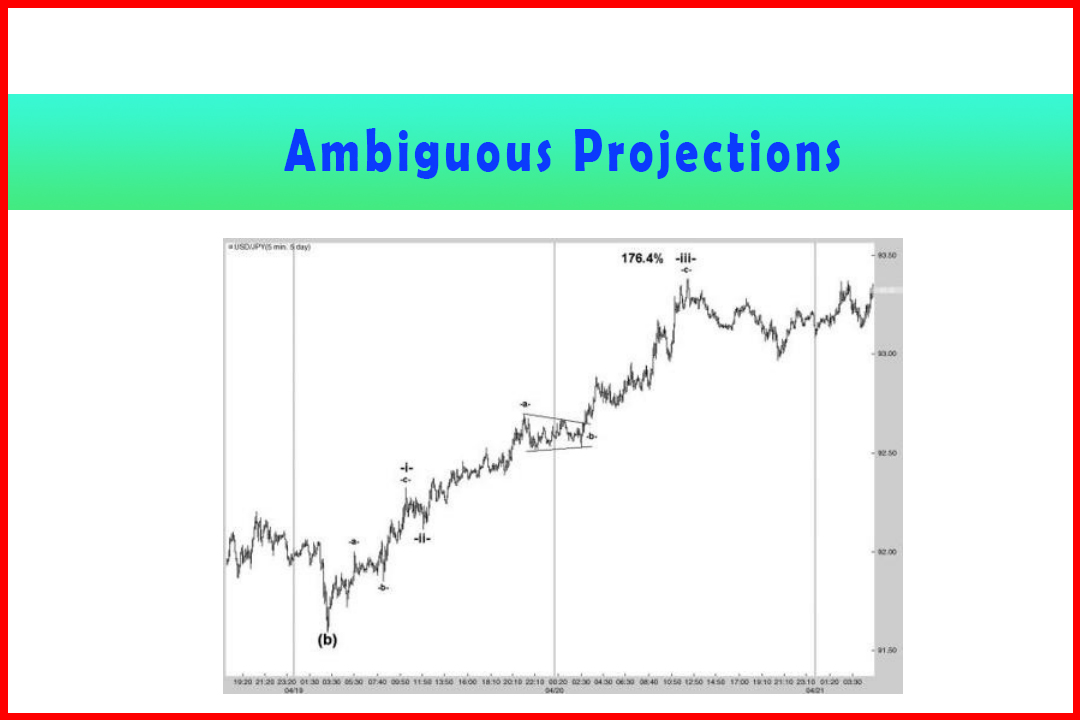
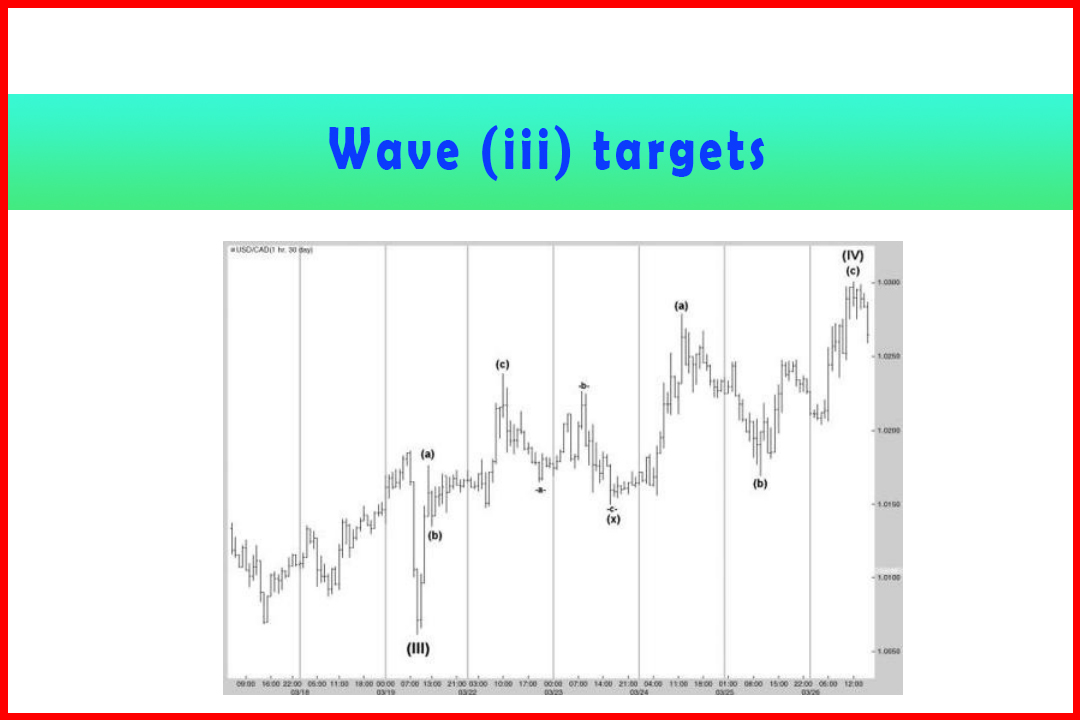
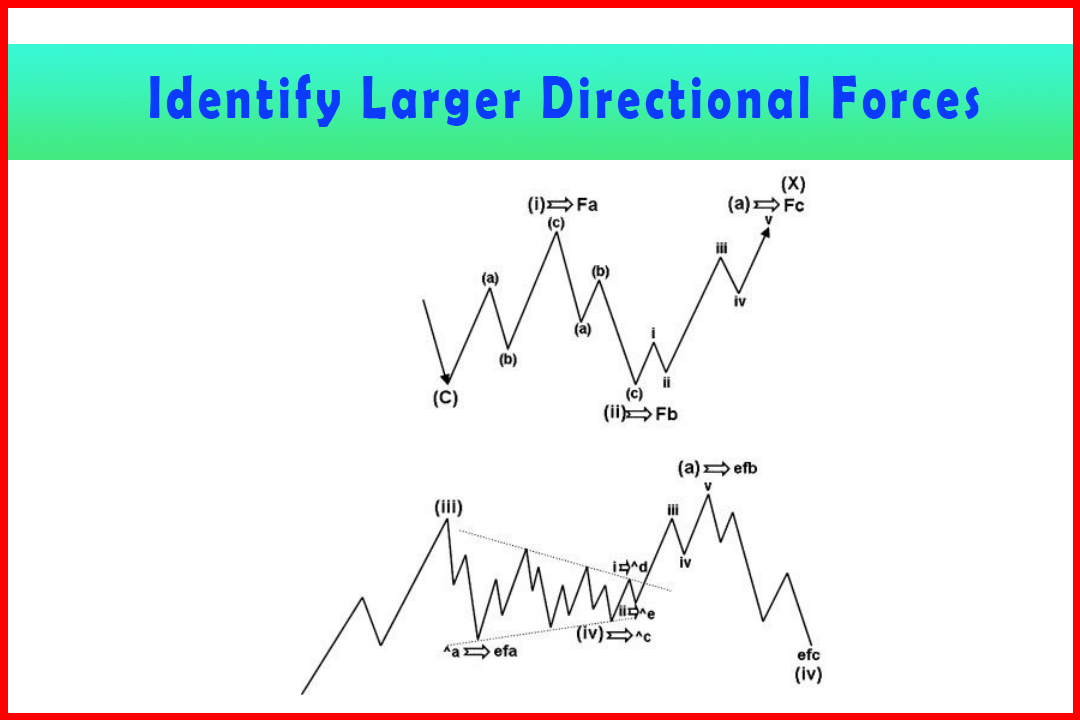
as a Flat correction. The bottom example shows a rally in a Wave (iii) followed
by what looks to be a break out from a Triangle Wave (iv) that could extend
above Wave (iii) and then stall to reverse in an Expanded Flat. This would
imply the rally in what had been assumed to be Wave Ab was actually an abc move
and then the Triangle extends so that what had been Wave i was Wave Ad followed
by Wave Ae where a Wave ii is labeled. This in turn would be counted as Wave
(x) followed by a second abc move (instead of the assumed Wave iii, iv, and v)
to complete a Double Zigzag in Wave efb.
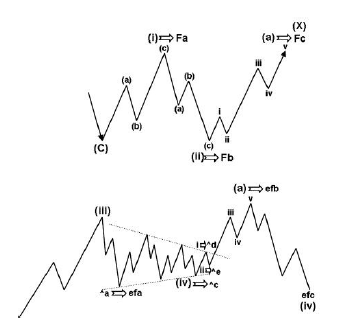
Figure 5.18 Two
Examples of how Assumed Wave Structures can Change
When
these types of situations occur in the shorter time frames such as five
minutes, it can be frustrating; in the hourly charts recipients of the analysis
may shrug their shoulders but when this occurs in the daily or weekly charts
they will wonder how the analysis was so wrong. Of course, full attention
should be given to momentum, but the larger picture application of cyclic tools
is one option to consider.
Over
the 21 years I have been a technical analyst I have met several analysts who
employ cycles. One Japanese trader showed me his Mercury cycles, which forecast
the timing and approximate pattern of how USDJPY would move during the following
three to four months after the 79.70 historic low in April 1995. I have a
subscriber who uses lunar cycles with astonishing accuracy to identify turning
dates. Others use astrology, though most seem to be applying Fibonacci-
calculated turning points.
In
forex, I have found the use of simple fixed cycles provides quite solid
indications on weekly and monthly charts, though daily cycles tend to be a
little less reliable. I do like the cycles to generally correlate across the
major currencies, with only relatively minor variances in the timing of major
reversals.
The
following three charts provide the cycles I have been following for several
years and which all appear to suggest a multi-decade dollar low around the
first half of 2012 approximately. I have not included the Euro since it is such
a new currency pair, and even synthetically generated history is just not long
enough.
Figure
5.19 displays the monthly chart of USDJPY with cycles applied. Note that the
correction from the late 1970s lasted only around one-quarter of the period of
the largest cycle. The same occurred after the 1995 low. This represents quite
significant right translation (that the decline lasts much longer than the
earlier recovery), indicating a bearish market and most probably a new historic
price low. The approximate timing is in the first half of 2012, and this has
caused me to look more for a bearish structure. I suspect the 147.66 high in
August 1988 was a Wave (b) retracement high of a Wave (v) lower. Common targets
for the projection in Wave (v) and in Wave (c) are around 60.00-64.00. This
also matches a target generated from the descending Triangle starting from the
Wave -i-low.
Figure 5.19 Cycles
in the Monthly Chart of USDJPY
Figure
5.20 displays the monthly chart of USDCHF with cycles applied. In this chart
too the strong right translation in the cycles is evident in the corrections
from the Wave (A) low and Wave efb low being less than half of the largest
cycle. This major cycle is also due to find a low around the end of the second
quarter of 2012, to match the same approximate time target of USDJPY. I have
labeled the 1.8300 high in October 2000 as the end of a long Expanded Flat
correction in Wave (iv), and thus the current decline would logically be Wave
(v). Common targets for the Wave (v) and Wave (c) of Wave (v) appear to around
the 0.5000 area.
Figure 5.20 Cycles
in the Monthly Chart of USDCHF

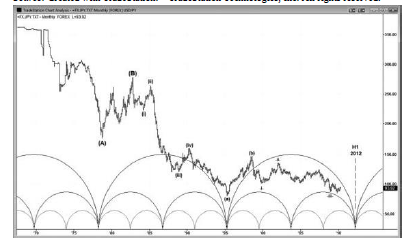
Finally,
Figure 5.21 displays the monthly chart of GBPUSD with cycles attached. Since
GBPUSD is quoted as dollars per pound, the chart is necessarily “reversed”
compared to the other two cycle charts. The wave count is less certain here,
but due to the cyclic implications I feel we may be seeing a large multi-decade
Flat Wave (x) or even an Expanded Flat Wave (x).
Figure 5.21 Cycles
in the Monthly Chart of GBPUSD

The
sharp decline from the 2.1160 high in November 2007 appeared to develop in five
waves and thus suggest this may have been a Wave (a). Therefore we are in the
middle of a Wave (b) correction. Where the current bullish cycle will finally
stall is not yet clear, but from a timing perspective the earliest would appear
to be soon after the smallest cycle begins to turn lower around October 2011
and the latest by the time the middle cycle begins to turn down around July
2013. This does, of course, tend to match the expectations of a major US dollar
low somewhere around the first half of 2012. Note the larger cycle low is not
due until around the middle of 2017.
The
application of fixed time cycles is certainly an approximate guide only, but
can provide the general outlook which can often differentiate between two
conflicting wave counts and, in conjunction with observance of momentum, warn
of a breakdown of a possible wave count being followed in favor of a larger
complex correction. They also help to retain a certain perspective of whether a
general move higher or lower should be anticipated. Additional complementary
tools are always beneficial for comprehensive analysis.
Harmonic Elliott Wave : Chapter 5: Modified Wave Structure in Forecasting : Tag: Elliott Wave, Forex, Fibonacci : Harmonic Elliott Wave, Expanded Flat, Wave Structures, Bearish structure - Using Cycles to Identify Larger Directional Forces
Elliott Wave | Forex | Fibonacci |