Using Momentum to Assist in Identifying Breakdown or Targets
How to use momentum Indicator, Momentum Indicator, Best elliott wave trading strategy
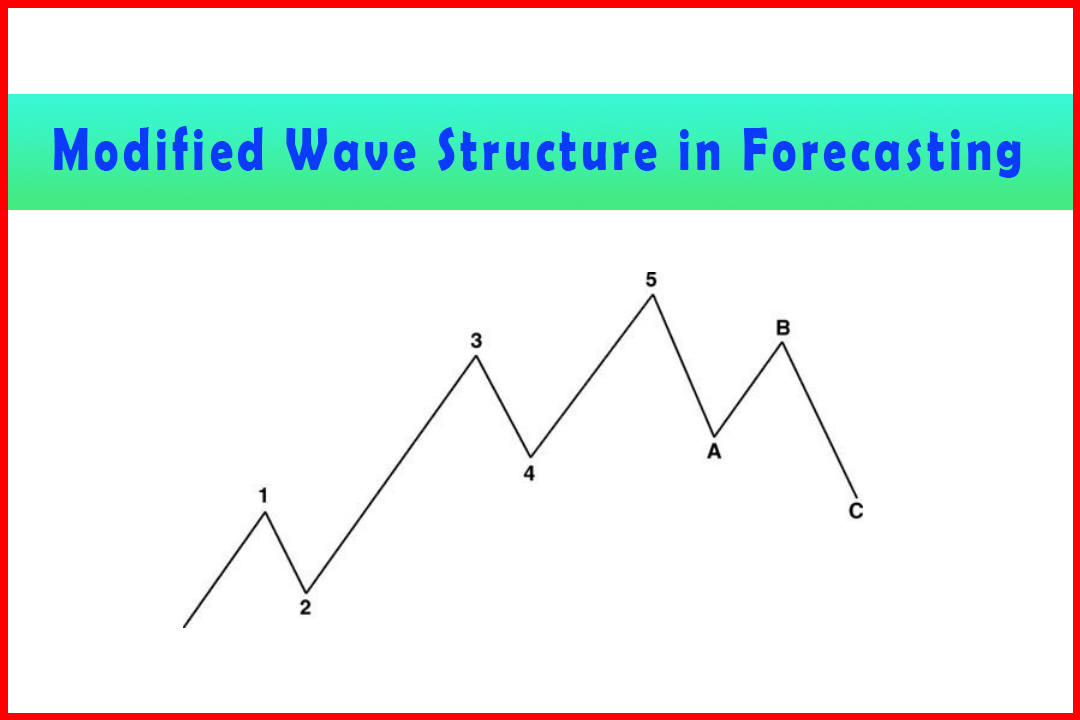
Course: [ Harmonic Elliott Wave : Chapter 5: Modified Wave Structure in Forecasting ]
Elliott Wave | Forex | Fibonacci |
Harmonic Elliott Wave provides a solid base for forecasting, but as I wrote in my first book, Integrated Technical Analysis, the need for complementary analysis is vital to bring strength to forecasting and also a sense of practicality when trading.
Using Momentum to
Assist in Identifying Breakdown or Targets
I
fully believe that Harmonic Elliott Wave provides a solid base for forecasting,
but as I wrote in my first book, Integrated Technical Analysis, the need for
complementary analysis is vital to bring strength to the forecasting and also a
sense of practicality when trading. The production of anticipated projections
and targets can be generated easily but it does rely on the identification of
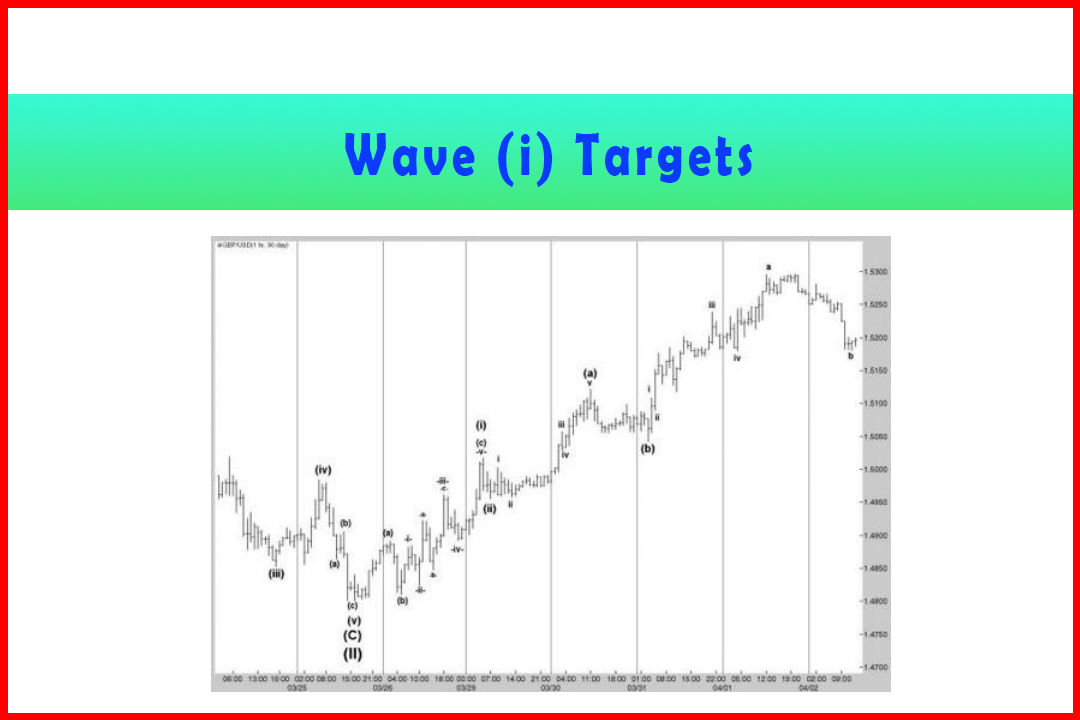
the correct beginning of the wave structure. If Waves (i) and (ii) are not
identified accurately then any projection in Wave (iii) and retracement in Wave
(iv) may be wrong. Thus, blind placing of orders at these levels can cause
losses.
I
find momentum can provide excellent support at these events. I tend to use my
own form of RSI, which is more sensitive, swings between overbought and
oversold more frequently even in trending markets, and provides excellent
divergence indications.
Earlier
in this chapter when discussing the identification of Wave (i) and (ii) I
offered an example of a rally in USDJPY. This described the potential confusion
in recognizing both Wave (a) and Wave (c), which impacts on the identification
of Wave (iii). The following charts offer a method of checks and controls.
Figure
5.14 displays the same chart as in Figure 5.6 earlier in this chapter but this
time with my version of RSI. I have placed labels of Wave (i) and Wave (ii)
where there may have been an error of judgment, along with what became the
correct wave count. I have also labeled where the 176.4% and 285.4% projections
in Wave (iii) would be implied.
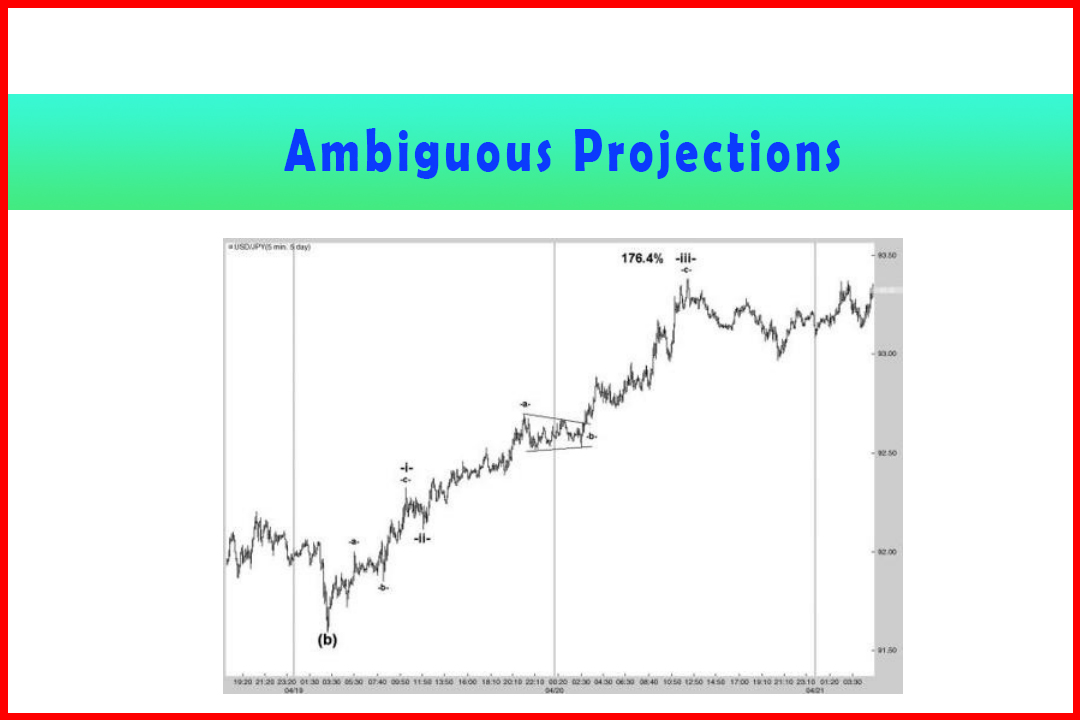
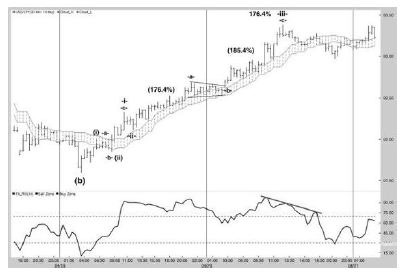
Figure 5.14
Potential Confusion in Identifying Targets in a Rally in Five-Minute USDJPY
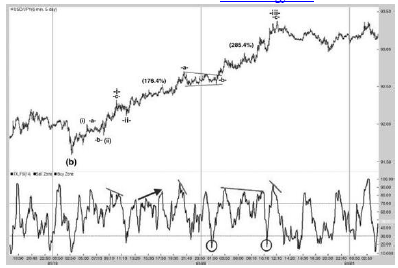
It
can be seen that at the Wave -i-and Wave -a-peaks the five-minute RSI displayed
bearish divergences. This was not true for the peak in Wave (i) nor at the
series of peaks at the 176.4% projection in Wave (iii). In fact, at this
projection area the RSI peaks were rising, which is a sign of strong momentum.
At the 285.4% projection of Wave (iii) there was a mild bearish divergence,
again at the final Wave -iii-peak.
It
can be seen that this version of RSI also allows moves to oversold levels even
in an uptrend. This occurred at Wave -ii-, again at the final low in the Wave
-b-Triangle, and then at the final pullback before the Wave -iii-high.
However,
this is just five-minute momentum, and this can turn within several bars. It is
never wise to base analysis and trades on a single time frame. Therefore it is
preferable to also consider the momentum in a higher time frame.
In
Figure 5.15 I have applied the same version of RSI to the 30-minute chart. It
can be seen that momentum rose right through the Wave (i) that could have been
considered, and all the way to the Wave -i-high before beginning to drift
lower. Thus there was a bearish divergence in the five-minute chart but none in
the 30- minute. It would imply a correction, although we would have no idea at
that point how deep the correction may be. It should also force us to
reconsider the Wave (i) label and at least seek alternatives. This could have
provided us with an earlier opportunity to identify the correct wave count.
Figure 5.15
Confirming Momentum Conditions in 30-Minute USDJPY
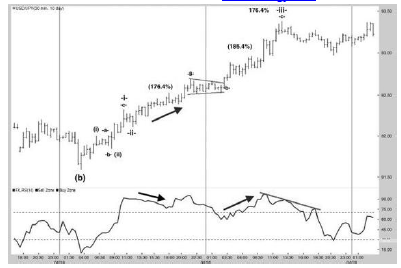
As
the 30-minute RSI began to drift lower, price rose to a new high and stalled
for a few bars. The potential for this to be an Expanded Flat could be
considered. However, in the five-minute chart there was a small abc pullback
before again rising, and at this point the Wave -ii-was confirmed and
projections for Wave - in-generated.
Note
that at the time price approached the 176.4% projection in the original Wave
(iii) while 30-minute RSI was declining, the five-minute RSI was recording new
highs—a bullish factor. Therefore emphasis is on identifying Wave -a-of Wave
-iii-. As noted earlier the five-minute chart recorded a bearish divergence at
the Wave -a-peak. However, the 30-minute chart saw RSI rising again by this
time to a new high—a bullish factor. Thus the risk that we would just see a
correction was high.
The
Triangle price rallied again, forcing five-minute RSI to successive high levels
while 30-minute RSI rose back to new highs for a third time. This was occurring
around the 185.4% projection in Wave (iii), so once again there was no
indication from momentum that the rally was due to end. However, by the time
price reached the 176.4% projection in Wave -iii-both time frames recorded
bearish divergences. This provides a much stronger basis for a trade.
Thus,
the use of a good momentum tool to confirm projection levels and avoid trades
at inappropriate targets is a vital addition to the armory. It need not just
end with momentum; the addition of a favored indicator that provides support or
resistance can also be useful. Figure 5.16 displays the same 30-minute chart
with an Equilibrium Cloud that I designed to identify market equilibrium.
Figure 5.16
Confirming Momentum Conditions in 30-minute USDJPY
The
Equilibrium Cloud provides a reliable area of support or resistance in directional
moves. Note how this supported almost the entire rally once price had reversed
above the Cloud.
Most
traders and analysts have favored tools. As long as these are complementary and
not providing the same information (such as applying RSI, Stochastics, and
MACD), the quality of the analysis is enhanced and provides more confidence in
the wave structure. In addition to confirming a wave count, indicators can
forewarn of a breakdown in the anticipated structure.
Figure
5.17 provides an example of how a wave count may break down an anticipated
bullish rally in Wave (C). It is impossible to identify the correct wave
structure 100% of the time. We all make errors of judgment and sometimes wave
structures can morph into more complex corrections.
Figure 5.17 Using
Indicators to Forewarn of a Breakdown in a Bullish Wave Count

In
this example, it is assumed that the first high marks the completion of a Wave
(A) where momentum displayed a bearish divergence. In the pullback the analyst
feels that it developed in three waves and, due to other factors, feels there
is more risk of Wave (C) developing to new highs directly.
Price
rallies to stall just below the Wave (A) high, and being bullish the analyst
labels this as Wave (i) and the correction as Wave (ii). However, the
subsequent follow-through fails, with a second bearish divergence having
developed. This could be due to a possible Expanded Flat in Wave (ii), but the
clean break lower through the anticipated Wave (ii) low with price also
reversing below the Equilibrium Cloud extends the decline to a wave equality
target.
Thus
the alternative is for the first correction to be labeled Wave (a), the
corrective peak as Wave (b), and the new corrective low as Wave (c) to complete
Wave (B).
Use
of momentum can assist in providing warning signals. It is possible to remain
bullish believing that price will rally to break the bearish divergence.
However, the signal is there to keep as a warning that if price
doesn't rally a second decline can be expected in a possible Flat
correction.
Similar
movements can occur with Expanded Flat corrections as price pushes to a new
high but then fails amid a bearish divergence. While these occurrences are
frustrating, the important point to remember is that once the preferred count
is proven incorrect there is often an immediate alternative. In this case the
breakdown automatically signals a Flat correction and a new target identified.
Harmonic Elliott Wave : Chapter 5: Modified Wave Structure in Forecasting : Tag: Elliott Wave, Forex, Fibonacci : How to use momentum Indicator, Momentum Indicator, Best elliott wave trading strategy - Using Momentum to Assist in Identifying Breakdown or Targets
Elliott Wave | Forex | Fibonacci |