Wave (iii) targets
Elliott wave targets, Third wave targets, Best Trading Strategy, Best Pattern Trading
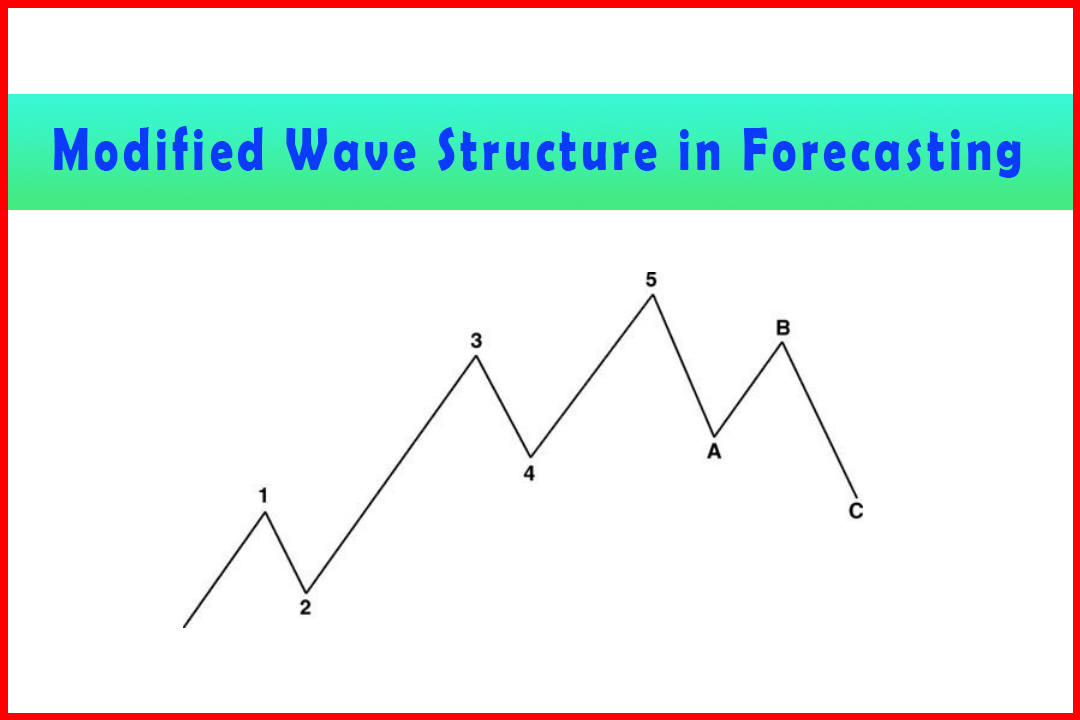
Course: [ Harmonic Elliott Wave : Chapter 5: Modified Wave Structure in Forecasting ]
Elliott Wave | Forex | Fibonacci |
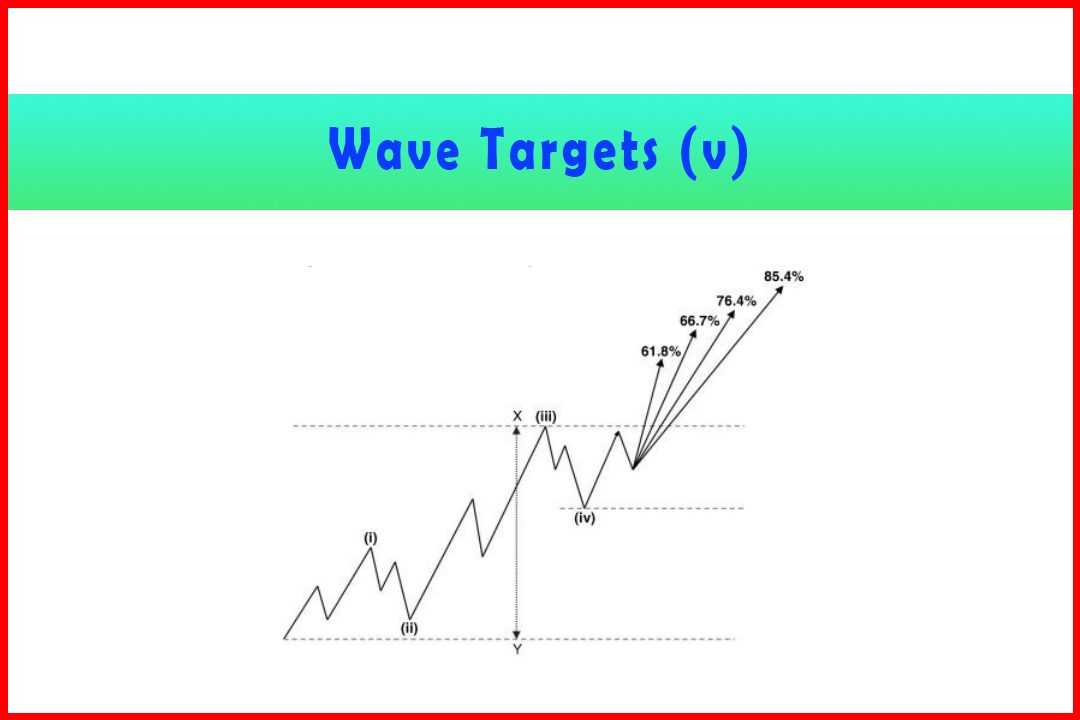
Once Wave (i) and Wave (ii) have been established the immediate task is to identify where Wave (iii) will probably end. After all, there are multiple projections that could occur.
Wave (iii) targets
Once
Wave (i) and Wave (ii) have been established the immediate task is to identify
where Wave (iii) will probably end. After all, there are multiple projections
that could occur. Most common are 176.4%, 185.4%, 223.6% and in stronger moves
276.4% and 285.4%.
There
are several elements to this, and I shall cover each in turn.
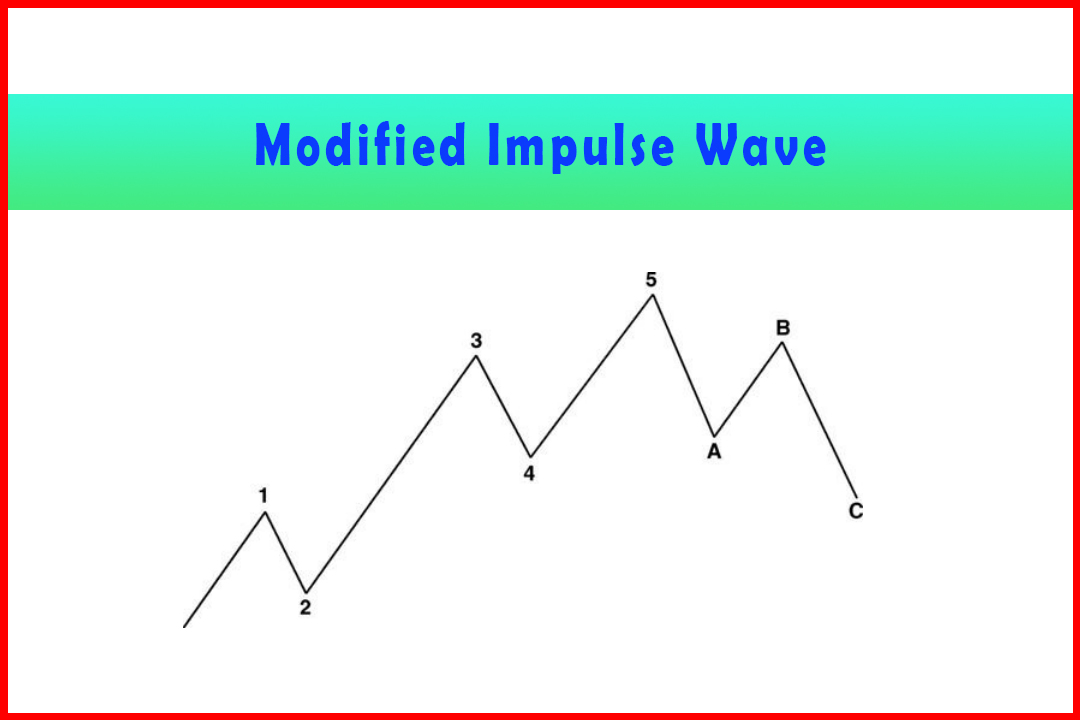
The Wave Structure of One Higher Degree
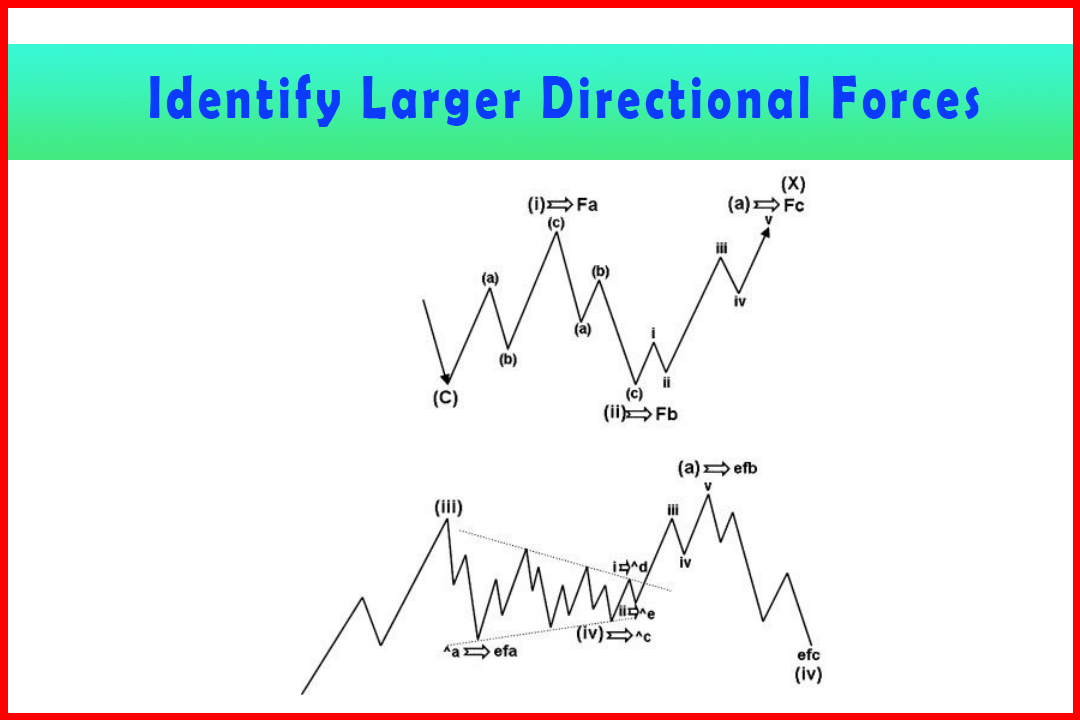
A Wave (iii) only occurs in two waves: Wave (A)
or Wave (C).
The positions of Waves (A) and Wave (C) generate
different implications and may occur within:
- Wave (i), Wave (iii), Wave (v);
- a Zigzag, Double Zigzag, or Triple Three;
- a Triangle.
Wave
(A) will always follow Wave (C). Wave (C) will always end in a Wave (v).
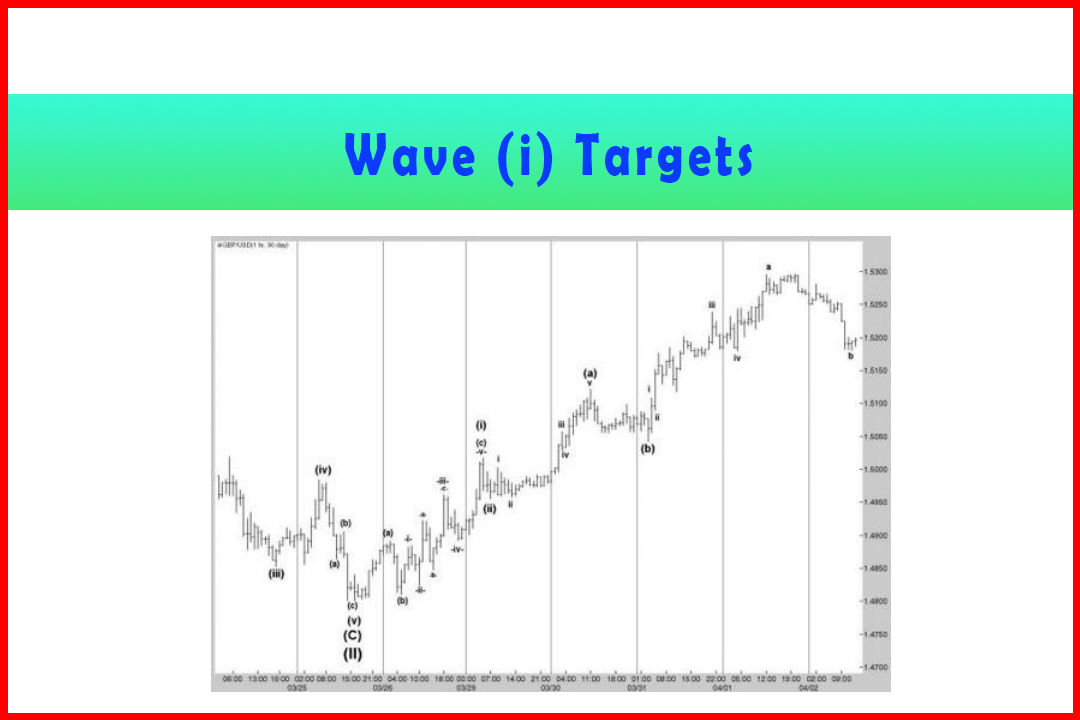
Wave iii of Wave (a) in Larger Wave (i)
A
common initial target following the completion of a Wave (v) will be the Wave
(b) of Wave (v). This may be the new Wave i, Wave iii, or indeed the full Wave
(a). The target for Wave iii should therefore be considered within this
structure.
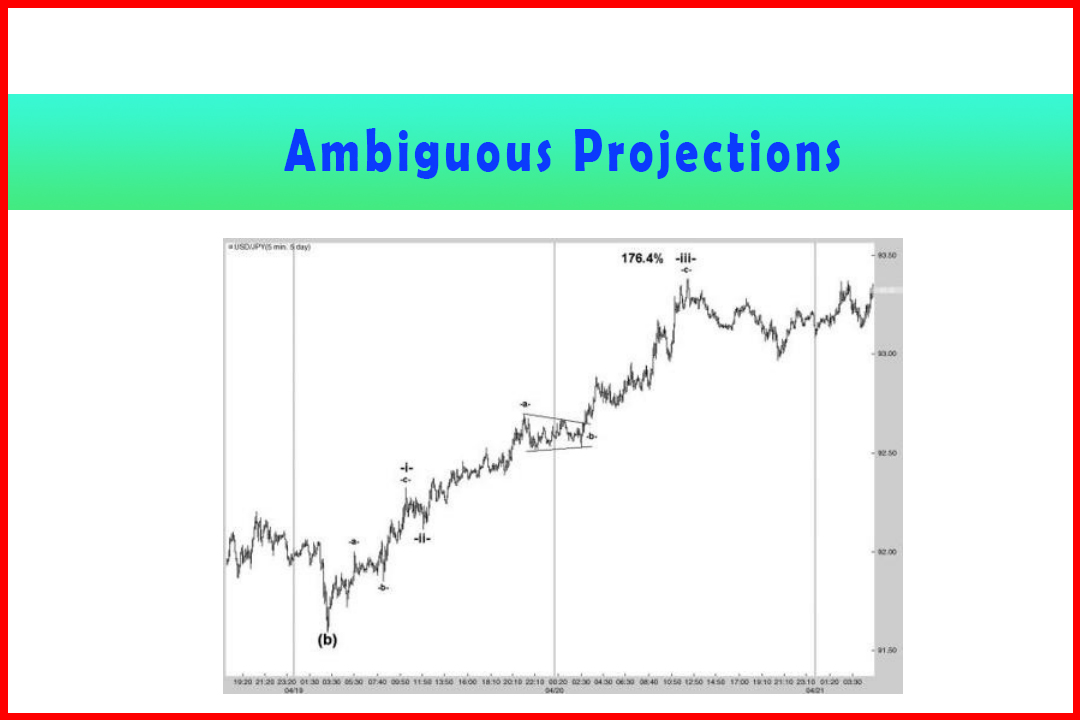
Wave (iii) of Wave (a) of Wave (III)
There
is no universal guideline for this and it will depend on exactly what is
happening in the larger wave degree. The more important guide will be the expectation
of where Wave (A) is to end, which in turn will provide an idea of where the
Wave (a) of Wave (III) will need to complete to be within striking distance for
Wave (v) to reach the target.
In
Figure 5.8, I will show an example of how this may be achieved.
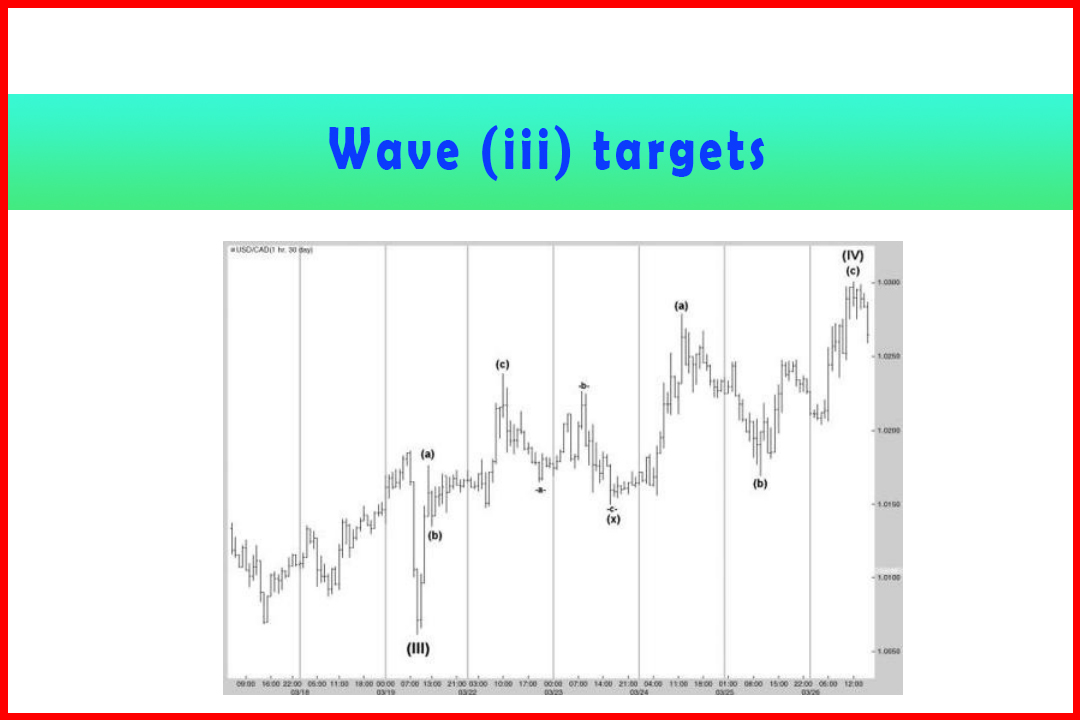
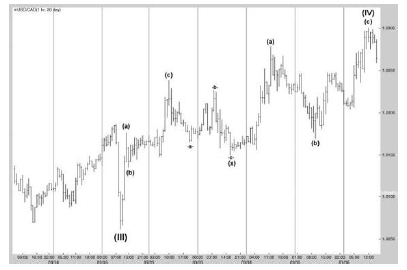
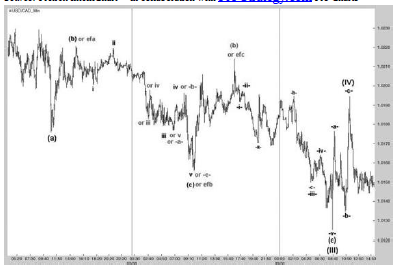
Figure 5.8 Wave
(IV) Correction in Hourly USDCAD
In
Chapter 3 I provided an example of a deep Wave -b-of Wave -iii-within a Wave
(c) higher in USDCAD. This was within a Wave (IV) of one higher degree. In
Chapter 4 I demonstrated the amazing accuracy and synchronicity of the final
(a)(b)(c) waves.
The
first problem to be considered is whether this actually completed Wave (IV).
The recovery from 1.0062 developed in a Double Zigzag. If this represented a
full 50% or perhaps 58.6% retracement in Wave (IV) then it would be a clearer
implication that the 1.0301 high was indeed Wave (IV). In this instance the 50%
retracement was at 1.0317. This was also around where two prior corrective
highs were situated in the Wave (c) of Wave (III) decline. The Wave (II)
retracement was 41.4%.
Therefore,
this case was not a clear-cut certainty that a third ABC structure would not
occur. A move below the prior Wave (b) at 1.0169 would assist that view, and
also below the prior Wave (x) at 1.0150 being another key swing low. The market
tends to avoid breaking key swing highs/lows on the first test and therefore
some reactions should be expected. The guideline of a reaction from the prior
Wave (b) would also be a factor. Therefore the approach to this general area
will need to be observed in order to assess whether the decline was developing
in line with what should be a Wave (A) of Wave (V) if this was to confirm
whether the Wave (V) would develop rather than a Wave (x) and followed by a
third ABC rally.
If
this is the start of a Wave (V) then normally Wave (A) will stall somewhere in
the region of the Wave (III) low. This would provide a general idea where Wave
(iii) of Wave (A) needs to fall to allow Wave (v) to reach the area around the
Wave (III) low.
Figure
5.9 displays how the first decline develops. The chart displays the final Wave
-c-of Wave -iii-from the deep Wave -b-, followed by the three-wave rally in
Wave -v-. In either a Wave (x) correction that would lead to a new ABC
structure higher in Wave (IV) or a five-wave decline in Wave (A), the first
development must be an ABC move.
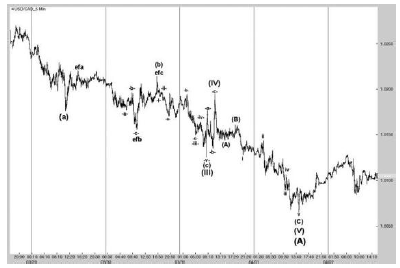
Figure 5.9
Initial Decline from the 1.0301 Peak in Five-Minute USDCAD
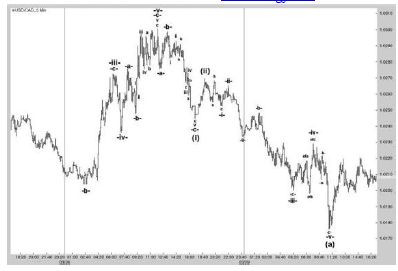
As
should be expected, the initial decline in Wave -a-reached the area of the
prior Wave iv and Wave b of Wave v. Identifying the five waves in Wave -a- (and
therefore the Wave iii) in a five-minute chart is normally impossible. Wave
-b-then followed, and then five waves in Wave -c-to reach the prior Wave -b-of
Wave -v-higher and just below but holding above the prior Wave -iv-. Wave -c-
was just over 223.6% of Wave -a-. This was at 1.0245.
At
this point there is no way of knowing precisely whether this decline formed
Wave (I) of Wave (A) or whether it was a pullback in Wave (x), or perhaps just
one ABC decline within a Wave (x). The recovery from the 1.0245 Wave -c-low
ended between the 41.4% and 50% retracement at 1.0270 and between the prior
Wave b of Wave v and the peak of Wave iv.
The
next move should define the structure of the decline. For this to be a Wave (x)
the next three-wave decline must see the Wave C below the 1.0245 low unless it
was to turn into a complex correction in Wave (x).
If
this was to be Wave (a) of Wave (III) then the next move should be five waves
lower in Wave (a). It should also test the prior Wave (b) at 1.0169 and
possibly the 1.0150 prior Wave (x). This would enable a retracement in Wave (b)
and extension in Wave (c) of Wave (III) to reach closer to the prior higher
degree Wave (III) low at 1.0062. To identify where Wave -iii-should stall the projections
for Wave -iii-should be observed in conjunction with those of Wave -c- (once
Wave -b-had been completed).
Wave
-c-projections:
85.4%
= 1.0222
100.0%
= 1.0217
114.6%
= 1.0212
123.6%
= 1.0210
138.2% = 1.0205
161.8%
= 1.0198
Wave
-iii-projections:
176.4%
= 1.0235
185.4%
= 1.0233
223.6%
= 1.0227
261.8%
= 1.0220
285.4%
= 1.0216
423.6%
= 1.0193
From
these we could consider a potential target around 1.0216-20.
In
fact, what transpired was Wave -in-measuring a rather unusual 376.4% projection
of Wave -i-and Wave -c-of Wave -iii-being 161.8% of Wave -a- reaching 1.0200.
This begins to highlight the issue of also identifying the individual wave
structure of Wave -c-.
Wave
-iv-was then two points above a 41.4% retracement of Wave -iii-and Wave -v-was
precisely 76.4% at 1.0176. This was perfect in terms of the retest of the prior
Wave (b) in Wave (IV) higher. Thus this could now be confirmed as a developing
Wave (A) lower, and the next step was to identify a correction in Wave (b) and
then extension in Wave (c) to complete Wave (III).
The
next step would be to identify an approximate target for Wave (III) from where
a Wave (IV) retracement would develop and provide somewhere between a 61.8% and
76.4% (or possibly an extended wave of 85.4%) to reach close to the 1.0062 low.
Wave
(III) projections:
176.4%
= 1.0171
185.4%
= 1.0166
223.6%
= 1.0145
261.8%
= 1.0123
285.4%
= 1.0110
Since
Wave (a) had reached 1.0176, the first two projections can be ruled out. The
223.6% projection at 1.0145 may well be possible, as well as the 261.8%
projection at 1.0123. The 285.4% is rather deep but shouldn't really
be ruled out.
Next
the retracements in Wave (b) can be derived:
38.2%
= 1.0212
41.4%
= 1.0215
50.0%
= 1.0223
58.6%
= 1.0231
Note
should be taken of the prior Wave -b-of Wave -v-and also the Wave -iv-. These
were at 1.0229 and 1.0222. This would lead to the favored retracement being
between 1.0212 and 1.0223.
The
recovery from 1.0176 reached 1.0221 and thus two points below the 50.0%
retracement (see Figure 5.10). Compared to the decline in Wave (a) it was quite
brief, but the likelihood is that it would be considered as Wave (b).
Figure 5.10 Wave (c) Decline in Wave (III) in Five-Minute USDCAD
From
that peak the wave development became more uncertain. I have marked a five-wave
decline which did hold quite good relationship ratios. However, the low was at
1.0156 and above the prior swing low at the 1.0150 Wave (x). This does not
satisfy a Wave (III) target.
The
possibility of these being a mistake in the bearish wave count should be
considered, although the breach of the prior Wave (b) is normally (but not
always) a sign that there has been a reversal.
On
a closer look there was a secondary wave count that implied a three-wave
decline with the alternative Wave -c-being 85.4% of Wave -a-. It is also
therefore possible that this is an Expanded Flat. If so, the 1.0156 low should
represent an expansion of the alternative Wave efa. Indeed, this was a 41.4%
expansion which would imply a five-wave rally in Wave efc to around the Wave
efa high. This occurred with the Wave efc stalling at 1.0214, and this would
then be counted as Wave (b).
A
target in Wave (c) could then be calculated:
85.4%
= 1.0134
100.0%
= 1.0120
114.6%
= 1.0106
Matching
with the projections anticipated in Wave (III) between 1.0212¬1.0223, it would
appear that Wave (c) would also likely stall in the same area. The five waves
lower developed with normal ratios to reach 1.0125.
Wave
(IV) developed with an almost 50% retracement to 1.0195.
Finally,
this allowed targets for Wave (V):
61.8%
= 1.0086
66.7%
= 1.0078
76.4%
= 1.0061
The
Wave (III) low of one higher degree was at 1.0062 and the Wave (V) to complete
Wave (A) completed at 1.0065 (see Figure 5.11).
Figure 5.11 Wave (V) Decline in Wave (A) in Five-Minute USDCAD
This
walk-through demonstrates the technique of estimating the Wave (iii) targets,
both internally from the Wave (c) target within Wave (iii), and also as a
projection of Wave (i) and a general expectation of where a Wave (iii) should
fall if the target in the Wave (A) or Wave (C) is to be achieved.
This process provides several
factors in bringing confidence to the expected wave count or whether it begins
to break down:
- A move will always be expected in either five waves or three waves, dependent on the location within the larger wave count.
- The early stages can be linked to the prior Wave (b) and/or Wave -b-of Wave -iv-of the preceding move. Estimates can be made for the general area where Wave (iii) should be expected to end.
- If a five-wave move is anticipated then there should be valid relationships between them. If not, then an alternative structure may be developing.
- Relationships between Wave (i), Wave (iii), and Wave (v) need be confirmed by projections of the internal Wave abc.
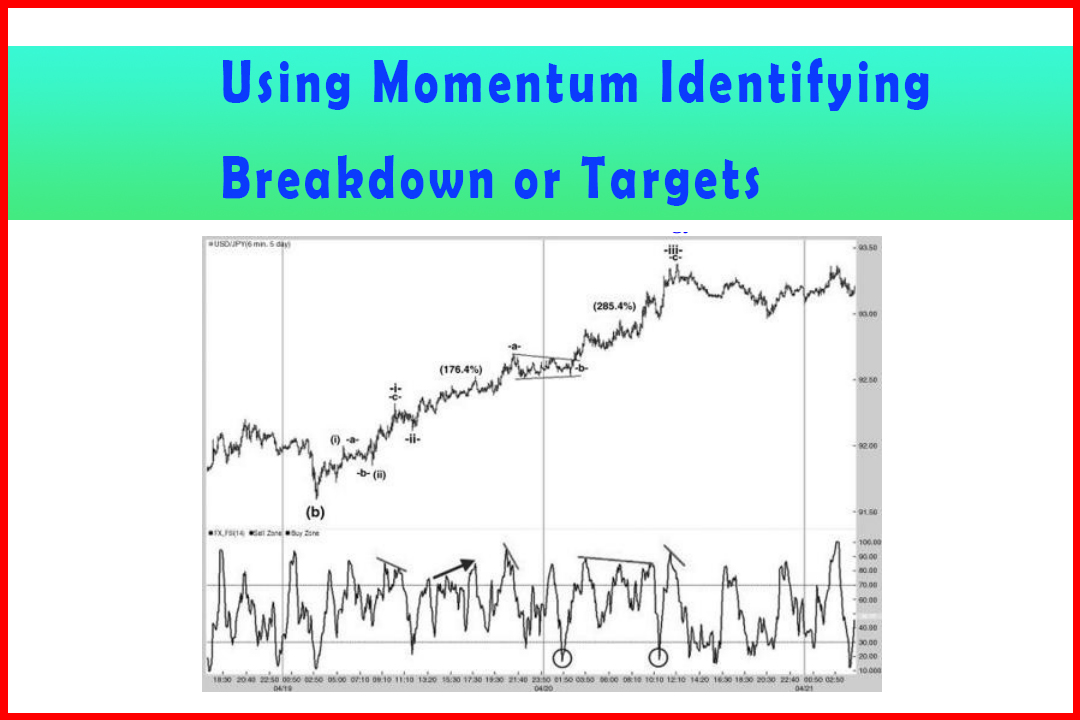
- The general adherence to ratios normally provides excellent break levels to the anticipated wave count. For example, if a Wave iii reaches a common expansion ratio in a possible complex correction then this can be highlighted by a break through the anticipated Wave iv retracement.
Harmonic Elliott Wave : Chapter 5: Modified Wave Structure in Forecasting : Tag: Elliott Wave, Forex, Fibonacci : Elliott wave targets, Third wave targets, Best Trading Strategy, Best Pattern Trading - Wave (iii) targets
Elliott Wave | Forex | Fibonacci |