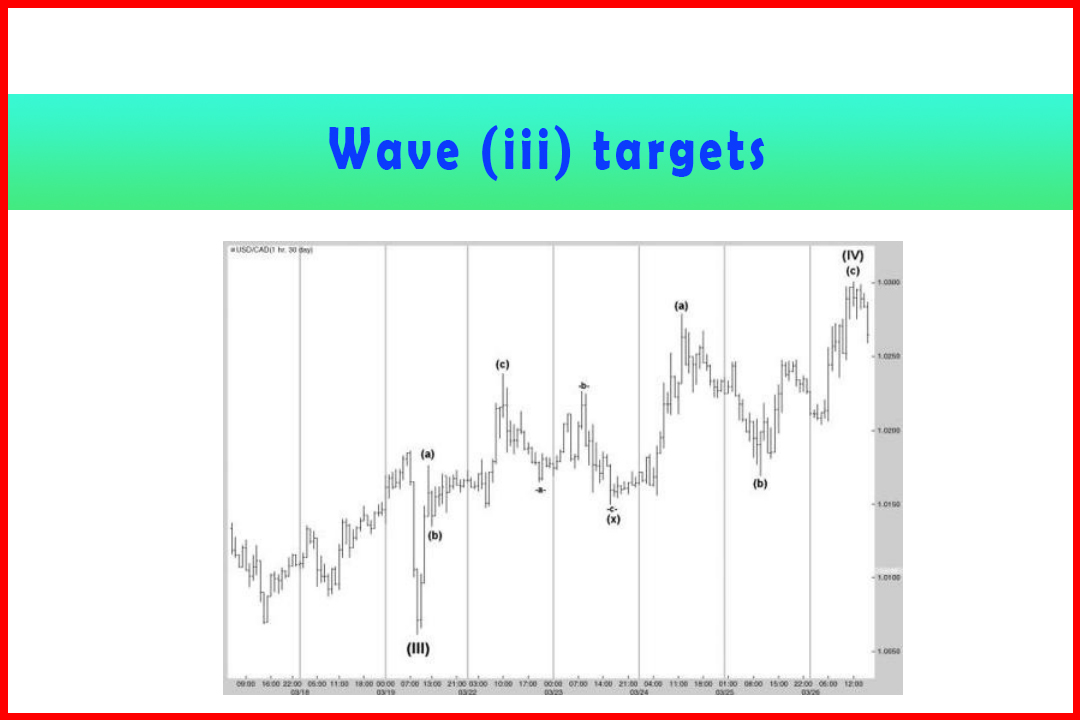
Wave (i) Targets
Best trading Analysis, Best Forecasting Analysis
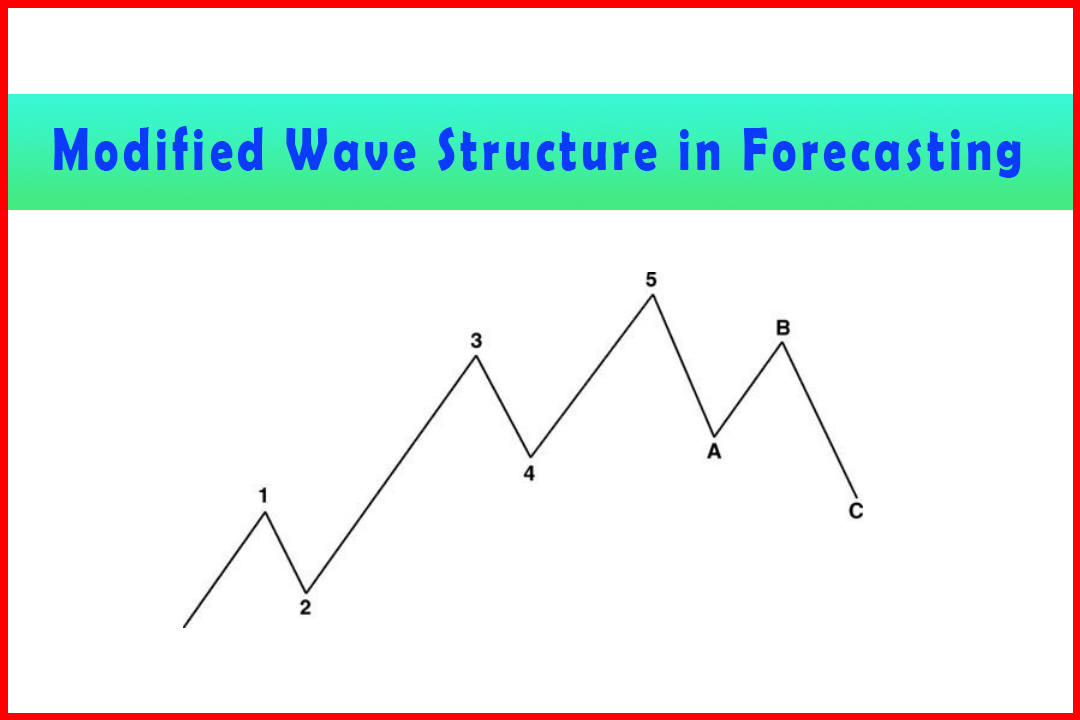
Course: [ Harmonic Elliott Wave : Chapter 5: Modified Wave Structure in Forecasting ]
Elliott Wave | Forex | Fibonacci |
There is no uniform way of identifying where this will stall as it is not related to any prior wave. It is possible to consider the prior Wave b of Wave (v) and occasionally the prior Wave (iv), especially when this is a key swing high or swing low in a trend.
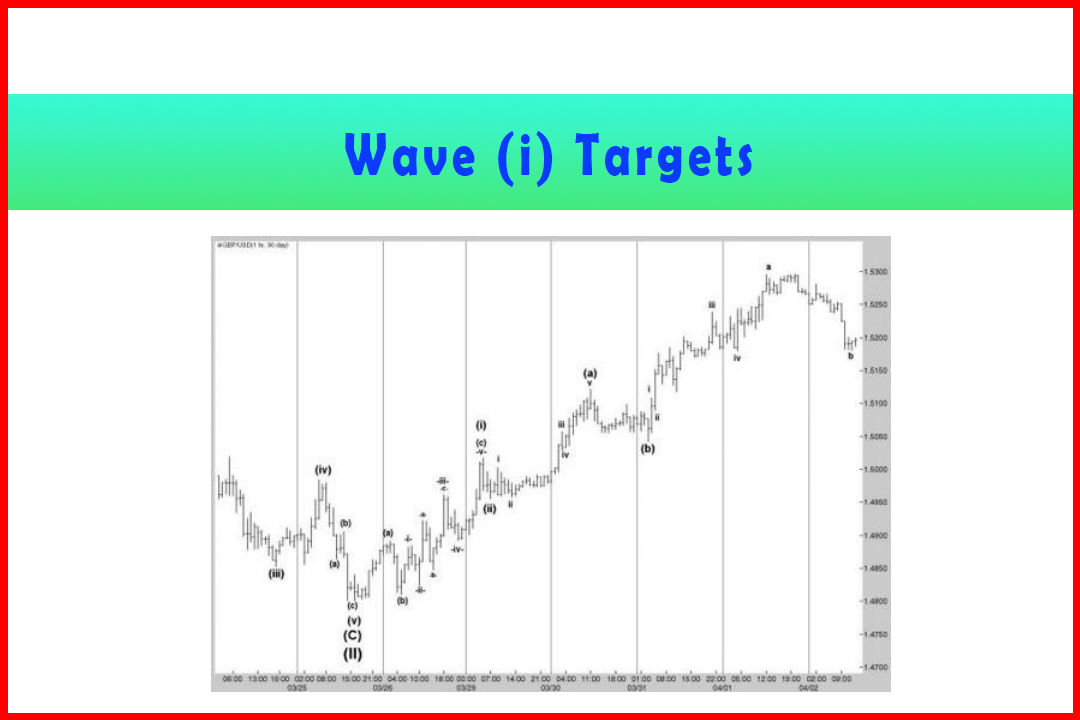
Wave (i) Targets
The
simplest target to watch for is a projection in Wave (c) that is a ratio of
Wave (a). In Chapter 4 covering retracement and projection targets I
highlighted the following:
There
is no uniform way of identifying where this will stall as it is not related to
any prior wave. It is possible to consider the prior Wave b of Wave (v) and
occasionally the prior Wave (iv), especially when this is a key swing high or
swing low in a trend. Markets tend to shun testing a swing low/high on the
first test. Other areas to consider are pivot levels, which I find of
particular benefit.
If
this is a Wave (a) of Wave (i) in a daily chart then again we should be
watching the development of the five waves that construct Wave (a) and matching
the projections in the internal Wave v with any of the prior Wave b of Wave
(v), the prior Wave (iv) or pivot level.
Following
this we shall need to observe the pullback in Wave (b) and then calculate
projections in Wave (c).
Take
the example of a pullback in Wave (B) in the AUDJPY market and the subsequent
development of Wave (I) of Wave (C) (shown in Figure 5.1).
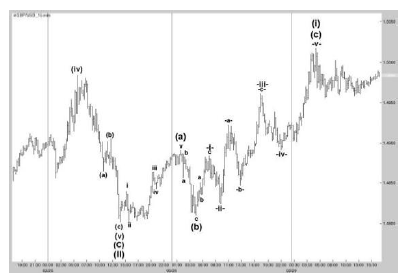
Figure 5.1 The
Early Stages of a Reversal Higher in Wave (C) from a Wave (B) Retracement Low
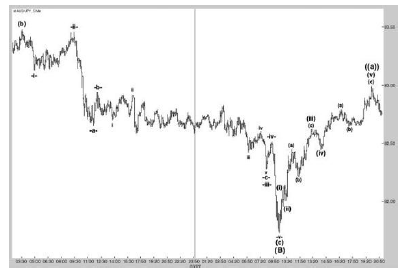
In
Figure 5.1. I have shown the decline in Wave (c) of Wave (B) within a rally in
AUDJPY. Naturally for a Wave (C) the expectation will be for a rally in five
waves that should reach a projection of a ratio of Wave (A) commencing from the
Wave (B) low.
Within
Wave (I) of Wave (C) there first needs to be a Wave ((a)) constructed of five
waves followed by a Wave ((b)) and then projection in Wave ((c)).
Normally
the easiest guideline is to look for the prior Wave b of Wave -v-. In this case
this is not discernable and therefore the next stronger resistance will be the
span of the prior Wave -iv-. Above there we can see the broad sideways
congestion area from the top of the prior Wave -b-to the lows just below Wave -
a-. These areas can be expected to provide resistance and normally cause
corrections.
In
the early stages of this wave development, consideration needs to be given to
the potential of Wave a. Wave b. and Wave c to form the first Wave (i) of Wave
((a)). A possible initial target would be the prior Wave (b). This is often the
stalling point of the Wave a of Wave (i). This will be followed by a Wave b and
then a projection of Wave a to complete Wave c. This will be Wave (i). In
trying to determine whether Wave (i) is in approximately the right area we
should consider a minimum target of a 176.4% projection of Wave (i) that would
imply a Wave (iii) that would stall in around the right area that would allow a
pullback in Wave (iv), then follow through in Wave (v) to reach close to a
realistic target for Wave ((a)).
Thus,
approximate estimations should be made to qualify the first abc rally in Wave
(i) and ensure that Wave b is a ratio of Wave a and then Wave c a projection of
Wave a. In this example, while it is too small to label, Wave b was a 41.4%
retracement of Wave a while Wave c was a 176.4% projection of Wave a. This
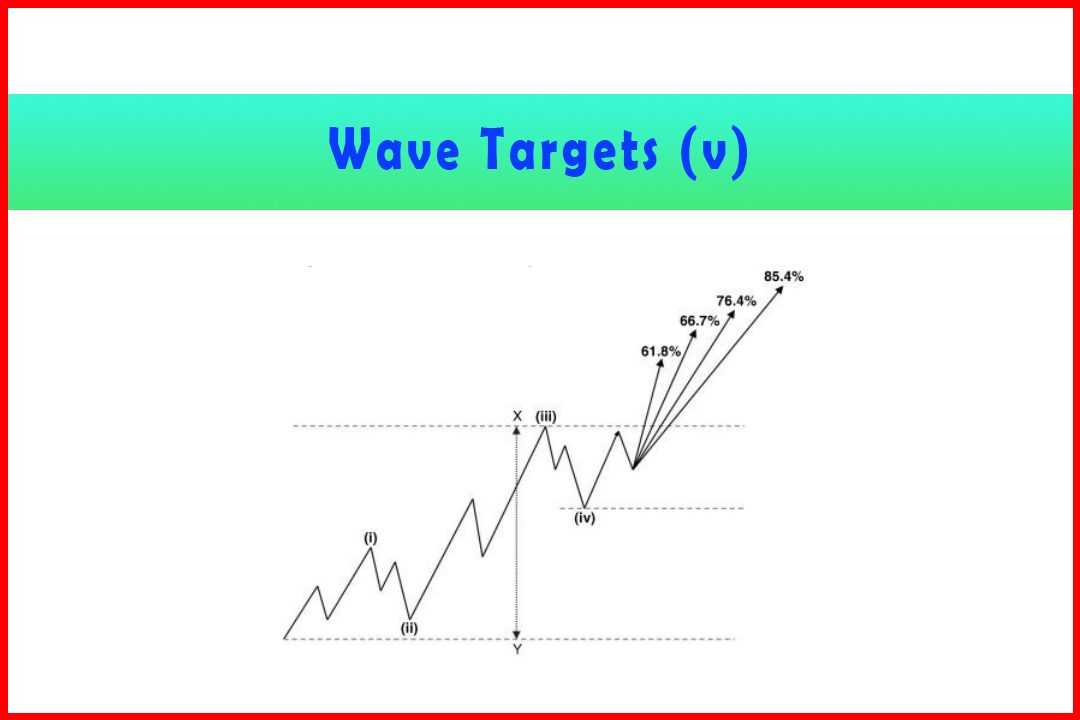
formed Wave (i) at 82.10. Wave (ii) was a 38.2% retracement of Wave (i).
At
this point projections in Wave (iii) can be generated. I shall cover these
later in this chapter.
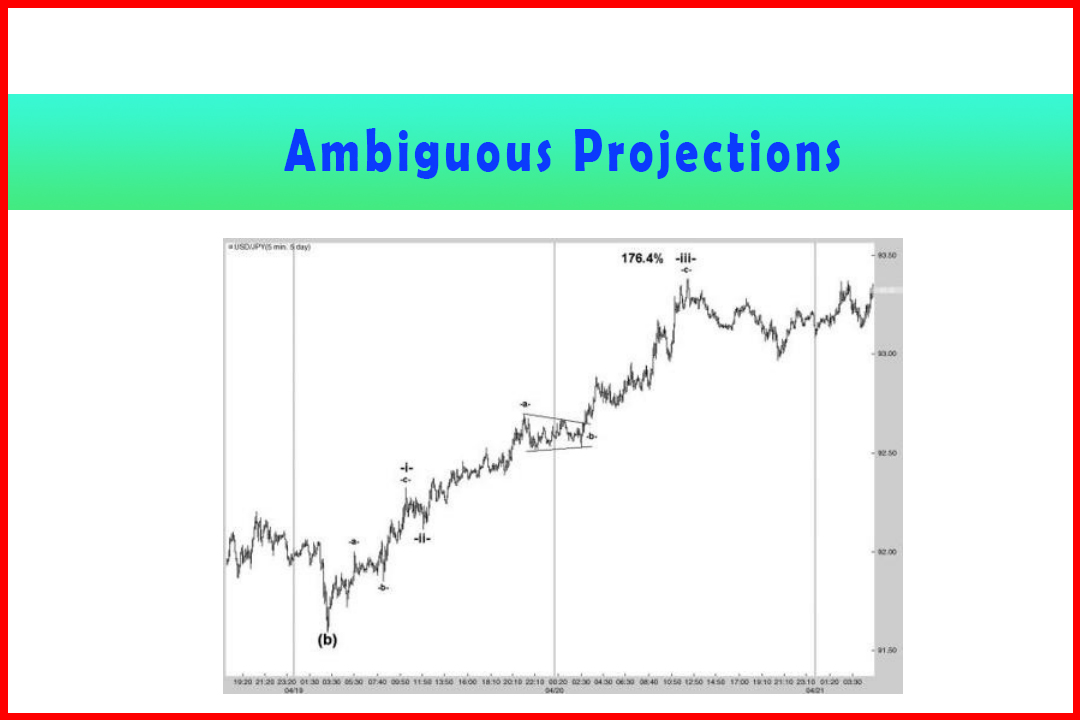
Wave
(i)'s can develop in different ways, at times with a very tight abc
move and sometimes with a long Wave c followed by steep or shallow wave
(ii)'s. There has been an interesting rally in the GBPUSD market which
includes the development of several Wave (i)'s that can be used as
solid examples (shown in Figure 5.2)
Figure 5.2 The
Initial Stages of a Rally in Wave (A) of Wave (III) in Hourly GBPUSD
Figure
5.2 displays the initial stages of development in Wave (A) of Wave (III) in the
hourly GBPUSD market. Within this are four instances of Wave 's, and
all are different in structural development in terms of pullbacks and
extensions. Also included are various examples of alternation between Wave (ii)
and Wave (iv) and, indeed, while the final Wave v of Wave (c) could not fit
into the image there is also an example of how Wave b of Wave v can also be
deep when Wave ii and Wave iv are both shallow.
To
highlight the different structures I shall zoom in on the key areas with the
use of lower time-frame charts (Figure 5.3).
Figure 5.3
Development of Wave (i) Including the Wave i of Wave (a) and Wave (c)
Figure
5.3 displays the first Wave (i) within which there are instances of Wave i in
both Wave (a) and Wave (c).
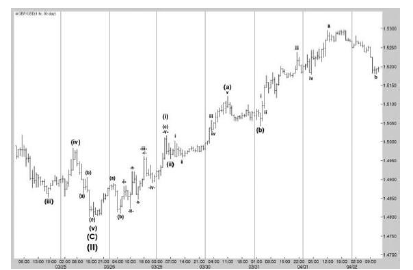
The
initial Wave i higher from the Wave (II) low is more often than not impossible
to predict. As long as the end of Wave (II) was expected it really sets a
marker down for subsequent wave development. However, the prior Wave (b) of
Wave (v) lower is a common target on initial reversals. In this case, although
not labeled, there was a brief Wave a followed by a sideways consolidation in
what appears to be a Triangle before the rally in Wave c to reach Wave iii. The
extension in Wave iii was 166.7%. Given the deep Wave ii, the expectation is
for a shallow Wave iv (33.3%) followed by a final Wave v (76.4%) into the span
of the prior Wave (b) of Wave (v) lower. This five-wave rally can then be
labeled as Wave (a) of Wave (i).
How
deep Wave (b) will retrace would be unknown, and in the end it turned out to be
a deep 90.02% retracement to 1.4810 which was exactly in the middle of the Wave
b Triangle in Wave iii. The next step will be to consider where a probable
target for Wave (i), and therefore Wave (c), could end. To judge this, a strong
idea of the larger wave structure must be known. This Wave (i) will be part of
Wave (A) of Wave (III). The Wave (iv) high is a possibility if it represents a
key swing high that would confirm a swing reversal of the previous downtrend,
which is more often than not the case. Wave (iv) was at 1.4984. Projections of
Wave (a) should also be made.
100.0%
= 1.4886
114.6%
= 1.4912
138.2%
= 1.4933
161.8%
= 1.4954
Therefore
the broad 1.4886-1.4933 area is where the Wave (c) is most likely to end, with
a lower risk of the 161.8% projection at 1.4954.
Wave
-i-rallied in three waves to the high of the prior Wave b of Wave (b). The
correction was quite deep, to two points below the 76.4% retracement. From here
a target in Wave -iii-can be estimated:
138.2%
= 1.4927
176.4%
= 1.4956
185.4%
= 1.4962
Wave
-a-rallied and reached 1.4922 with Wave -b-being also very deep to the 76.4%
retracement. It is possible that some doubts could arise over the depth of
retracements as there doesn't appear to be much evidence of
alternation. However, a target for Wave -c-can be generated and matched with
targets for Wave -iii-.
85.4%
= 1.4931
100.0%
= 1.4949
114.6%
= 1.4959
With
Wave -a-having completed at 1.4922 the 85.4% projection can be eliminated. That
leaves a target area of around 1.4956-59 and possibly 1.4962. In fact, Wave
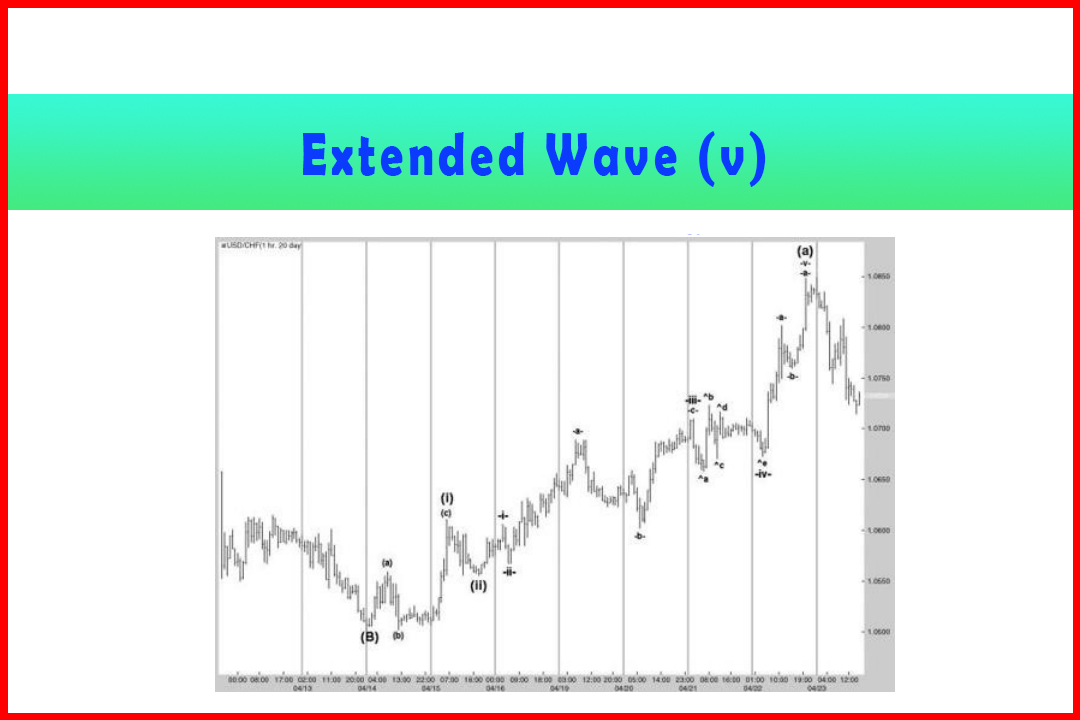
-iii-ended at 1.4961.
Now,
with Wave -iii-having ended at 1.4961 it has already exceeded the 161.8%
projection in Wave (c) at 1.4954. Therefore deep projections should be
considered. At the same time, a retracement in Wave -iv-and then extension in
Wave -v-should also be considered.
In
Wave (c):
185.4%
= 1.4975
223.6%
= 1.5009
238.2%
= 1.5022
261.8%
= 1.5043
With
the depth of retracement in all corrections until this point it would seem
probable that a shallower correction would be most likely. In the event even
Wave -iv-was a full 50% to 1.4891, and this provided projections of:
61.8%
= 1.4984
66.7%
= 1.4992
76.4%
= 1.5006
85.4%
= 1.5020
100.0%
= 1.5042
There
are several matching projections here; the 223.6% Wave (c) with 76.4% Wave -v-,
the 238.2% Wave (c) with the 85.4% Wave -v-, and the 261.8% Wave (c) with the
wave equality target in Wave -v-.
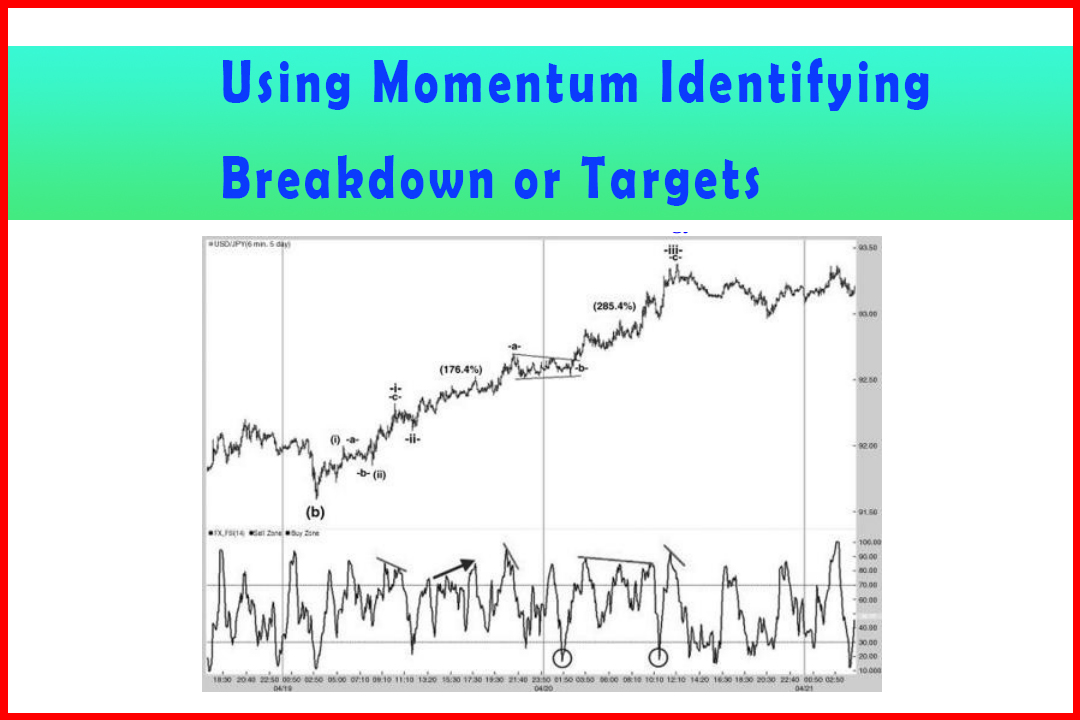
Identifying
just where this final wave will end requires supporting analysis, a projection
in Wave c of Wave -v-, and the use of momentum.
In
Figure 5.4 I have added my own RSI, a more sensitive version that tends to
swing more frequently between high and low extremes and identify divergences
more effectively. The high finally came at 1.5017.
Figure 5.4
Identifying the Completion of Wave -v-and Wave (c) Using Momentum
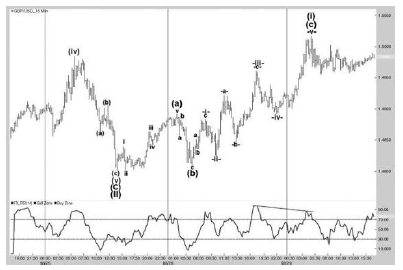
From
this point, focus can be made on identifying the Wave (ii) and resumption of
the uptrend in Wave (a), Wave (b), and Wave (c) of Wave (iii).
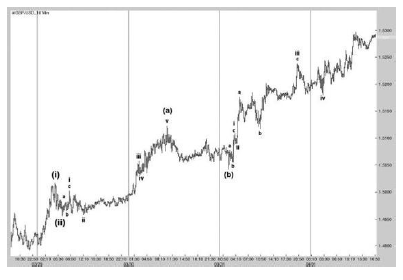
Figure
5.5 displays the development of Wave (a) and most of Wave (c) of Wave (iii). I
shall not go into as much detail for these as the intention is more to provide
examples of the different ways a Wave (i) can develop. Here, Wave (ii) was
exceptionally brief and therefore highlights the risk of a long and deep Wave
(iv) (which eventually did happen). In Wave (a) the Wave i stalled a little
short of the Wave (i) high and saw a deep Wave ii, while in Wave (c) there was
a similar strong extension in Wave c to complete Wave i and a shallow Wave ii
as was seen in Wave (i) and Wave (ii).
Figure 5.5
Extension in Wave (a), Wave (b), and Wave (c) of Wave (iii) Higher in GBPUSD
Harmonic Elliott Wave : Chapter 5: Modified Wave Structure in Forecasting : Tag: Elliott Wave, Forex, Fibonacci : Best trading Analysis, Best Forecasting Analysis - Wave (i) Targets
Elliott Wave | Forex | Fibonacci |