Bearish Engulfing Pattern
Bearish engulfing candle, Bearish engulfing, Bullish engulfing, Engulfing candle, Bearish engulfing pattern, Engulfing pattern, Engulfing candlestick
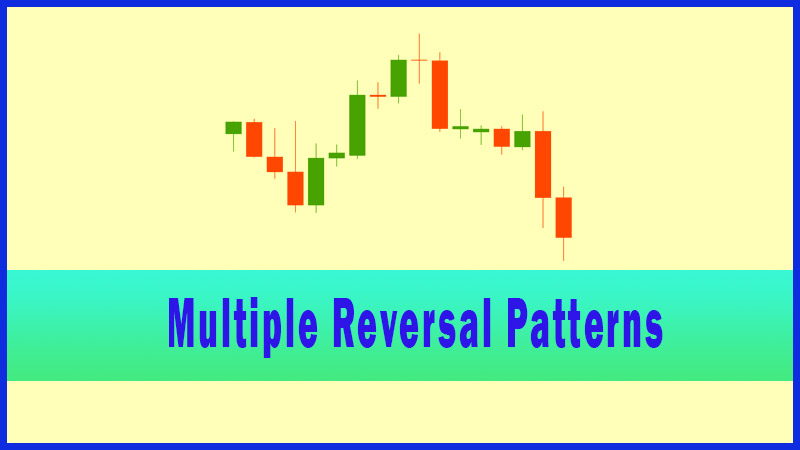
Course: [ Uses of Candlestick Charts : Chapter 4. Multiple Reversal Patterns ]
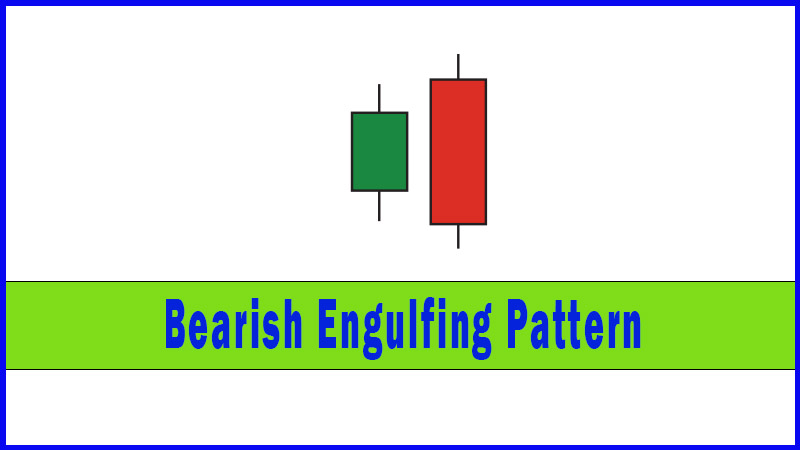
Let’s think about the two sessions that make up our pattern. On day one the market goes up, as evidenced by the open bodied candlestick. The market is in an uptrend, so this is no surprise, and by the end of this session all’s well in the world if you’re bullish.
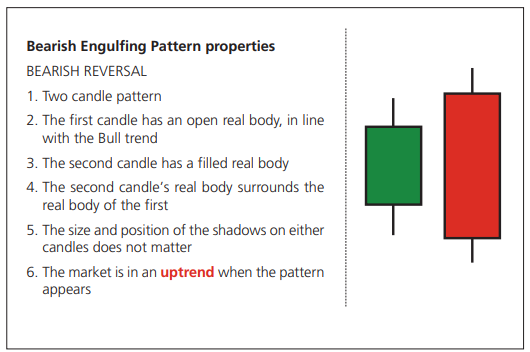
Bearish Engulfing Pattern Properties
Let’s
think about the two sessions that make up our pattern. On day one the market
goes up, as evidenced by the open bodied candlestick. The market is in an
uptrend, so this is no surprise, and by the end of this session all’s well in
the world if you’re bullish.
On the
second session the market opened stronger, above the previous day’s close, so
once again things are going well if you’re long. But then it all changes; the
sellers are resurgent, and by the end of this session the market has sold off.
The filled real body that surrounds or engulfs the open real body preceding it
means enough has been sold off to give back all of the gains made the day
before, and a bit more. From the first day’s open to the second day’s close the
market is lower, having been a lot higher in between times.
So there
is an arc shaped direction of travel, a rise then a drop, and a weak close to
boot.
Engulfing patterns versus outside days
There is
a pattern in Western analysis called a bearish outside day, or a key reversal
day. The rule set for this is a bear day in a rising market with a high above
the previous day’s high and a low below the previous day’s low. In other words
the day’s range is outside that of the day before, and a weak close is posted.
This is pretty similar to an Engulfing Pattern, but not always, as the
candlestick version doesn’t necessarily require a greater range on day two,
just a larger (filled) real body. In other words the range doesn’t have to come
into the equation.
Examples
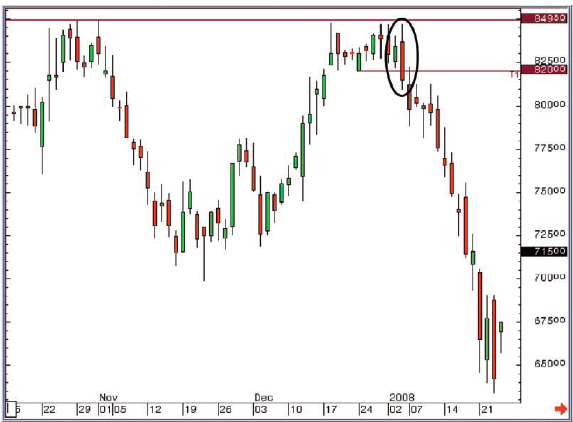
Figure 4-2: AMEC pic; daily candlestick
chart; 16 October 2007 - 24 January 2008, showing Bearish Engulfing Pattern on
3 and 4 January
On
the 4 January a key support level was also broken at 820, and the move through
here produced a Western Double Top formation as the market broke down through
the low from a few sessions previous (24 December 2007). The other thing to
note about this chart is how the market failed right on the resistance from a
few months before.
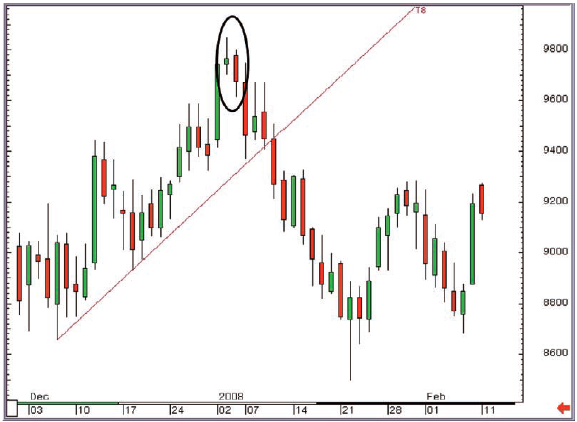
Figure 4-3: ICE Brent Crude Oil futures
(all sessions, active unadjusted continuation); daily candlestick chart; 30
November 2007 - 11 February 2008, showing 3 and 4 January 2008 Bearish
Engulfing Pattern
This
Bearish Engulfing Pattern saw a red candle surrounding a Star (see page 9) made
the day before. We’d made a new all time high on the first candle of our
pattern. Immediately after the Bearish Engulfing Pattern another big red candle
was posted, so there was some instant gratification. There was an uptrend line
to break before we got too excited though, and you can see there was another
solid reaction to the downside once this line gave way. This is an important
point to make: even if you had seen the reversal pattern, but then waited for
the trend line to break, you still could have made good money on the down move,
even if you only started selling $5 off the highs.
My particular
favourites are combination patterns where we see something like a Shooting Star
that is then engulfed by the next candlestick; the engulfing line adds weight
to the initial signal. As always, though, we’d look for confirmation after the
event before we’d act.
The ideal
world volume characteristics of this pattern is higher volume on the second
candlestick, ie, the selling on the second day is more ferocious than the
buying that was seen on the first.
Bearish Engulfing Pattern summary
The
Bearish Engulfing Pattern is a two candle pattern in a rising market where the
second candle has a filled real body that surrounds the open real body before
it. This is generally a strong reversal pattern as it often takes a lot of
effort and achievement from the bears for it to form. It is one of my
particular favourites for this reason. Also it usually coincides with the
Western bearish outside day. It should be ignored at your peril!
Uses of Candlestick Charts : Chapter 4. Multiple Reversal Patterns : Tag: Candlestick Pattern Trading, Forex : Bearish engulfing candle, Bearish engulfing, Bullish engulfing, Engulfing candle, Bearish engulfing pattern, Engulfing pattern, Engulfing candlestick - Bearish Engulfing Pattern