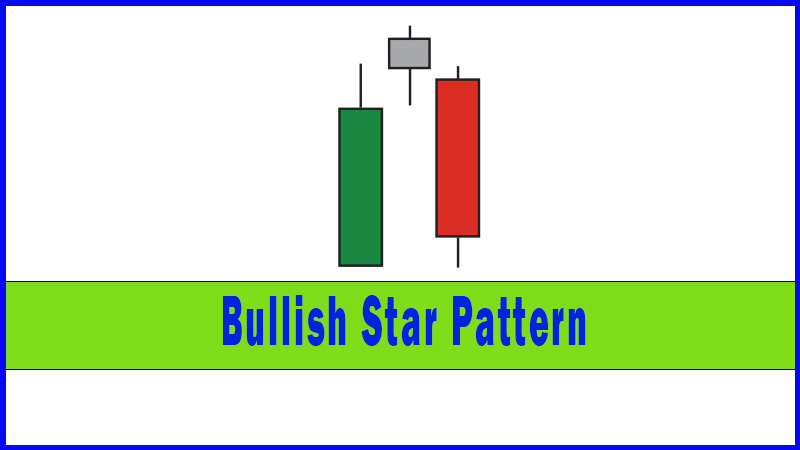
Bullish Star Pattern
Morning star pattern, morning star candlestick pattern, doji star bullish, morning star candle pattern, Bullish Star Pattern
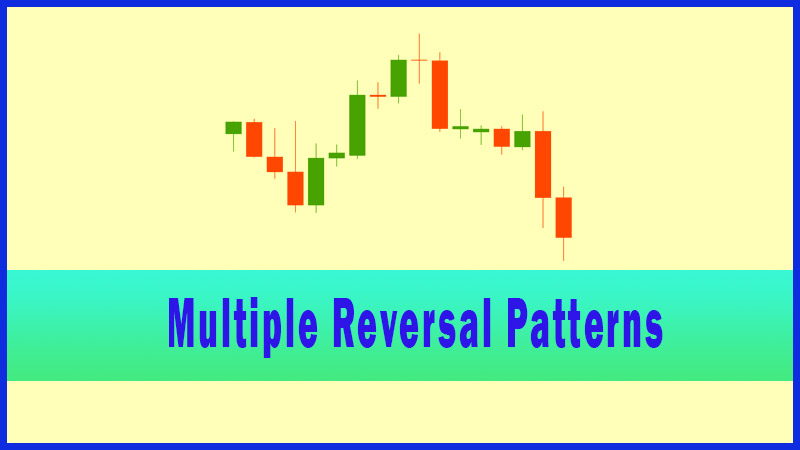
Course: [ Uses of Candlestick Charts : Chapter 4. Multiple Reversal Patterns ]
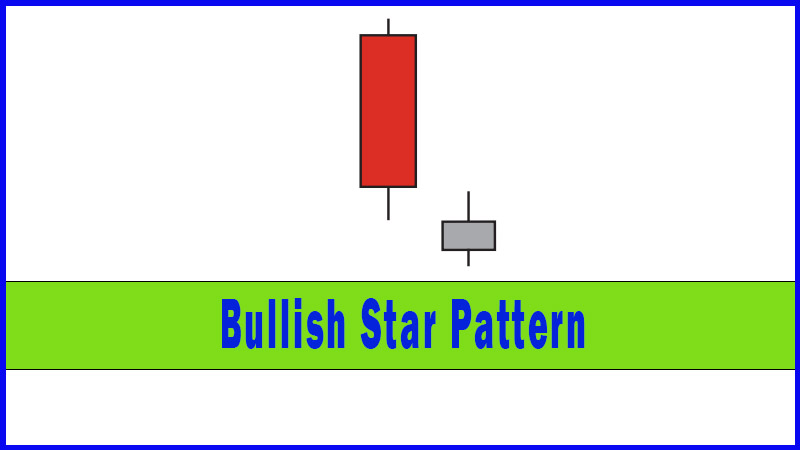
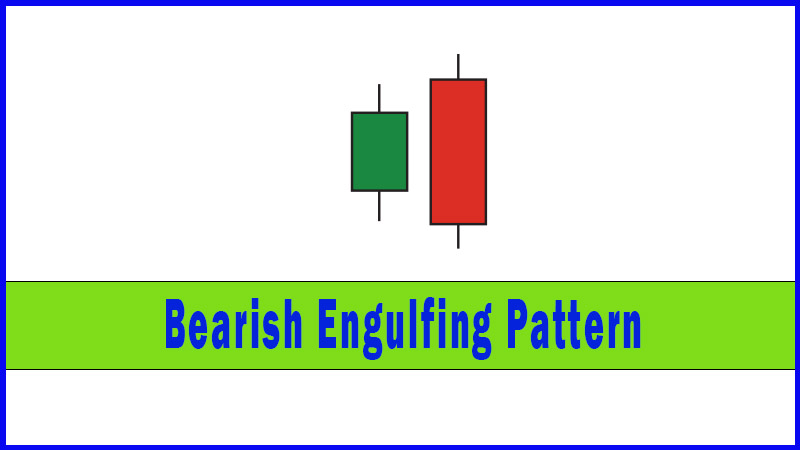
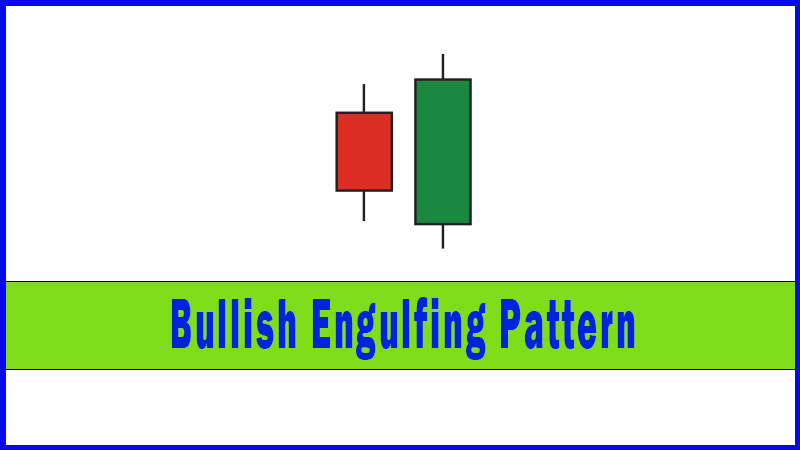
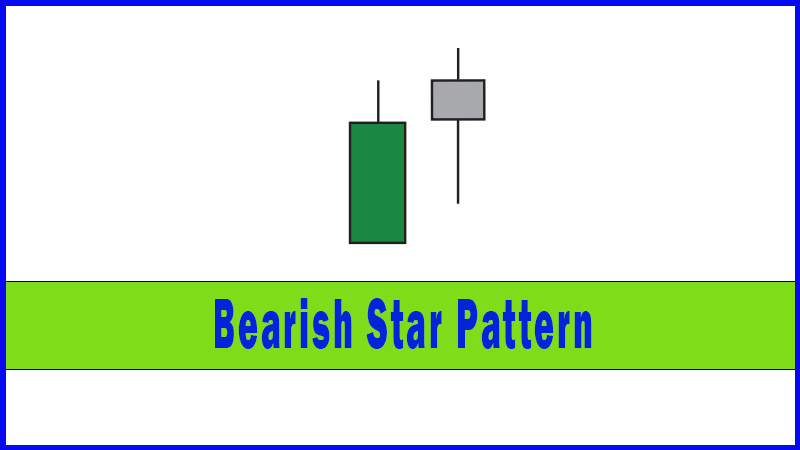
If this candle was seen within the previous red candle’s real body it would be a Harami, however if the second, small bodied candle gaps lower with a bad start it’s called a Star.
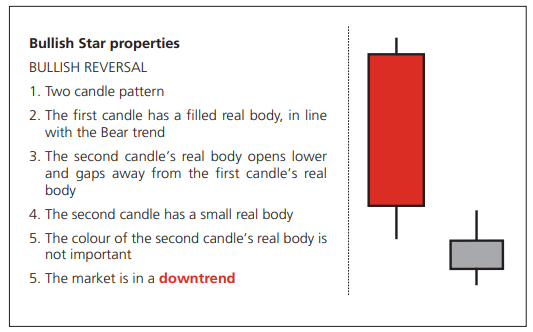
Bullish Star properties
If the
market is in a downtrend and you see a small bodied candle immediately after a
big red one this may be a sign that the downtrend is on the wane. If this
candle was seen within the previous red candle’s real body it would be a
Harami, however if the second, small bodied candle gaps lower with a bad start
it’s called a Star.
The bears
are in charge because the market is in a downtrend, and the big lower open is
just further proof that the bears are doing all the bossing. But if this great
start from the sellers doesn’t see any subsequent “oomph” then we should start
to get concerned that maybe the bears are losing the will or the ability to
keep it going.
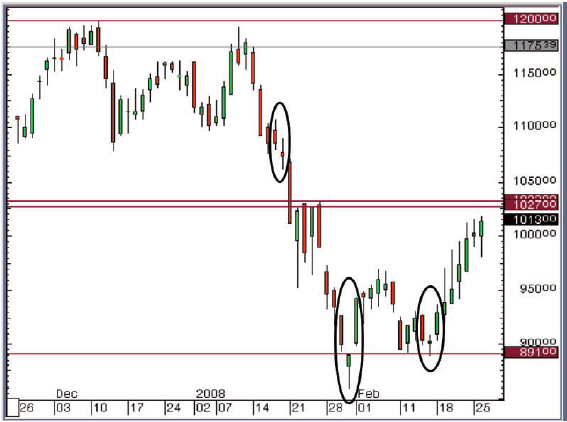
Figure 4-12: Shire Pharmaceuticals
Group pic; daily candlestick chart; 26 November 2007 - 26 February 2008,
showing several Star combinations
Figure
4-12 shows three Bullish Stars. The first didn’t work at all. There was
absolutely no subsequent confirmation, and therefore I wouldn’t have taken this
signal.
The
second saw the market gap quite a bit lower on the Star day, and it then
rallied into the close to post a green real body (remember though, the colour
of the real body is not that important for this pattern, although obviously the
close at the top of the day’s range in this instance may well have added some
conviction). As you can see I got some instant gratification on this occasion
with a strong up day the next day.
But the
rally soon petered out and the market decided to come back and fill the gap
seen after our Star formation (see Chapter 5 for a discussion of gaps). In
doing this another Star pattern was formed, and this time there was a decent
rally for several sessions after the gap-filling Star.
Summary
If you
are in a strong downtrend you will likely see a fair few big down days posted,
with large filled real bodies. If after one of these the market opens
significantly lower but then does nothing for the rest of the day, this lack of
reaction can be taken as a warning signal that the selling is stalling.
So we can
see that the Star patterns that work the best are the ones where there’s
confirmation subsequently, which sets the scene nicely for the next pair of
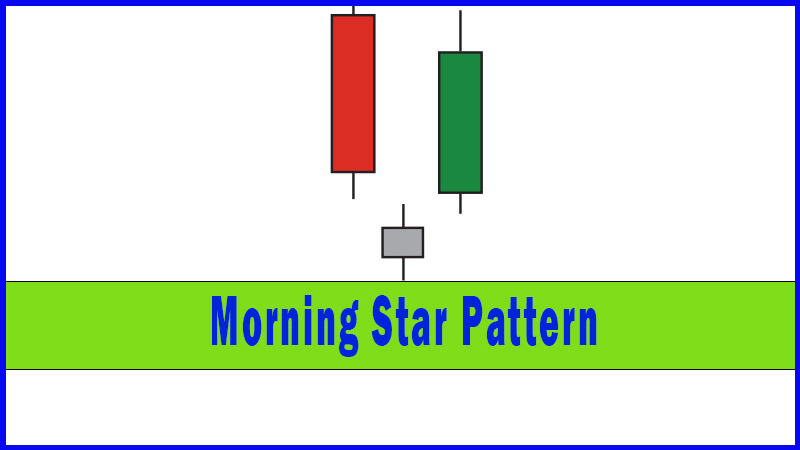
patterns: the Morning and Evening Stars.
Uses of Candlestick Charts : Chapter 4. Multiple Reversal Patterns : Tag: Candlestick Pattern Trading, Forex : Morning star pattern, morning star candlestick pattern, doji star bullish, morning star candle pattern, Bullish Star Pattern - Bullish Star Pattern