Bullish Engulfing Pattern
Bullish engulfing, Engulfing candle, Engulfing pattern, Engulfing candlestick, Bullish engulfing pattern
Course: [ Uses of Candlestick Charts : Chapter 4. Multiple Reversal Patterns ]
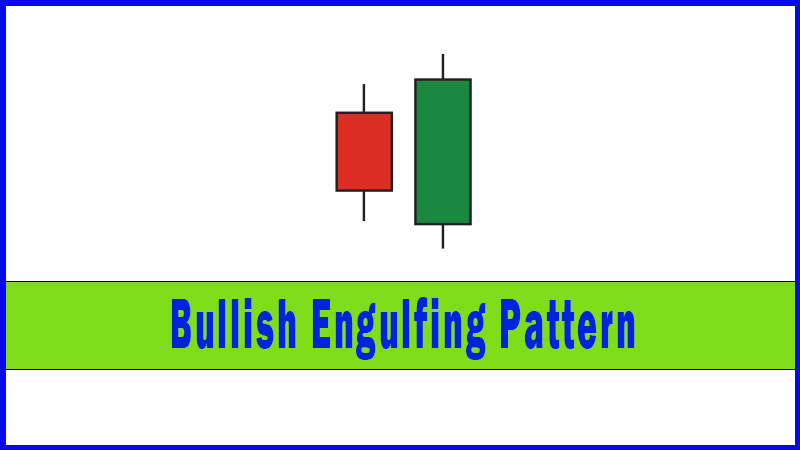
The Bullish Engulfing Pattern suggests that a market has found support, and depicts two sessions where the bears dominate the first day but the bulls come back to life in some style in the second session.
Bullish Engulfing Pattern Properties
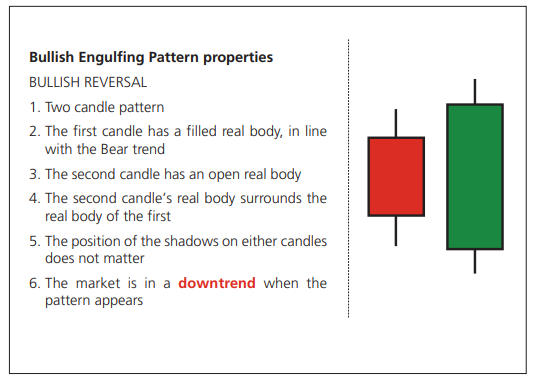
The
opposite of a Bearish Engulfing Pattern is, as you might guess, a Bullish
Engulfing Pattern. It is similarly powerful, and the set of rules is the same
but in reverse.
The Bullish
Engulfing Pattern suggests that a market has found support, and depicts two
sessions where the bears dominate the first day but the bulls come back to life
in some style in the second session.
It’s the
same sort of price action as can be seen during a Hammer candlestick, except it
happens over two sessions.
Once again,
all you have to do is think about the price action that goes into the separate
candlesticks, and immediately you can see why it’s a potential reversal. The
second candle is akin to the second half of a Hammer session; the bulls
suddenly wake up, and come storming back to the party. The market has to close
strongly as well for it to engulf the first candle’s real body. All of this
bullishness comes after a weak open on the second day, so it’s quite a revival
that’s been achieved.
Figure 4-4: ICE Brent Crude Oil futures (all sessions, active unadjusted continuation); daily candlestick chart; 21 November 2007 - 11 February 2008, showing Bullish Engulfing Patterns on 5/6 December 2007, 23/24 January 2008, and 6/7 February 2008
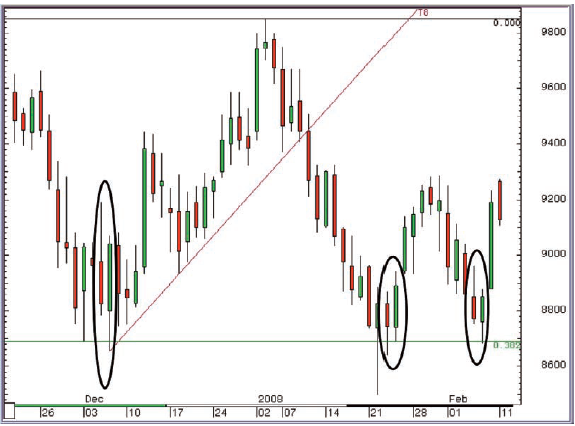
This chart
shows three Bullish Engulfing Patterns after pullbacks in Brent Crude at the
end of 2007 and the beginning of 2008. If you look at a much longer-term chart
for this one you’ll see that the market was up near (what was then) all time
highs having rallied strongly in the previous couple of years. The preceding
chart merely shows some short term pullbacks near the top of this bigger
picture move.
Important note
We were in
a long-term uptrend, there’s no doubt about that. In fact the trend was so
strong that there would be many people out there looking for a buying
opportunity, either because they’ve missed making money on the previous up-leg,
or because they’ve covered longs and are now looking to get long once more on
any weakness.
On these
three occasions the market pulled back to a short-term Fibonacci retracement
level, then the Bullish Engulfing Patterns appeared.
Bullish Engulfing Pattern summary
The Bullish
Engulfing Pattern is two candles; the first a filled candle in a downtrend. The
change occurs on the second candle when the bulls have a great day after a bad
start, and they manage to post a close on day two above the open on day one.
This is
generally a strong reversal pattern, and one I’d recommend keeping an eye out
for.
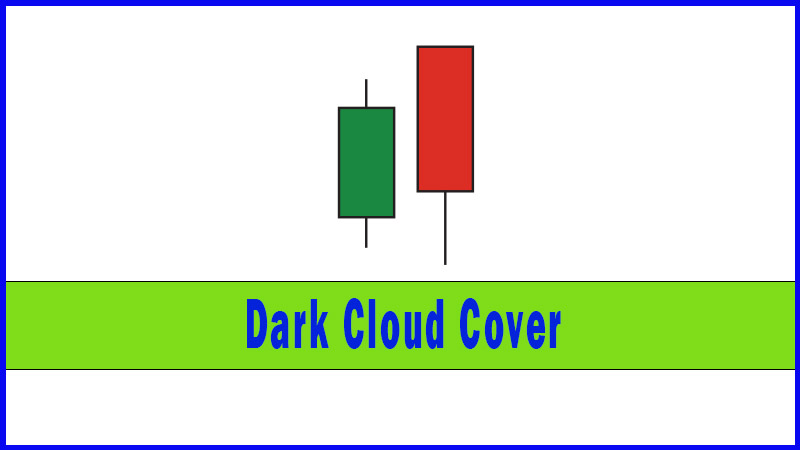
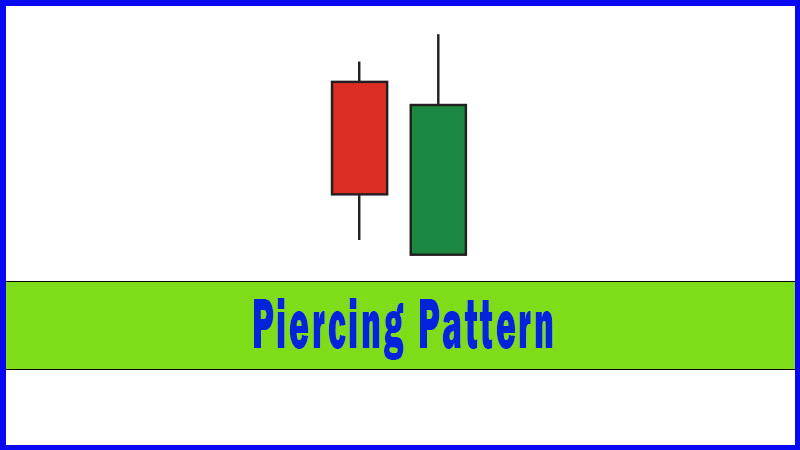
The next
pair of patterns we’re going to look at is Dark Cloud Cover and the Piercing
Pattern.
Uses of Candlestick Charts : Chapter 4. Multiple Reversal Patterns : Tag: Candlestick Pattern Trading, Forex : Bullish engulfing, Engulfing candle, Engulfing pattern, Engulfing candlestick, Bullish engulfing pattern - Bullish Engulfing Pattern