Bearish Harami
Bearish harami pattern, bearish harami candlestick pattern, bearish harami cross, bearish harami candle pattern
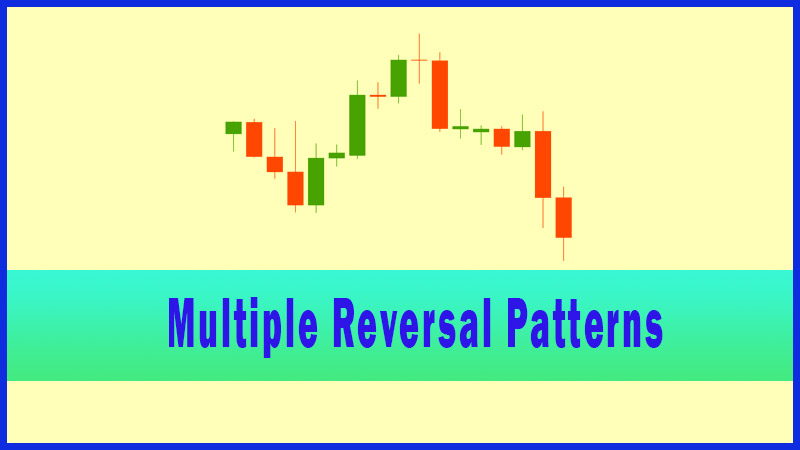
Course: [ Uses of Candlestick Charts : Chapter 4. Multiple Reversal Patterns ]
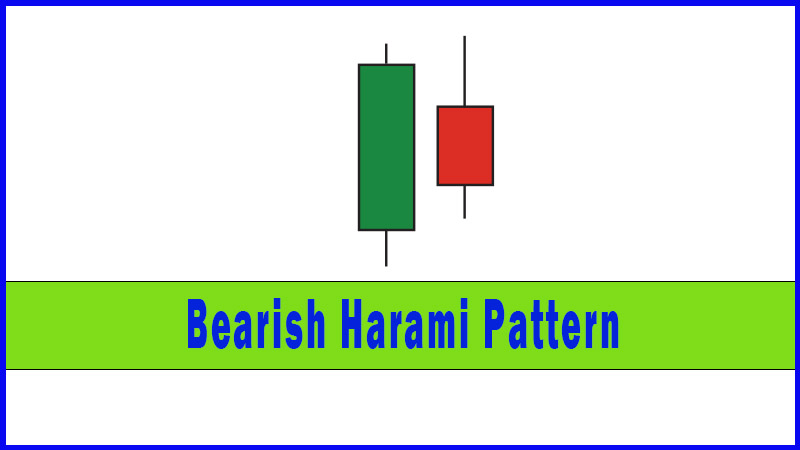
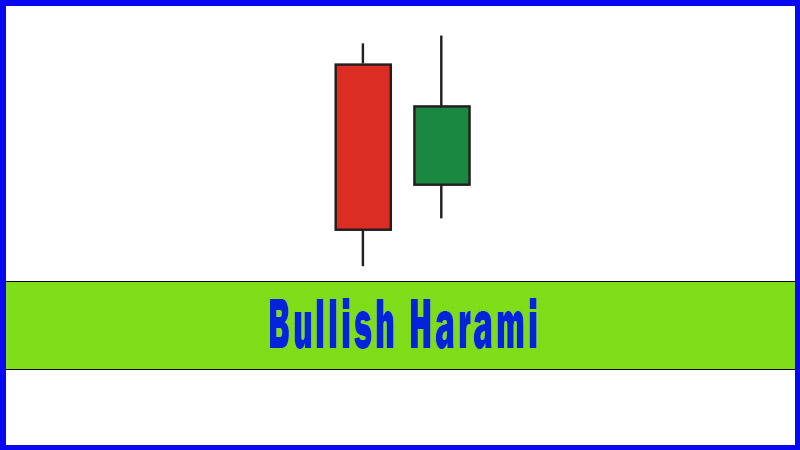
The next line is going to be rather predictable, I fear. The opposite of a Bullish Harami is... can you guess? Yes indeed! Go to the top of the class! A Bearish Harami.
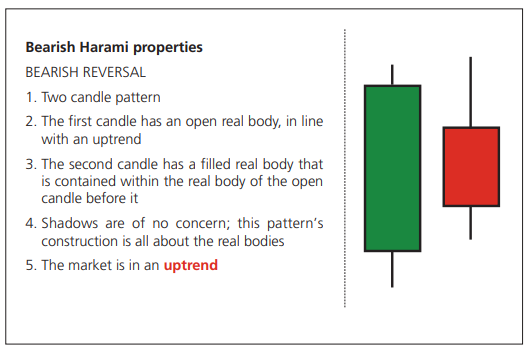
Bearish Harami properties
The next
line is going to be rather predictable, I fear. The opposite of a Bullish
Harami is... can you guess? Yes indeed! Go to the top of the class! A Bearish
Harami.
As you
can see from our box on the previous page, it has all of the rules of the
Bullish Harami but in reverse; this time a small red real body sits within the
green real body prior to it.
In other
words, day one was good for the bulls, and when you consider that we’re in an
uptrend this is no big shock to anyone. The weak open on the second day of our
pattern is the first sign that the market may be struggling at these levels.
The Bulls don’t react to this weak open on this particular day. Often weakness
in an uptrend is pounced upon as a buying opportunity by the bulls, if they’re
in a dominant mood. But that doesn’t happen on this occasion. Instead the
market does pretty much nothing, and ends the day within the real body of the
previous session.
We’re not
worried about the shadows on this pattern, remember, we’re only concerned with
the position and size of the second real body, which must be a “baby” contained
within the “mother” candle before it.
The
reason why this is classed as a reversal is because the second session is a
pathetic effort after all that’s gone before. Usually it’s accompanied by a
failure to make a new high as well, and generally we’d ask for a bit more
confirming price action subsequently before acting upon it.
If I were
forced to give pattern star ratings based on my personal experience across all
markets and time frames this one would score pretty lowly, although as I
mentioned earlier this is not a game I like to play.
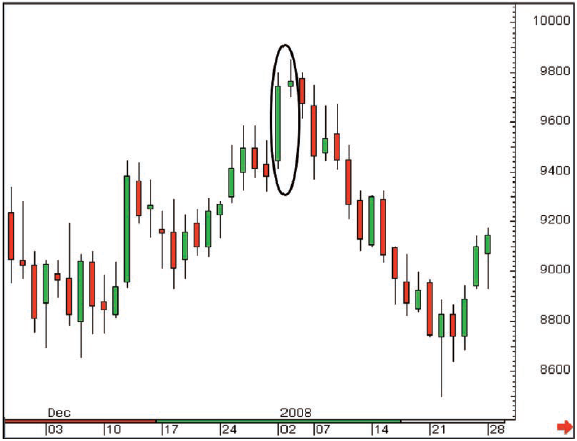
Figure 4-10: British Energy pic; daily
candlestick chart; 15 November 2007 - 29 January 2008, showing Bearish Harami
on 8/9 January 2008
If you
looked back at the previous price history of this stock you would instantly
have seen that £6.00 was a strong resistance level, so seeing a Harami when
approaching this level would have piqued interest at least.
This
wasn’t the top on this occasion, as there were some decent gains the next day,
when the market got through 600 to print 607, but on this day the gains were
sold into and the session ended back near the lows, posting a Shooting Star.
This was engulfed the next day with a big red candle. I’ve never quite decided
what the collective noun for candlestick reversals should or could be, but I’d
certainly be using it in this case. We have a gaggle of reversal patterns, a
sloth of bears, a cacophony of noise arguing in favour of further downside, and
the market duly obliged.
Spotting
the Harami pattern would have given you an early hint that something was amiss,
and with each day that another negative candlestick was posted our conviction
increased. Once 5.50 cracked just one week after our Harami the market dropped
another 85 pence in five days.
You were
ready for this sort of move, and the Harami meant you’d “geared up” earlier
than you might have done without it. So it wasn’t a definitive reversal signal,
but it still did a job for us.
The
psychology behind the Harami is that the market opened weaker on the second
day, immediately putting doubt into people’s minds. As is customary in a strong
uptrend, this weakness was not bought into. While it’s fair to say the bears
didn’t exactly weigh in and change the entire landscape, there’s still been a
subtle change in the balance of power, with no one dominating the second day.
Bearish Harami summary
The
Bearish Harami warns of a market topping out. It is constructed of two candles.
The second candle has a filled real body, usually quite small, contained within
the open real body before it.
It isn’t
one of my favourite patterns but can serve to set off a few alarm bells, which
can be useful particularly if you’re in a trade and wondering where or when to
take some profit.
Candlesticks don't have to be a "black and white" signal generating tool!
This is
something I often try to get across to people about candlesticks, especially
people who want to be completely definitive about this sort of thing. There
have been many studies done on technical analysis and candlesticks, and they
always “do the stats”. For example, you see a pattern and you buy it the next
day and you run it for n number of days. If you did this with Harami patterns
the results would probably be abysmal. If you did it with something supposedly
more potent like Shooting Stars the results would almost certainly still be
ordinary, if not disastrous.
The point
I’m trying to get across right now though is that they don’t have to be treated
in this way at all. You can simply use candlesticks to give you a better
understanding of the balance of power between bulls and bears at any particular
moment, and you can use candlestick reversal patterns to set off alarms that
maybe a move is running out of steam. At least then you’ll be ready for a turn
around.
It’s so
easy as a trader, and a chartist, to get married to a position, a trade or a
trend. If you’re making good money on something it’s so easy to get carried
away with the idea that it’s going to last forever. This simply isn’t going to
be the case, and you don’t want to maintain your long position all the way back
down. Maybe something like a Bearish Harami reversal can jog you out of
thinking that the market’s going to go up for ever and always, and can have you
getting ready to jump out of a position earlier than you normally would, before
you give too much back.
Uses of Candlestick Charts : Chapter 4. Multiple Reversal Patterns : Tag: Candlestick Pattern Trading, Forex : Bearish harami pattern, bearish harami candlestick pattern, bearish harami cross, bearish harami candle pattern - Bearish Harami