Dark Cloud Cover
Dark cloud cover, Dark cloud cover pattern, Dark cloud candlestick, Dark cloud cover candlestick, dark cloud pattern, dark cloud candlestick pattern
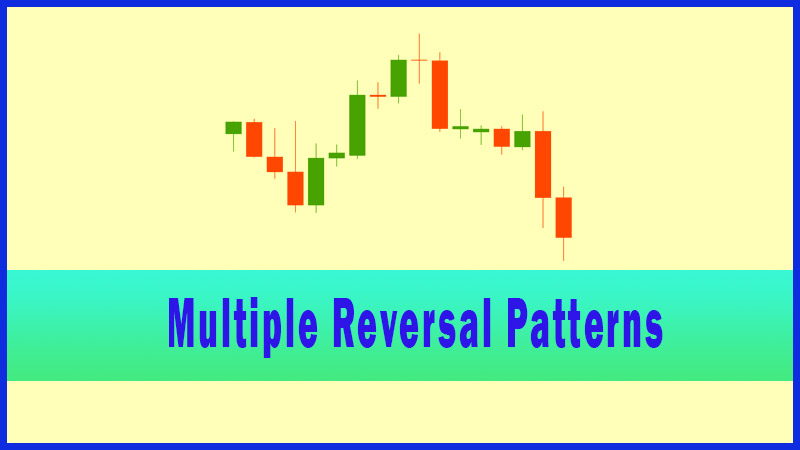
Course: [ Uses of Candlestick Charts : Chapter 4. Multiple Reversal Patterns ]
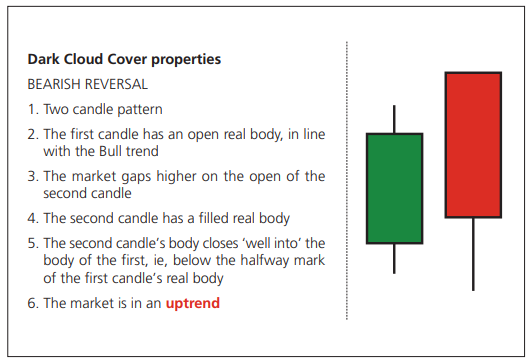
There is a name in candlestick analysis for the halfway point of the real body of a large bodied candlestick, and it is the Marabuzo line. The next chapter is entirely devoted to this, so I won’t get too involved here, except to say that to post a Dark Cloud
Dark Cloud Cover properties
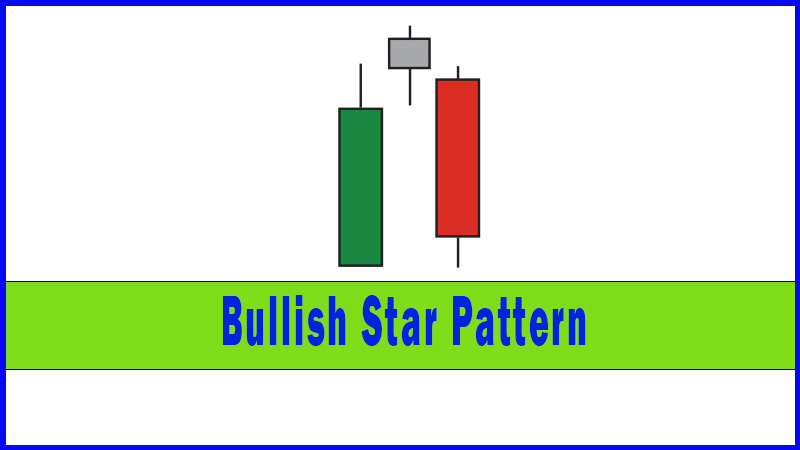
Would
anyone like to hazard a guess as to whether Dark Cloud Cover is bullish or
bearish?
I spotted
a Dark Cloud Cover in the FTSE futures on 5 and 6 May 2006 (see Figure 4-5). At
the time it was trading just above 6000. I warned that “a
storm may be brewing” - never missing the opportunity to throw in a
dodgy pun. I said at the time that I would look for a break back below 6000
before acting upon the reversal pattern though. I did this on 12 May, a day
when the market sold off 117 points. Over the next 6 days the market sold off
down to 5506, a near 500 point drop from our trigger level. I think the storm I
predicted took place!
Another
Dark Cloud Cover could be seen in the FTSE futures on the 15 and 18 June 2007
(Figure 4-6). Even if this book has a long shelf life and is still being read
in many years to come, I think what happened in the summer of 2007 will still
be remembered (will we ever forget the word subprime?), but just in case, I’ve
posted the following chart - Figure 4-5 - as well as the chart for the reversal
in 2007 - Figure 4-6.
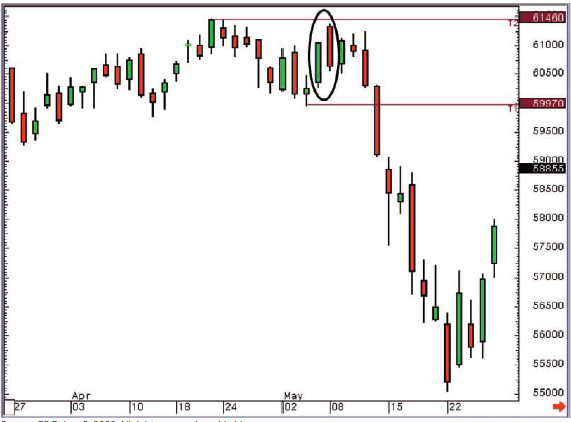
Figure 4-5: FTSE 100 futures (all
sessions, active unadjusted continuation); daily candlestick chart; 27 March
2006 - 26 May 2006, showing Dark Cloud Cover on 5/8 May 2006
When the
market went on to break below 6000 I was ready to go short, and despite this
being 150 ticks off the highs the market still sold off heavily subsequently.
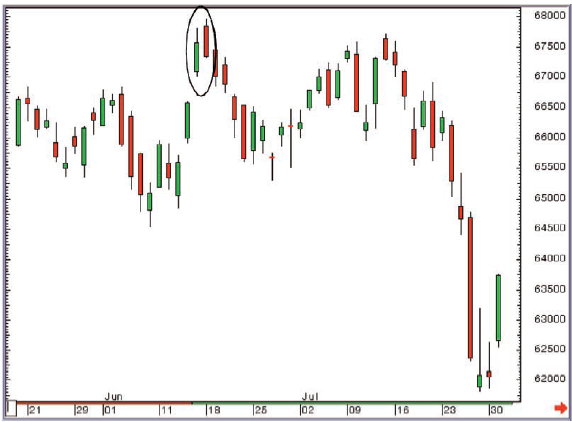
Figure 4-6: FTSE 100 futures (all
sessions, active unadjusted continuation); daily candlestick chart; 18 May 2007
- 31 July 2007, showing Dark Cloud Cover on 15/18 June 2007
This was
followed by four red candles in a row, then a recovery of sorts. This mini recovery
lasted until mid July, but the market never retook the high from 18 June, and
after a few days the selling commenced again in style.
Interestingly,
in researching this book I spotted a Dark Cloud Cover example from 1985, again
in the FTSE, in a book written by Elli Gifford (The Investors Guide to
Technical Analysis, 1995), a former leading light of the UK Society of
Technical Analysts. It seems that this isn’t one to ignore if you’re looking at
the UK stock market!
Let’s
think about the psychology of this pattern briefly. The first day is a green
candle in line with the bullish mode that’s prevalent at the time. The first
trade of the next day sees the market gapping higher, so at that time the bulls
are once again flexing their muscles and looking totally in charge of the
situation.
What
happens for the rest of the day? The sellers dominate, that’s what. The selling
sees us give back a good proportion of the buying seen the previous day and the
market closed well into the real body of the first candlestick. This is one of
those times when it appears that the conversion from the Japanese textbooks on
the subject hit upon some translation problems. Or is it that in the Western
world we need everything defined to the nth degree? I’ve always had the
impression with candlesticks that the Japanese appear to be happy to be a bit
more visual, whereas we want things to be very clear cut and rules-based.
Introduction to the Marabuzo line
But
something interesting has come of this. It’s generally accepted that a close
well into the first candle’s real body for this pattern should be classed as
below its halfway point.
There is
a name in candlestick analysis for the halfway point of the real body of a
large bodied candlestick, and it is the Marabuzo line. The next chapter is
entirely devoted to this, so I won’t get too involved here, except to say that
to post a Dark Cloud Cover pattern we need the second candlestick to close
below the Marabuzo line of the first candle.
To gap or not to gap - Dark Cloud Cover variations
The next
thing worth talking about where this pattern is concerned is rule number 4:
“The market gaps higher on the open of the second candle”.
That
means that the top of the real body of the second candle should be above the
high of the first day (ie, above the top of the upper shadow). Quite often I
see this rule disregarded, or is it misinterpreted? Let’s not worry about that
for a second; let’s go through the issue.
Below I have posted two candlestick
combinations.
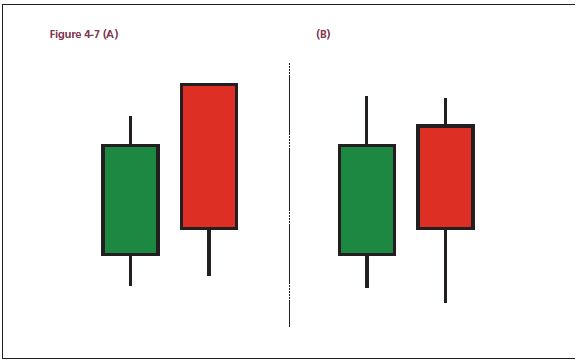
In both
cases there are two candles, the first of which is green. Figure A is a classic
Dark Cloud Cover as it satisfies all of our rules set out on page 78. In Figure
B you can see the market didn’t open above the first day’s high on the second
day. It opened above the previous day’s close, but not above the previous day’s
high, i.e, it didn’t gap higher.
I have
often seen this combination called Dark Cloud Cover, and there’s a strong
argument that it doesn’t matter where the market opened on the second day, the
important thing is where the market closed on that day, which is the same in
both instances. After all, it’s the state of mind of the market at the end of
the second candle that will dictate whether it is indeed in the throes of a
reversal.
I prefer
to call it a variation on a Dark Cloud Cover and to not ignore it entirely on
that basis. We will look later at how flexibility can be, and at times has to
be, applied to the reading of candlesticks.
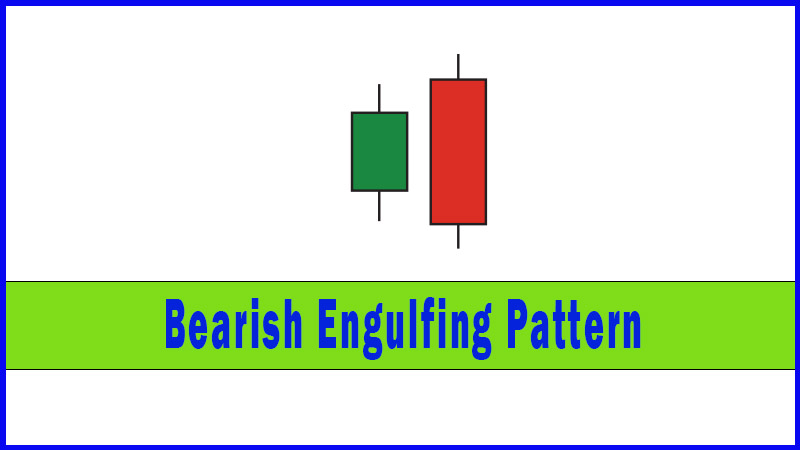
The Poor Man's Engulfing Pattern?
If we
assume that we’re happy to class either of these situations as Dark Cloud Cover
then it can be said that this is a Poor Man’s Engulfing Pattern. After all, if
we’d continued lower and posted a close below the first day’s open we’d have
posted a Bearish Engulfing Pattern, so surely Dark Cloud Cover is just a
watered down version that didn’t quite manage to do as much? Dark Cloud Cover
can be regarded as a “nearly man”!
Whatever
works
This is a
valid argument, but once again brings us back to something I’ve touched upon
before, something I like to call the “whatever works” rule. If you see Dark
Cloud Cover formations at the top of every move on the chart that you use for
your analysis then you shouldn’t be discouraged because some textbook has told
you they’re not as strong as a Bearish Engulfing Pattern. I say again, I’ve
often been asked to rate candlesticks with some sort of star rating according
to how strong they are, and while there are patterns that should, in theory, be
stronger than others, they can never be classed as guaranteed. As with anything
to do with technicals, you have to do the work and you have to look back and
see what works best on the chart you are viewing. You may find that Dark Cloud
Cover patterns are excellent reversal patterns, just as they were in the FTSE
in the charts we’ve looked at in this section. I’m certainly not going to
ignore the next Dark Cloud Cover I see in the FTSE futures, just because it
didn’t make it as a Bearish Engulfing Pattern!
Dark Cloud Cover summary
Dark
Cloud Cover is a marvellously gloomy sounding two candle reversal pattern seen
during an uptrend. The first candle has an open real body and is in line with
the bullish tone of the market. On the second day we see weakness after a
strong start, and a close is posted well into the real body of the first
candle. While it is generally not as strong as a Bearish Engulfing Pattern, I
think the close on the second day below the Marabuzo line of the first candle
should at the very least be treated with suspicion if you’re long.
Uses of Candlestick Charts : Chapter 4. Multiple Reversal Patterns : Tag: Candlestick Pattern Trading, Forex : Dark cloud cover, Dark cloud cover pattern, Dark cloud candlestick, Dark cloud cover candlestick, dark cloud pattern, dark cloud candlestick pattern - Dark Cloud Cover