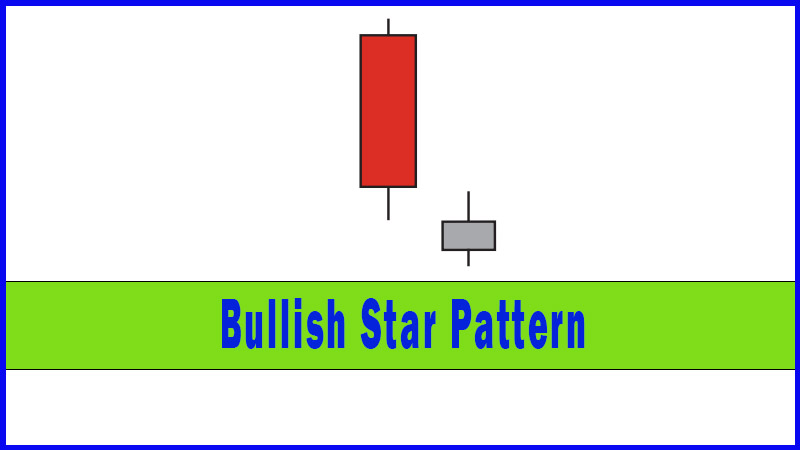
Bearish Star Pattern
Doji star bearish, Evening doji star, bearish shooting star pattern, bearish doji star candlestick pattern, types of bearish candlestick patterns
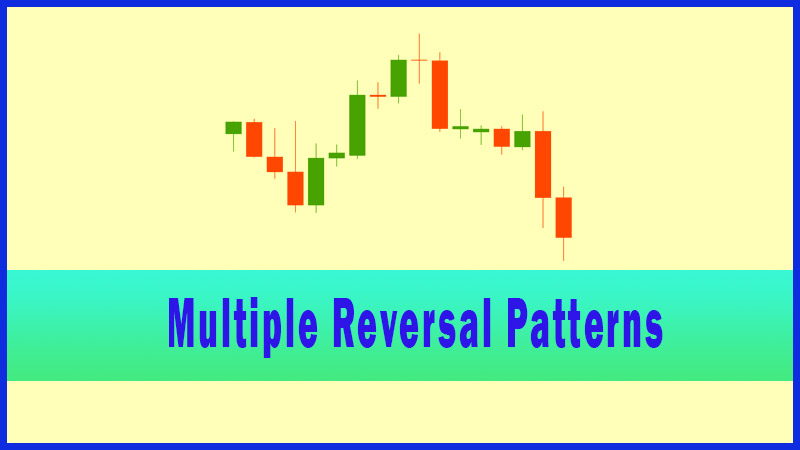
Course: [ Uses of Candlestick Charts : Chapter 4. Multiple Reversal Patterns ]
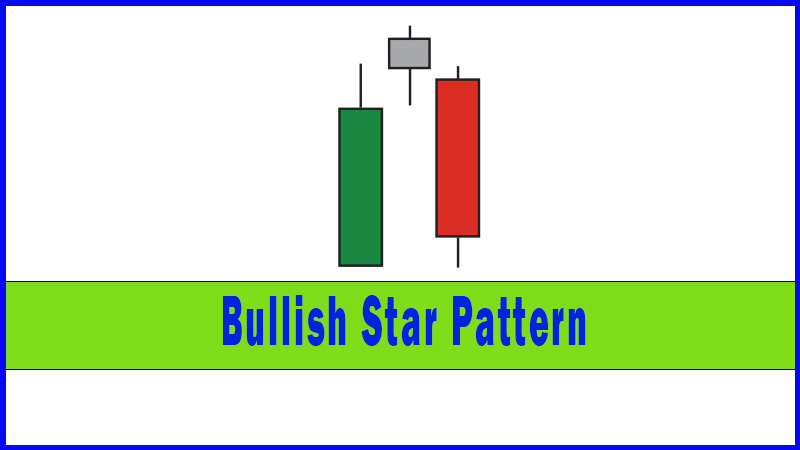
You can also get Stars in bear markets, warning that a down-leg may be cooling off or even reversing, so now we’ll look at the Bullish Star.
Bearish Star properties
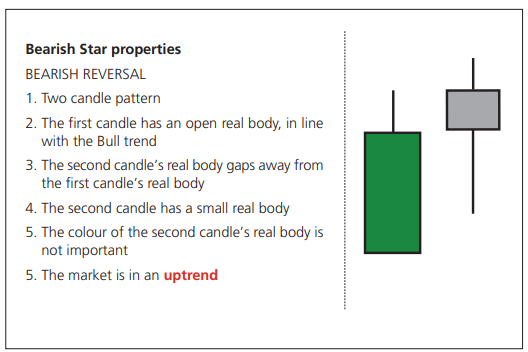
You could
class the Star as a one candle pattern, but I have always been happier to call
it a two candle pattern, and ask that a Star-like candle is posted after a
strong up day. A Star is a small bodied candle that gaps away from a large
bodied candle before it. The real body of the second candle doesn’t have to be
above the first candle’s high, but this makes it more potent.
The point
is that the second candlestick is small of real body, in other words it was a
day where the bulls didn’t beat the bears. It was a pretty even balance between
the two, and all of that after such a promising start.
That’s
the key point behind the Star formation. The open on the second day was higher,
so the bulls had a chance to show their stuff, but they didn’t. We ended up
having a damp squib of a session. It’s almost the same sort of psychology as a
Harami, except this time there was an added bit of bullishness first up in that
there was early promise on day 2. This early promise didn’t translate into
another solid day. The bears did as well as the bulls, and no one won. Have
things changed? Has the balance evened out? Did the bulls mess up what started
out as a really promising session for them? Quite possibly the answer to all of
these questions is “Yes!”
Most
technicians recognize that round numbers can make important psychological
barriers, and therefore form support or resistance levels. I believe that most
find this a bit difficult to grasp, because these round number levels are
surely the sort of thing that only private investors and less sophisticated
investors would be looking at, whereas surely the smart money shouldn’t care
about such frivolities? But be assured, these levels do count for some reason,
so shouldn’t be ignored.
Anyway I
digress. After the day that oil (in the US at least) hit $100 the whole world
was talking about how much higher it could go, but anyone trading Brent who
looked at the daily candlestick chart on that day should have at least
scratched his or her cranium. This is what I wrote the next day:
‘As
you can see from the chart this mixed session left us with a small bodied
candlestick. This should be used as a warning sign of the bull run waning. ’
In the
next section (Evening Star) I’ll come back to this, as there’s a bit more to
say.
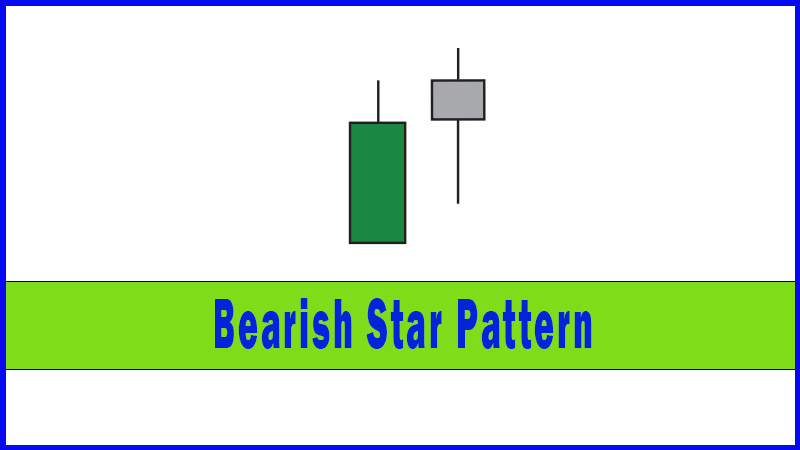
Bearish Star summary
A Bearish
Star is a small bodied candle seen above a large open bodied candle in a rising
market. The small body on the second day shows that despite a promising start
the bulls lost temporary control. We should now be on alert in case this loss
of control becomes a more sustained deal from the bears, i.e, a reversal.
You can
also get Stars in bear markets, warning that a down-leg may be cooling off or
even reversing, so now we’ll look at the Bullish Star.
On the
first trading day of 2008, NYMEX Light Sweet Crude hit $100. The London-based
Brent Crude Oil contract didn’t quite make this mark, trading up to 98.50 on a
day that ended with a small bodied candle that gapped away from the big green
candle before it, or in other words, a Star.
As you
can see the market sold off a bit the next day (which actually engulfed the
previous day), but it took a few more days before things really got going for
the bears and within a few weeks the market had pulled back to 85.00, where a
bounce was seen after a Hammer day.
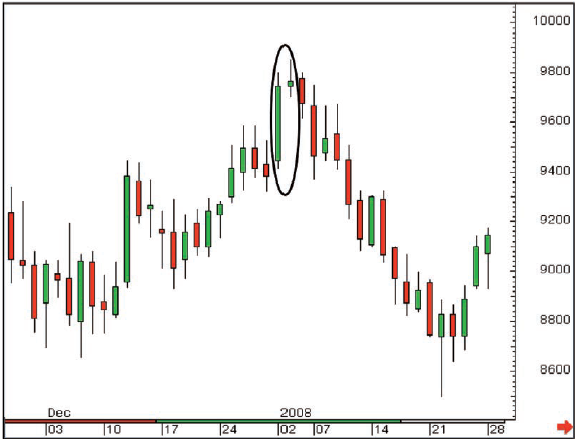
Figure 4-11: ICE Brent Crude Oil
futures (all sessions, unadjusted continuation chart); daily candlestick chart;
28 November 2007 - 28 January 2008
Now
here’s something that I’ve always said about Star days.
What are
the headlines in the press the next day? “Oil hits new all time highs” and “Oil
nudging $100” are the sorts of thing that we would have seen after this day,
all trumpeting from the rooftops that the market is at levels never before
seen, and surely $200 is the next stop!
Uses of Candlestick Charts : Chapter 4. Multiple Reversal Patterns : Tag: Candlestick Pattern Trading, Forex : Doji star bearish, Evening doji star, bearish shooting star pattern, bearish doji star candlestick pattern, types of bearish candlestick patterns - Bearish Star Pattern