Evening Star Pattern
evening star candlestick, evening star candle, evening star candlestick pattern, evening doji star, morning star and evening star pattern
Course: [ Uses of Candlestick Charts : Chapter 4. Multiple Reversal Patterns ]
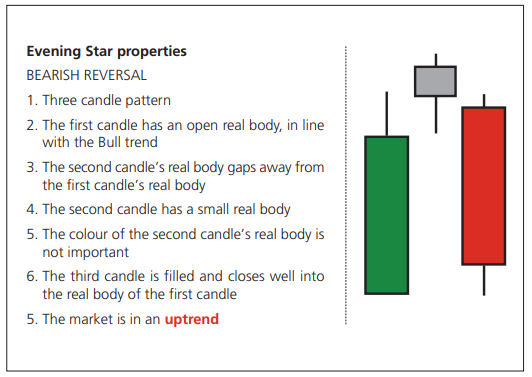
An Evening Star is a three candle pattern, but if you’ve just read the previous few pages, understanding it will be a very simple task, as all we’re doing is adding one more element to a Bearish Star - an immediate confirming candle.
Evening Star Properties
An
Evening Star is a three candle pattern, but if you’ve just read the previous
few pages, understanding it will be a very simple task, as all we’re doing is
adding one more element to a Bearish Star - an immediate confirming candle.
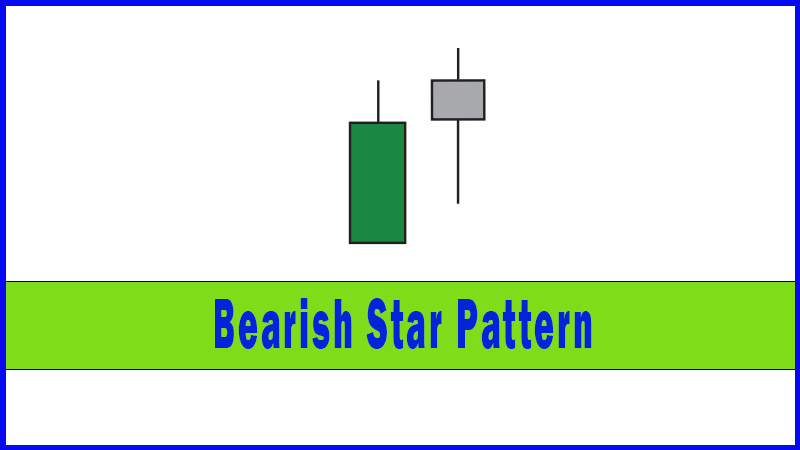
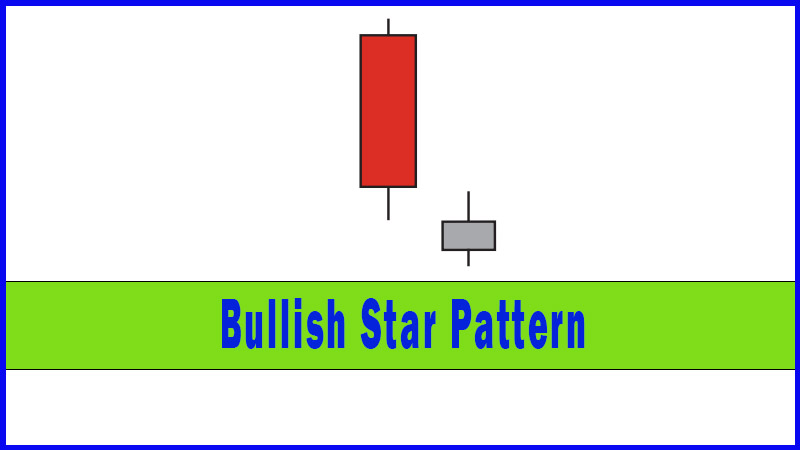
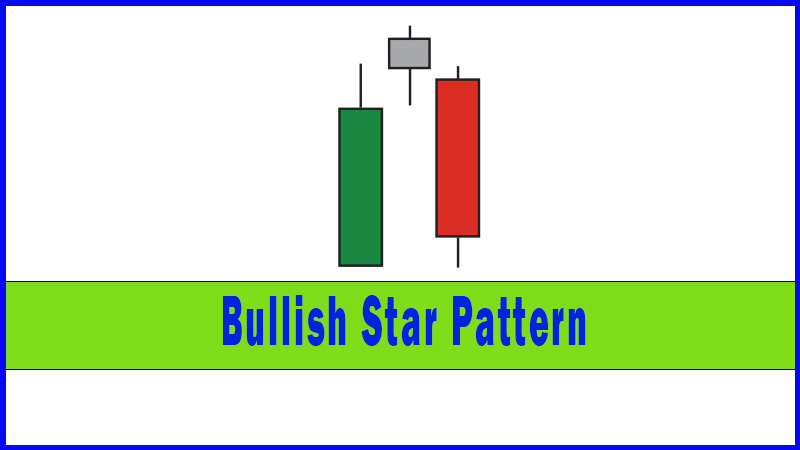
So there
are two candles that make up a Bearish Star - a green candle followed by a
small candle that gaps higher. After a really good start on day two nothing
really happened, and I was raising an eyebrow that the bulls didn’t keep things
going. Then the third day is a big red candle that confirms the suspicions
expressed after the small gap day. The third day sees the market close well
into the real body of the first candle of the three.
Once
again we see that phrase “well into” with regard to the closing value of the
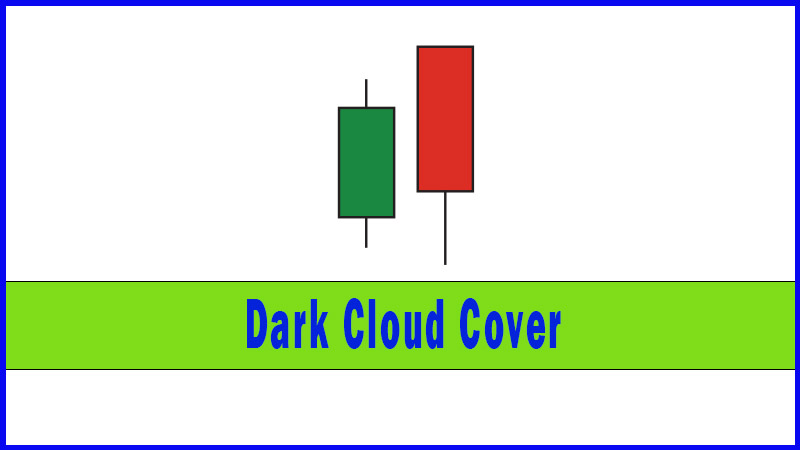
third candlestick. Where have we seen this before? If you go back to the
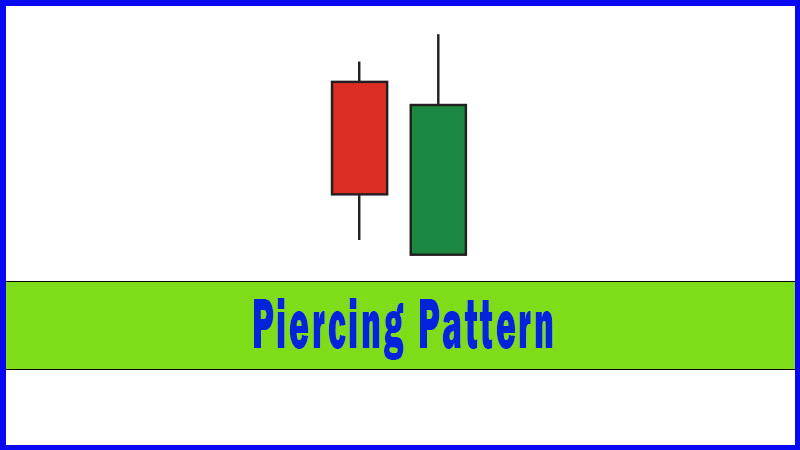
section on Dark Cloud Cover you’ll see that for the formation to be completed
the second candle’s body has to see a close well into the real body of the
first’s. We solve this slight ambiguity by using the Marabuzo line of the first
candle, and the same applies here: we need to see a close on the third day
below the halfway point, or Marabuzo line, of the real body of the first candle
of the pattern.
The
Japanese particularly favour these patterns, and you can see why - there are
three key elements needed to make up the reversal:
1. Initial strength
2. A day of pure indecision despite the market making a new high
3. A session that backs up the indecisiveness of the previous session and confirms that prices had reached levels that were too high!
It is a
recurring theme when you study Japanese charting techniques that the number three
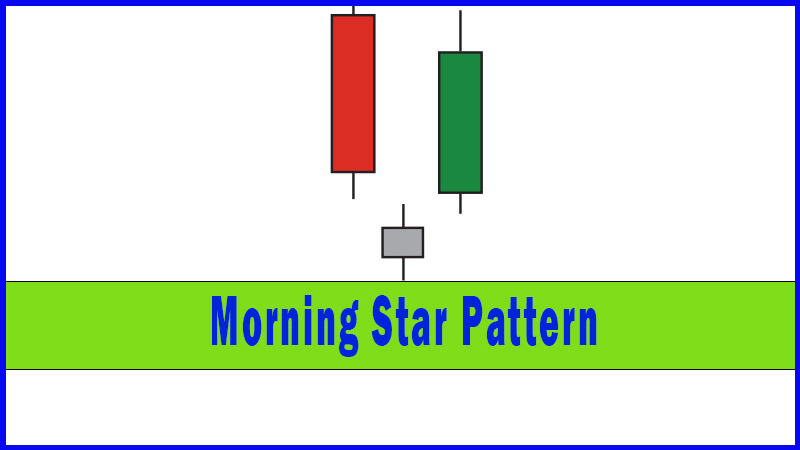
has almost mystical connotations. Maybe this is what makes Evening and Morning
Stars so potent, it’s because they show a reversal occurring over three
different candles. There are many other patterns in candlestick analysis with
“three” in their name: three upside gaps, three red soldiers, rising/falling
three methods, and three Buddha tops and bottoms (akin to the Western Head
& Shoulders pattern).
Examples
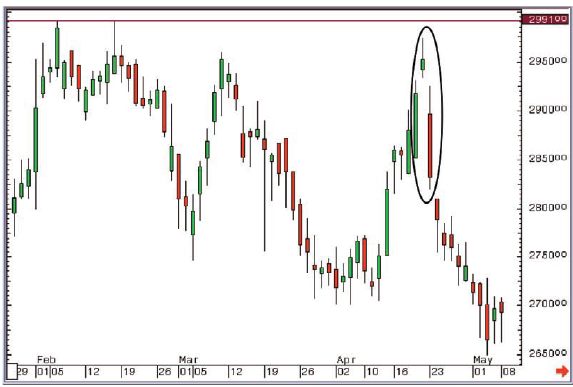
Figure 4-13: Astra Zeneca pic; daily
candlestick chart; 29 January 2007 - 8 May 2007, showing Evening Star on 19,
20, 23 April 2007
You can
see on the left hand side that the market had got to within a whisker of the
psychologically important £30 level on a couple of occasions, but then was
faced with some weakness. The market rallied again though, several times, and
in April saw a run higher that ended with an Evening Star. The day after the
Evening Star had been completed the market gapped lower, and sold off over 5%
in the next 8 sessions - instant gratification!
This
proves something else about these powerful reversal patterns. Even though this
pattern’s formation involved the market selling off just under 5% from the
high, there was still plenty of weakness immediately afterwards to make money
on the short side. It’s never too low to sell, nor - in a rising market - too
high to buy.
Abandoned babies
This illustrates an ideal world
scenario for an Evening Star pattern, with the middle candle sitting pretty on
its own above the rest of the chart. In fact there is a name for a small bodied
candle that sits on the chart after having gapped higher (or lower in a
downtrend, below the rest of the market). It’s called an Abandoned Baby.
This is
one of those patterns where as soon as you start to talk about it you start to
get those “I think he may be losing his marbles” looks.
Variation - no gap on the open of day three
The
cynics among you may argue at this point that we don’t live in an ideal world,
and even when I’m in my most optimistic of moods I have to concur! Nevertheless
as long as we stick to the basic principles, there are several combinations of
candles that can come together and still be classed as an Evening Star. The
following chart shows a variation that I would be happy to call an Evening
Star, even though the market didn’t gap lower on the third day. The important
message about the third session, surely, is where it finished? Even if the
market didn’t gap lower at the start of this session, surely the selling that
followed was enough to make you at least worry that things might be changing?
The psychology of the third session of an Evening Star is all about how far the
sellers took us back into the range of the first day, not where the first trade
of the day may have been.
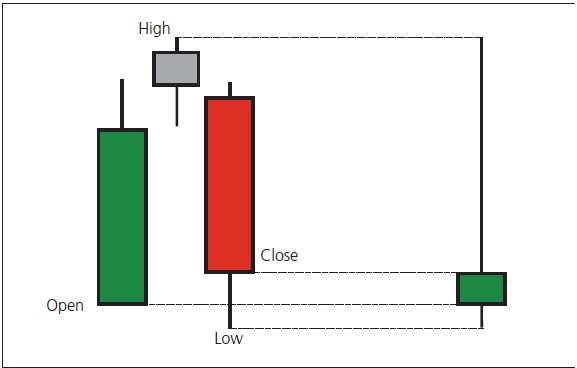
Figure 4-14: Diageo pic; daily
candlestick chart; 9 May 2007 - 3 August 2007, showing variation on an Evening
Star posted on 15, 18 and 19 June
When candle patterns collide
There’s
something else that can be said about the Diageo chart shown in Figure 4-14.
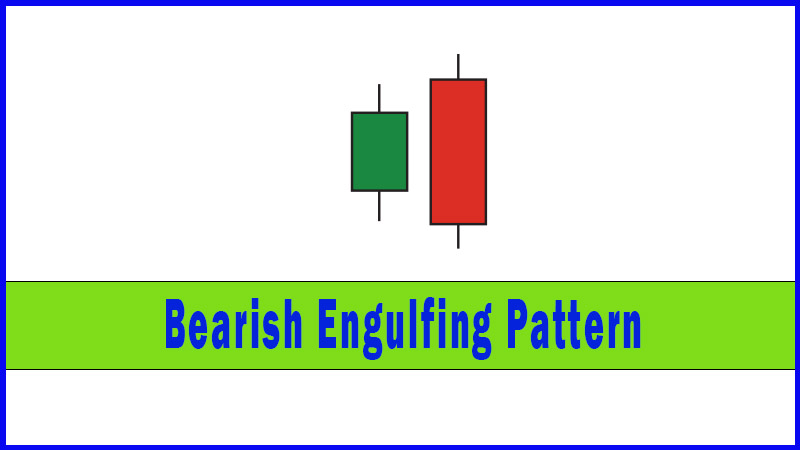
The second and third candles of the Evening Star also combine to form a
variation on a Bearish Engulfing Pattern. Although the real body of the first
candle (of the Engulfing Pattern, the middle candle of the Evening Star) wasn’t
open, the next candle certainly satisfied any criteria for being classed as
Engulfing. You may have noticed that I am sneaking into the text the idea of
adopting some flexibility into the reading of the charts and the patterns. This
is quite deliberate, although there are some observers (particularly the left
brain people) who would strongly disagree with this blurring of the lines.
To those
people I would ask the following question: in a real life situation would you
want to ignore a big sell-off day at a high like the one we can see in the
Diageo chart? This can be classed as an Evening Star, a Bearish Engulfing
Pattern, a Tweezer Top or a Bearish Belt Hold Line to name but a few!
Maybe
though, the point isn’t what we should call it, but what we would do about it
in a live situation, and whichever way you look at it, it wasn’t the best of
sessions for the bulls. It came right on a high, it was a big down day, and it
didn’t take long for the market to start to confirm it subsequently. If you
were long and you allowed the bearish candles to signal some lightening up of
your position, you would have been delighted. If you had sold the market short
after the formation of the pattern you would have only been showing a loss for
a short period of time during the subsequent session.
Merging candles
If you
are in a strong downtrend you will likely see a fair few big down days posted,
with large filled real bodies. If after one of these the market opens
significantly lower but then does nothing for the rest of the day, this lack of
reaction can be taken as a warning signal that the selling is stalling.
So we can
see that the Star patterns that work the best are the ones where there’s
confirmation subsequently, which sets the scene nicely for the next pair of
patterns: the Morning and Evening Stars.
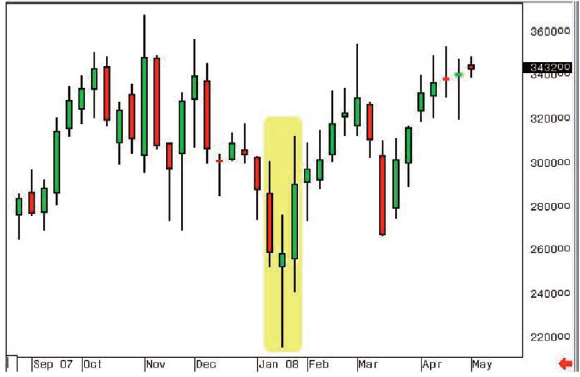
Figure 4-15: Three candles that make up
an Evening Star, when merged together form a Shooting Star
Evening Star summary
An
Evening Star is a powerful reversal pattern seen in a rising market. It is
comprised of three candles. The first is a bullish day, the second is a Star
with indecision rife despite the early promise. This indecision turns into
outright bearishness on day three, which is why this is such a powerful
reversal, and so closely watched by the Japanese.
You may
have an idea where we’re going to go next on our trawl through the candlestick
patterns. What happens when a Bullish Star formation is backed up by a strong
day the next day? You’ve got it!
Uses of Candlestick Charts : Chapter 4. Multiple Reversal Patterns : Tag: Candlestick Pattern Trading, Forex : evening star candlestick, evening star candle, evening star candlestick pattern, evening doji star, morning star and evening star pattern - Evening Star Pattern