Bullish Harami
bullish harami pattern, bullish harami candlestick pattern, bullish harami candle, bullish harami and bearish harami
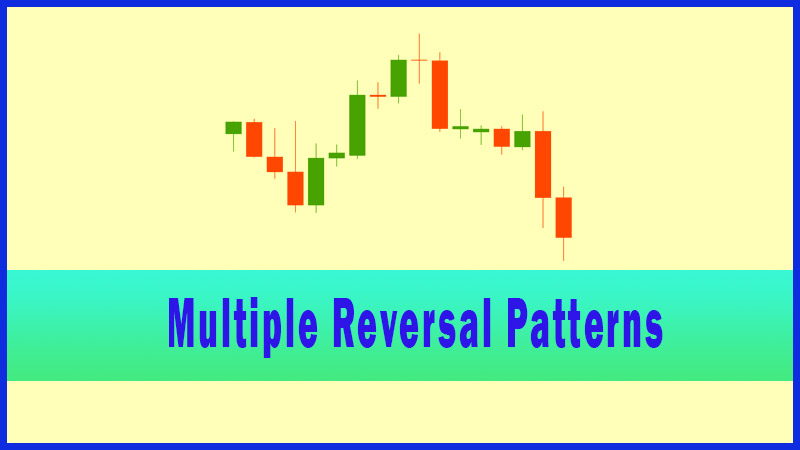
Course: [ Uses of Candlestick Charts : Chapter 4. Multiple Reversal Patterns ]
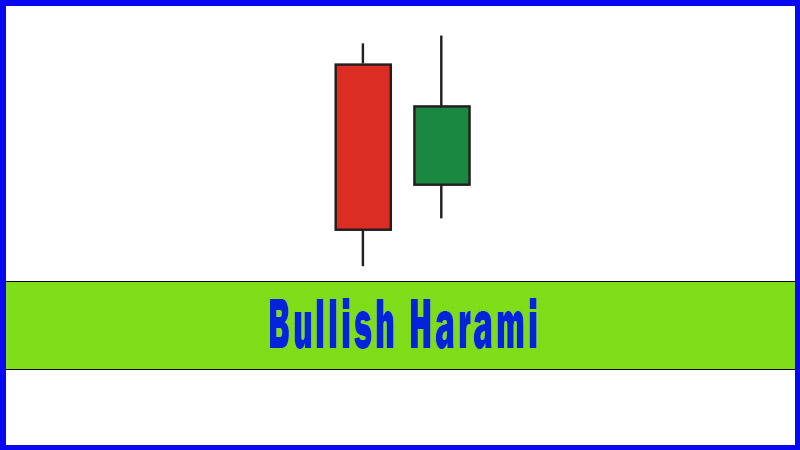
The next pattern we’re going to look at is the Harami, which translates into English as “pregnant”. The reason the Harami is so named is because the pattern involves two candles, one of which is contained within the other.
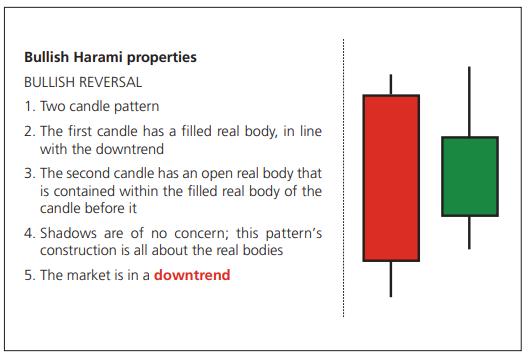
Bullish Harami Properties
The next
pattern we’re going to look at is the Harami, which translates into English as
“pregnant”. The reason the Harami is so named is because the pattern involves
two candles, one of which is contained within the other.
There are
two types of Harami: bullish and bearish. We’re going to start with the bullish
version.
You know
the routine by now, and hopefully you’re already a step ahead of me in that
you’re already looking at our two candles and working out the price action
involved, and how this direction of travel combines to suggest a reversal.
On the
first day of our two candle pattern the market sells off, which is absolutely
no surprise to man nor beast, as we’re in a downtrend, and this is a pretty
normal occurrence. What happens on the open of the second day is an instant
clue to the potential reversal, as the market starts higher, within the
previous day’s range. This second session finishes with a smaller real body
than the first day, although it is the opposite colour. So our green real body
is contained within the red real body before it. Okay, so not much happened in
the second session, but this in itself is better than what occurred the day
before, and it shows that there’s a potential change in the balance of power.
As a rule
of thumb the Harami isn’t the strongest of reversal patterns and you’d look for
a bit more confirmation than with other patterns that we’ve already discussed.
The reason the Harami gets such good airplay is that it’s quite a common
pattern.
Below is
an example of a Bullish Harami in action in the Long Gilt. I saw the pattern
(the candles circled at point D) and flagged it, but decided to wait until the
market got through gap resistance overhead at 103.70 before I really believed
in the idea that the pattern was reversing.
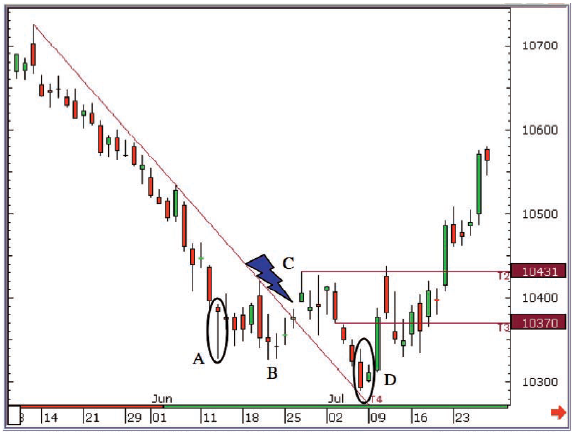
Figure 4-9: LIFFE Long Gilt futures
(adjusted active continuation); daily candlestick chart; 9 May 2007 - 27 July
2007, showing Bullish Harami Pattern on 6 and 9 July 2008
We’d
already been bitten once thinking that this one had reversed. If you look to
the left of our Harami you’ll see the Hammer pattern posted on 13 June (A).
Subsequent to this the Hammer’s low was held with a couple of small-bodied
sessions at point B.
A few
days later trend resistance was broken at point C (the thunder flash!) At this
point it looked like the bulls were waking up, but again there was a failure to
follow through and prices subsequently headed lower, until the Bullish Harami
was posted at point D. At this point we needed to see the market take out the
gap resistance at 103.70, which it did the next day, but the up-move only
really got going after 104.31 was broken, which is the high at C.
Bullish Harami Pattern summary
A Bullish Harami Pattern is seen during a down-trending market and is made up of two candles. The first is a filled candle in line with the downtrend. The second is a candle with an open real body that sits within the confines of the filled real body of the first candle. The brakes have been put on the down-leg and although the second day doesn’t show a strong reaction higher we have been warned and can now be more alert to any subsequent moves to a bull trend. It is often described as a mirror image of the Engulfing Pattern, but is generally nothing like as powerful. Not one of my favourites, but can be a good warning signal.
Uses of Candlestick Charts : Chapter 4. Multiple Reversal Patterns : Tag: Candlestick Pattern Trading, Forex : bullish harami pattern, bullish harami candlestick pattern, bullish harami candle, bullish harami and bearish harami - Bullish Harami