Define Trends with Detail
chart trend patterns, chart trend, chart trendline, chart trending up, chart trending down, trend analysis
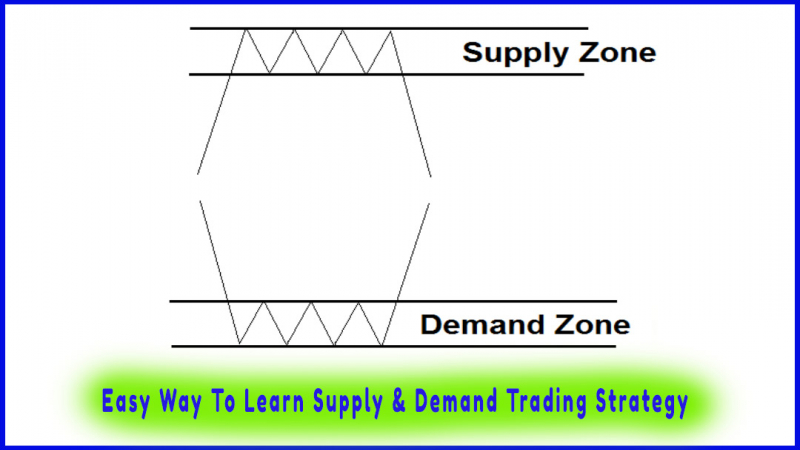
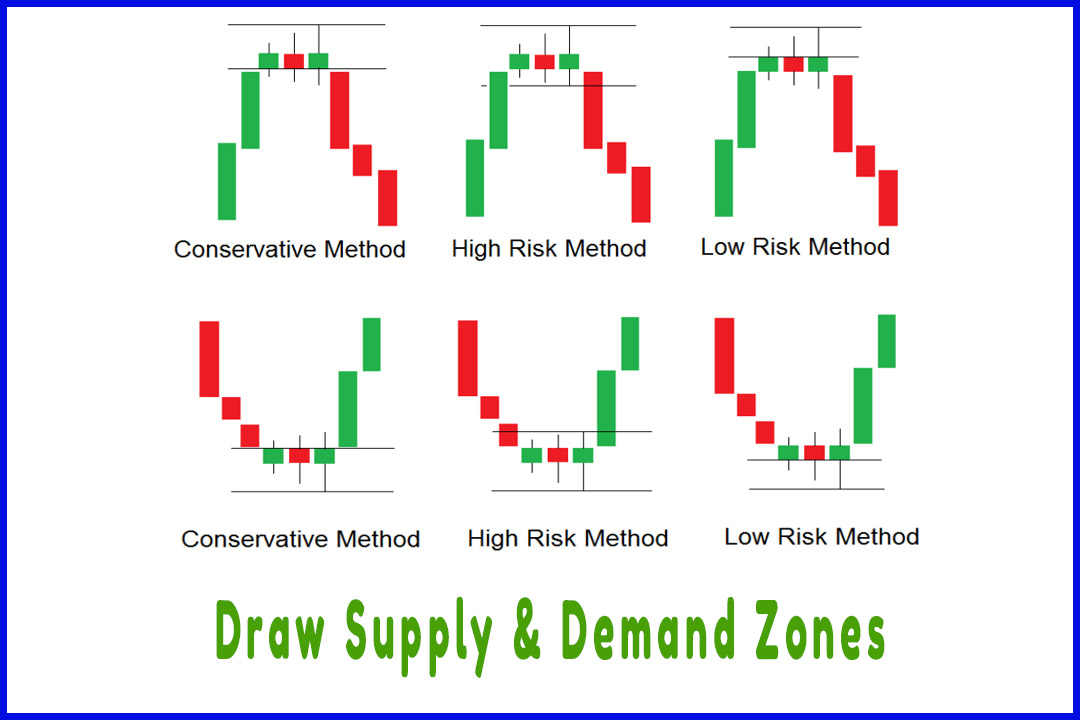
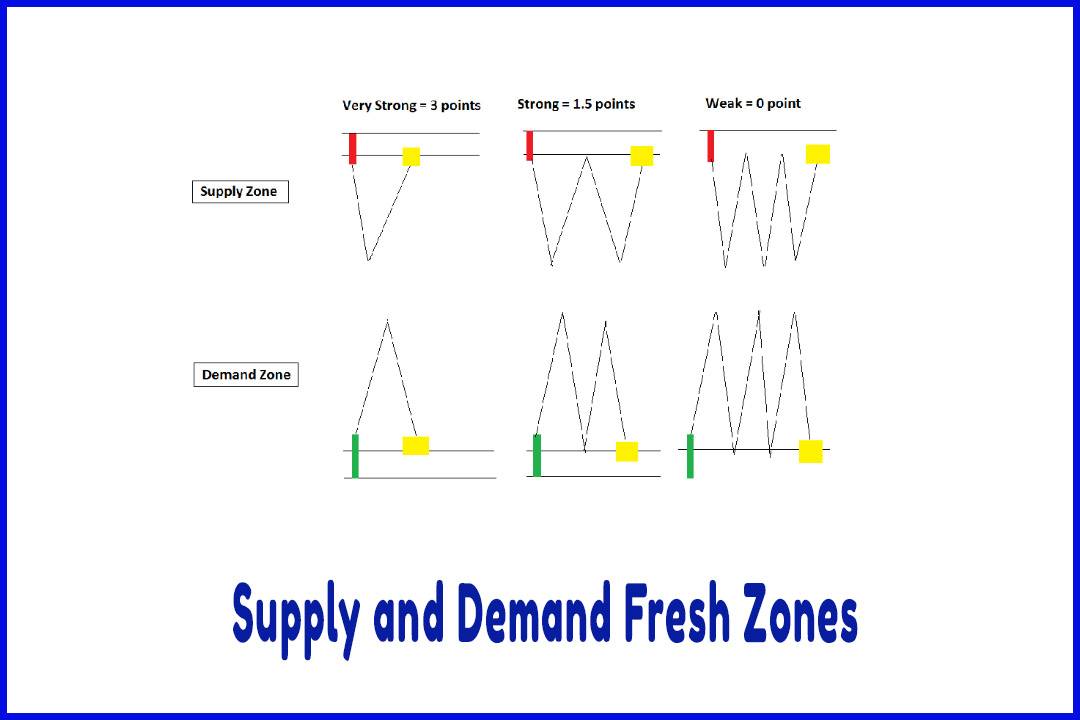
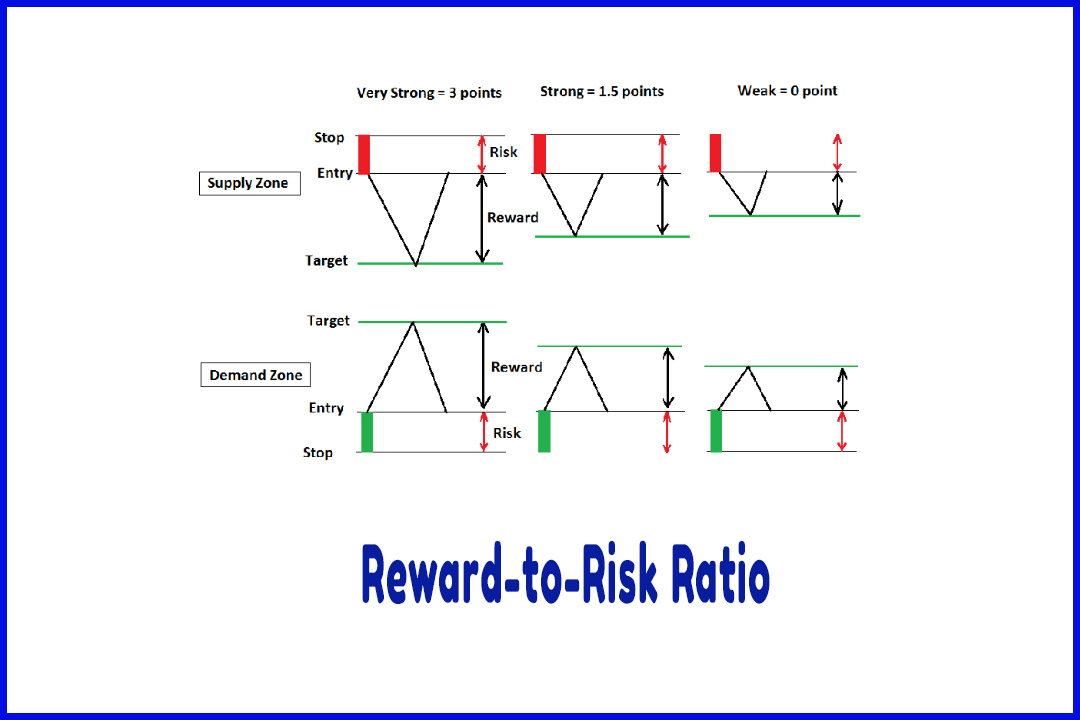
Course: [ Easy Way To Learn Supply & Demand Trading Strategy : Supply and Demand Trading Strategy ]
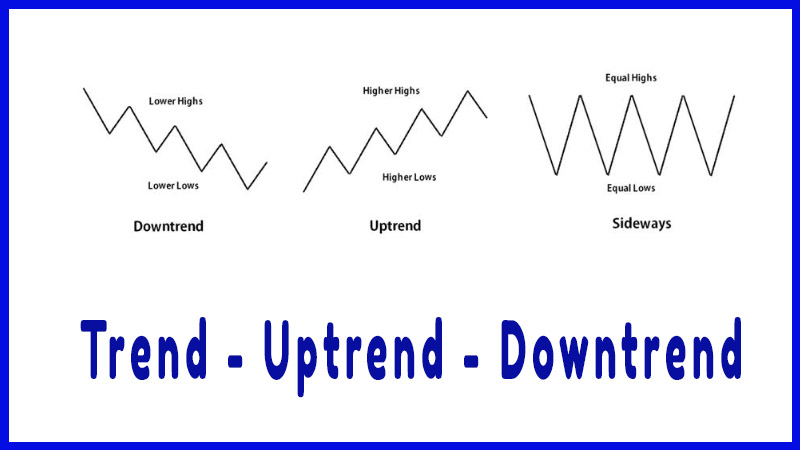
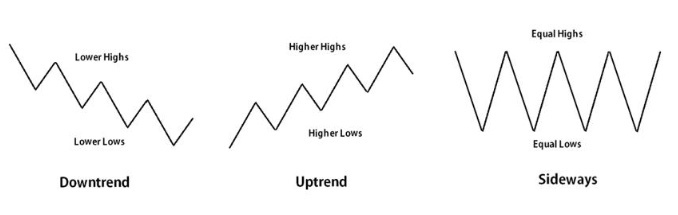
The trend on a price chart can be quite challenging since every trader has a way of drawing the trend line. This is why it is considered one of the most controversial topics in technical analysis.
Trends
As easy
as it seems, finding the trend on a price chart can be quite challenging since
every trader has a way of drawing the trend line. This is why it is considered
one of the most controversial topics in technical analysis.
The
definition of a trend is a series of higher lows for an uptrend and lower highs
for a downtrend. When the trend forms a series of equal highs and lows, the
trend is sideways.
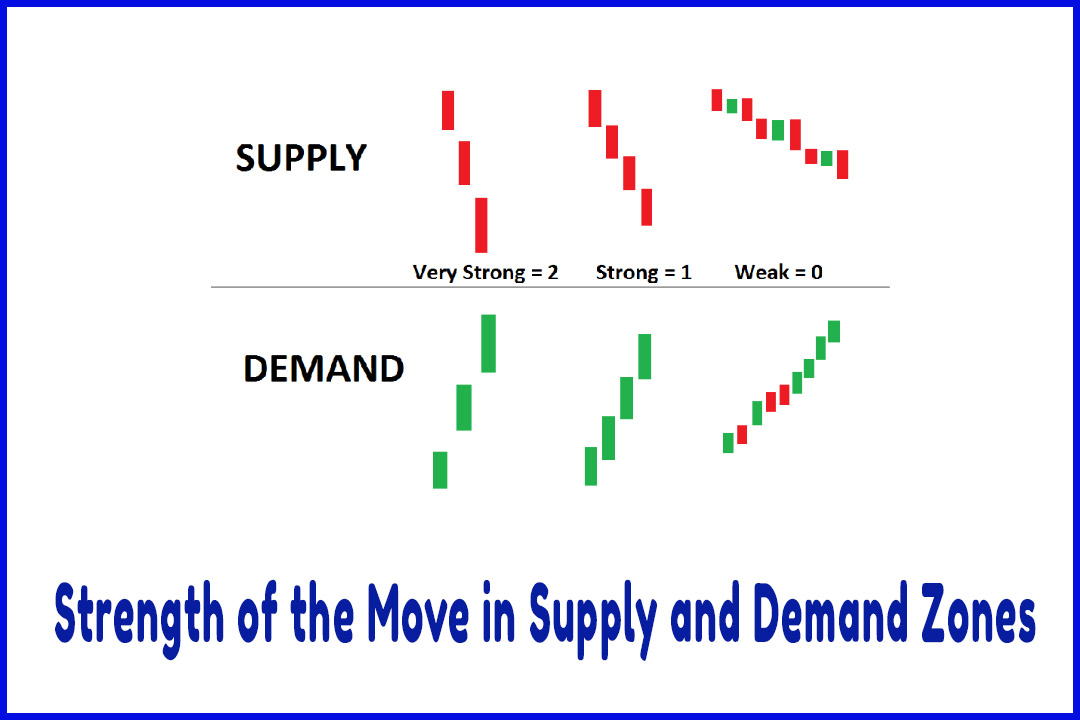
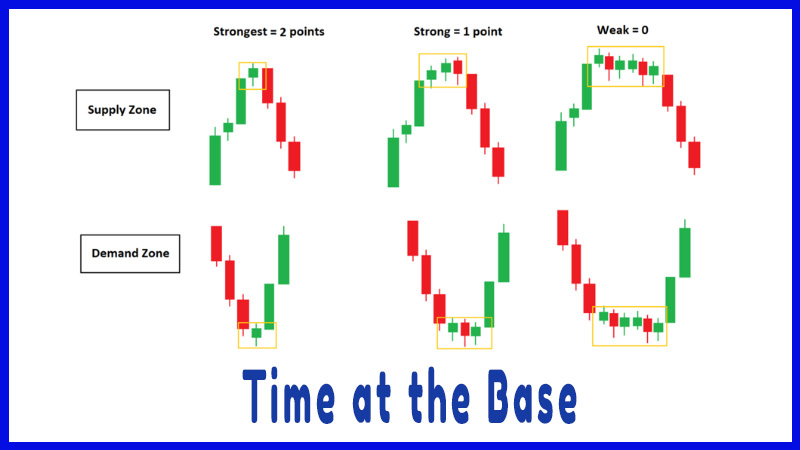
When
trading supply and demand, the trend is determined based on how many zones are
violated or respected.
During an
uptrend, the price creates new demand zones and cancels out opposing supply
zones.
During a downtrend,
new supply zones are created, and opposing demand zones are canceled out.
During a
sideways trend, both supply and demand zones are respected.
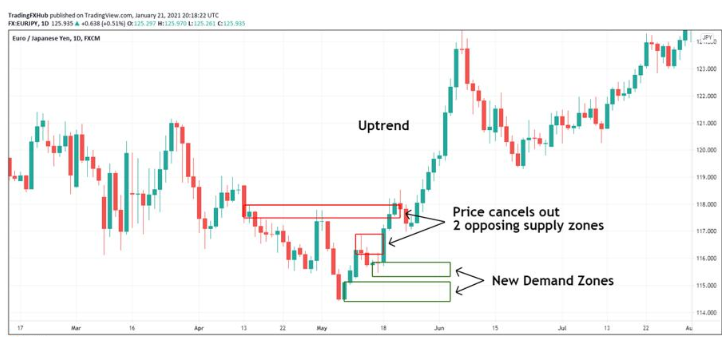
Uptrend
During an
uptrend, the price creates new demand zones and cancels out two opposing supply
zones.
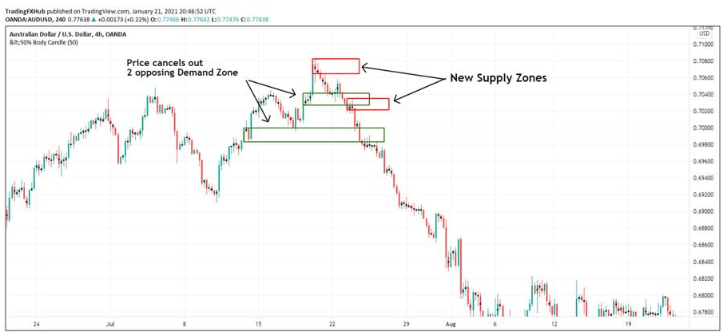
Downtrend
During a
downtrend, the price creates new supply zones and cancels out two opposing
demand zones.
Sideways
During a
sideways trend, the price cancels out one opposing zone and respects the other
one.
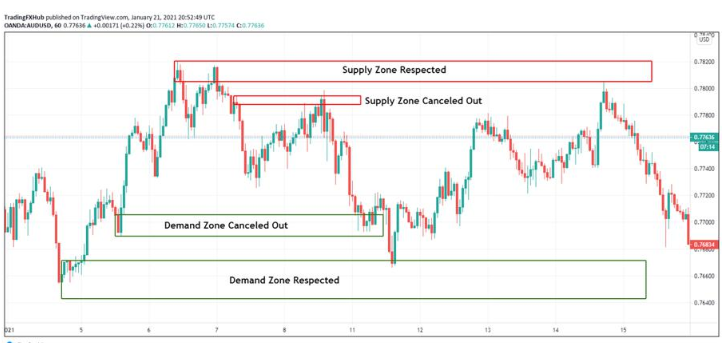
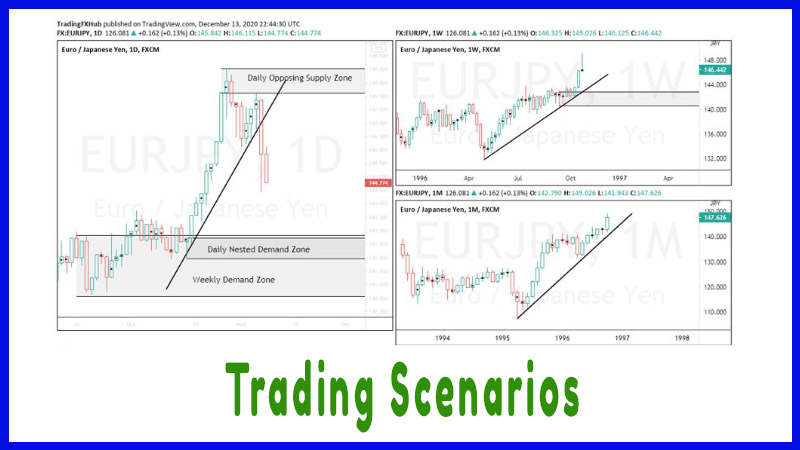
On this
chart, we can see that price is moving sideways. One demand zone is canceled
out as price declines but the second one is respected.
Easy Way To Learn Supply & Demand Trading Strategy : Supply and Demand Trading Strategy : Tag: Supply and Demand Trading, Forex : chart trend patterns, chart trend, chart trendline, chart trending up, chart trending down, trend analysis - Define Trends with Detail