Strength of the Move in Supply and Demand Zones
strong move in Supply Zone, weak move in Demand Zone, strong bearish candles, how the price dropped
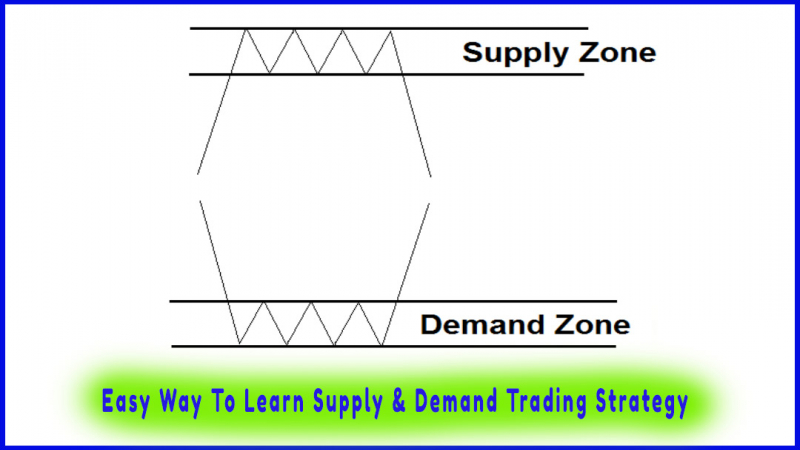
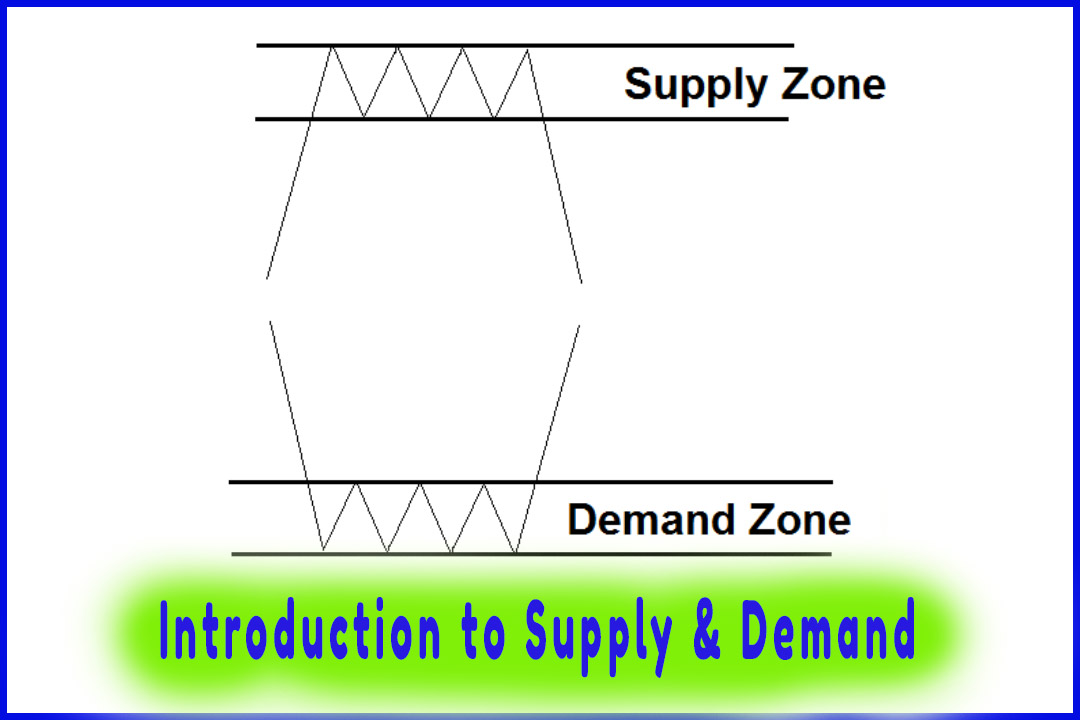
Course: [ Easy Way To Learn Supply & Demand Trading Strategy : Supply and Demand Trading Strategy ]
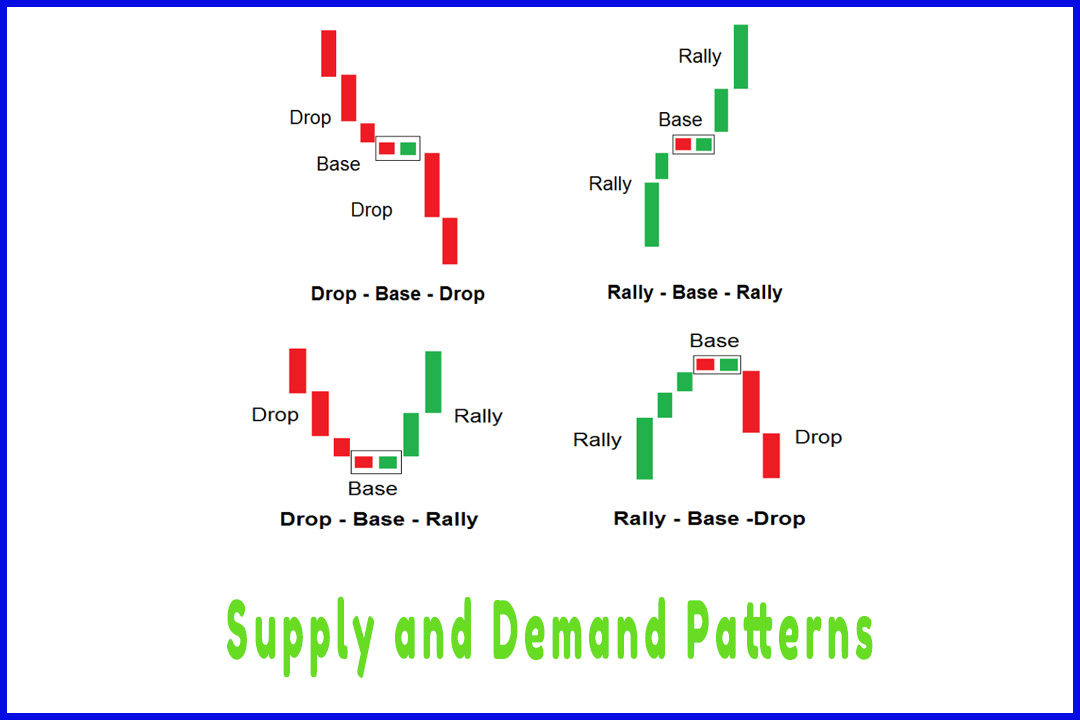
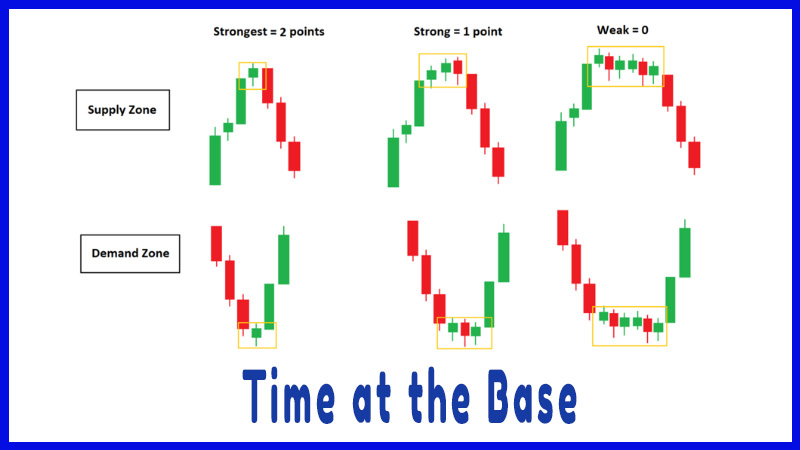
The first odd enhancer looks at the strength of the move out of the basing structure. In other words, we look at how the price left the supply or demand zone. A strong move has long big candles and sometimes gaps are formed as price leaves the zone.
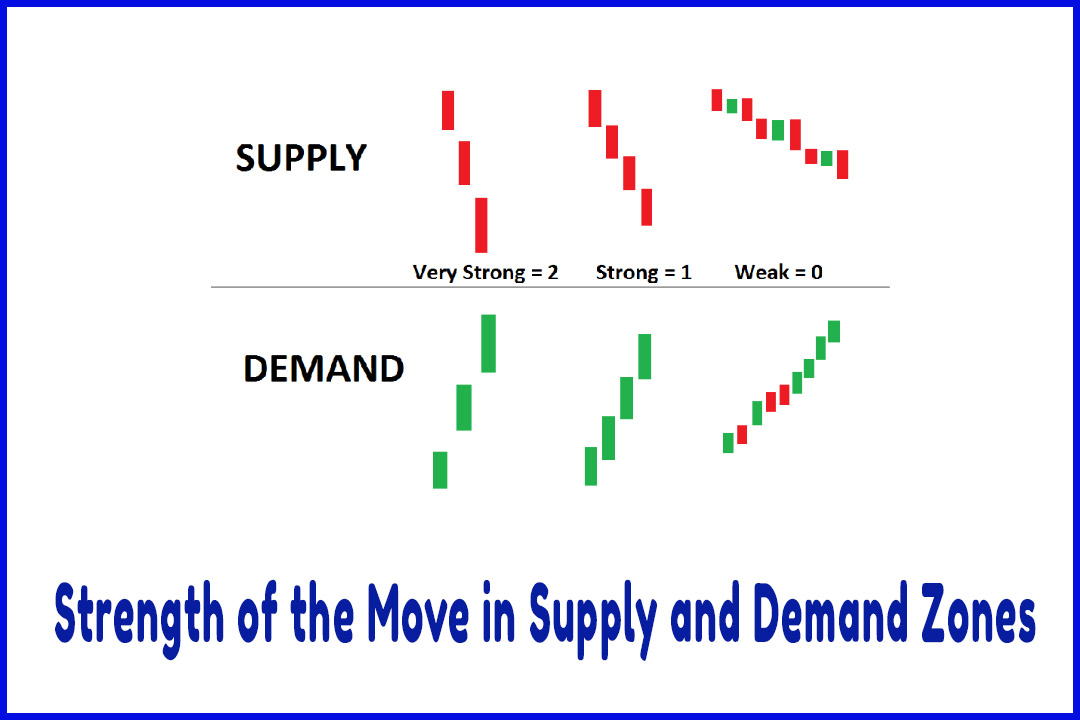
Odd Enhancer 1: Strength of the Move
The first
odd enhancer looks at the strength of the move out of the basing structure. In
other words, we look at how the price left the supply or demand zone. Was it a
strong move or a weak move?
A strong
move has long big candles and sometimes gaps are formed as price leaves the
zone.
A weak
move has many small candles and the drop or the rally doesn’t go far from the
zone itself.
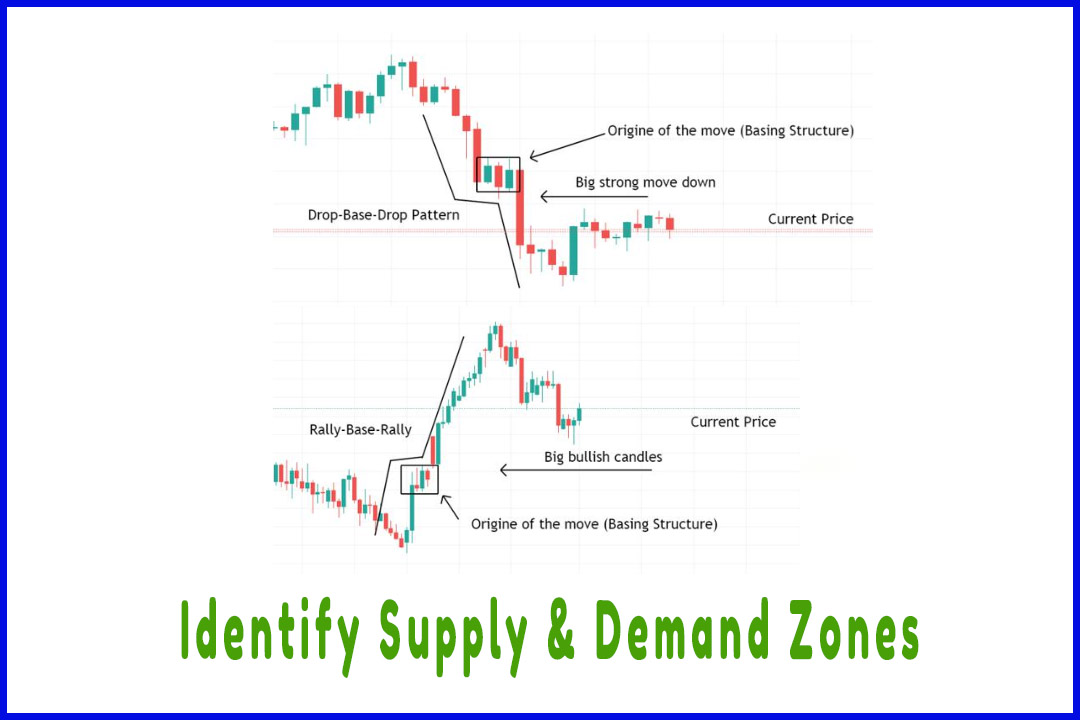
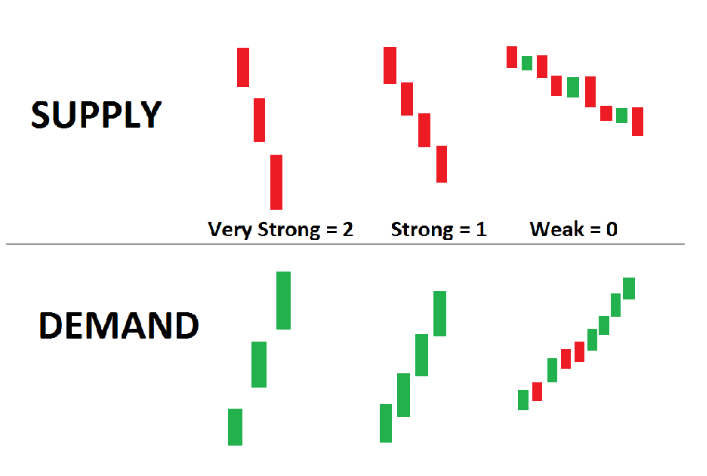
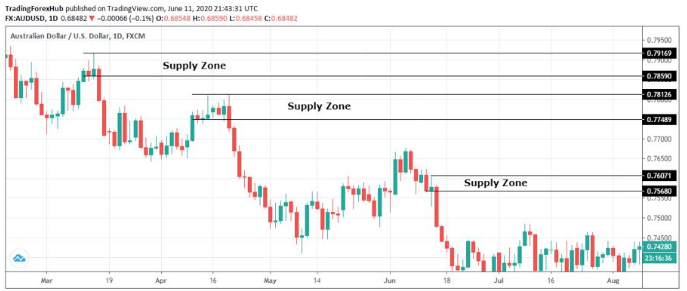
On the
chart below, the price left the supply zones with strong bearish candles to the
downside making them very strong zones to trade. This shows how great the
imbalance is in these supply zones.
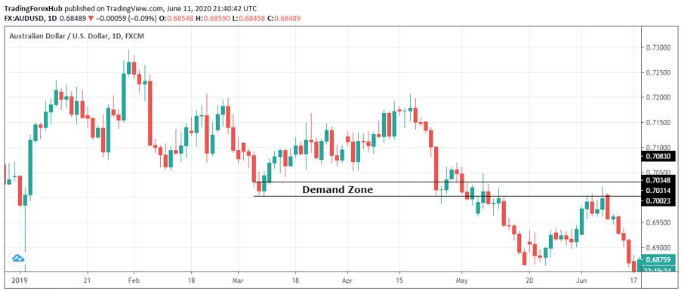
Now,
let’s take a look at an example where the move out of the base zone is weak.
The demand zone is considered weak because the price left the zone with small
candles.
The move
out of the demand zone is weak. We should avoid trading weak zones because the
price will ignore them and keep going.
Using
this odd enhancer, we can give a maximum score of 2 points.
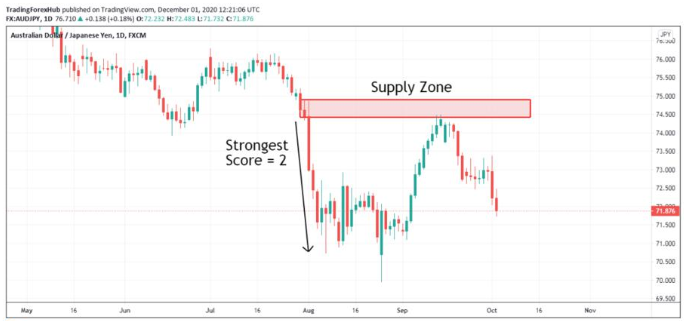
In this
example, we have a supply zone where price left the zone with strong big
candles. This zone shows a high probability of success because of the strength
of the move out of the basing structure.
The score
we’ll give to this supply zone is 2 points.
Notice
how the price dropped when it returned to test the zone.
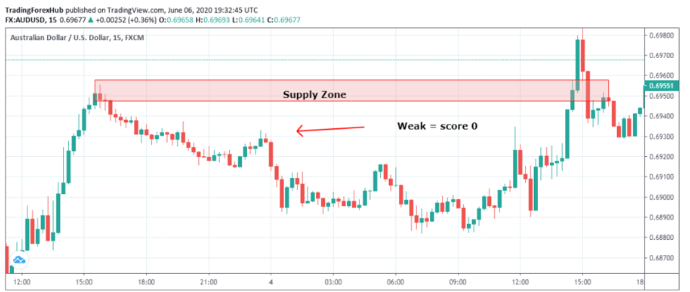
The
next chart shows a weak supply zone where price left the supply zone with weak
and small candles. This shows how the imbalance is at this price level.
Weak
departure means that no more unfilled orders are left to be traded and the
sellers are losing interest in selling at this price level. Soon, they will be
outnumbered by buyers that will take control of the market and move prices
higher beyond this supply zone.
Easy Way To Learn Supply & Demand Trading Strategy : Supply and Demand Trading Strategy : Tag: Supply and Demand Trading, Forex : strong move in Supply Zone, weak move in Demand Zone, strong bearish candles, how the price dropped - Strength of the Move in Supply and Demand Zones