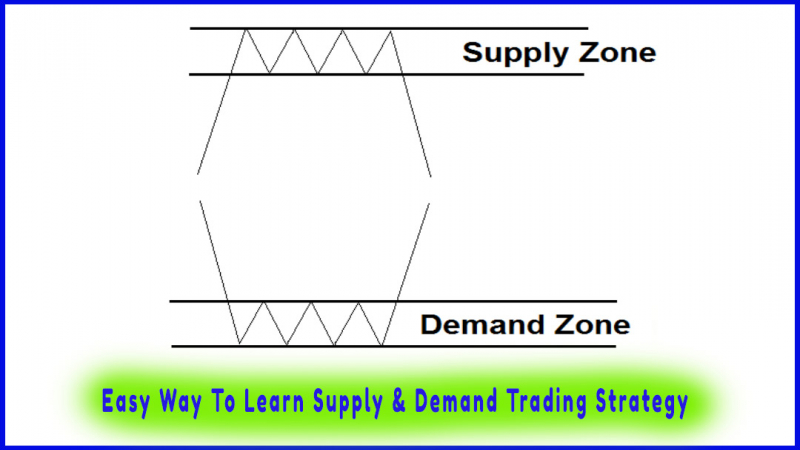
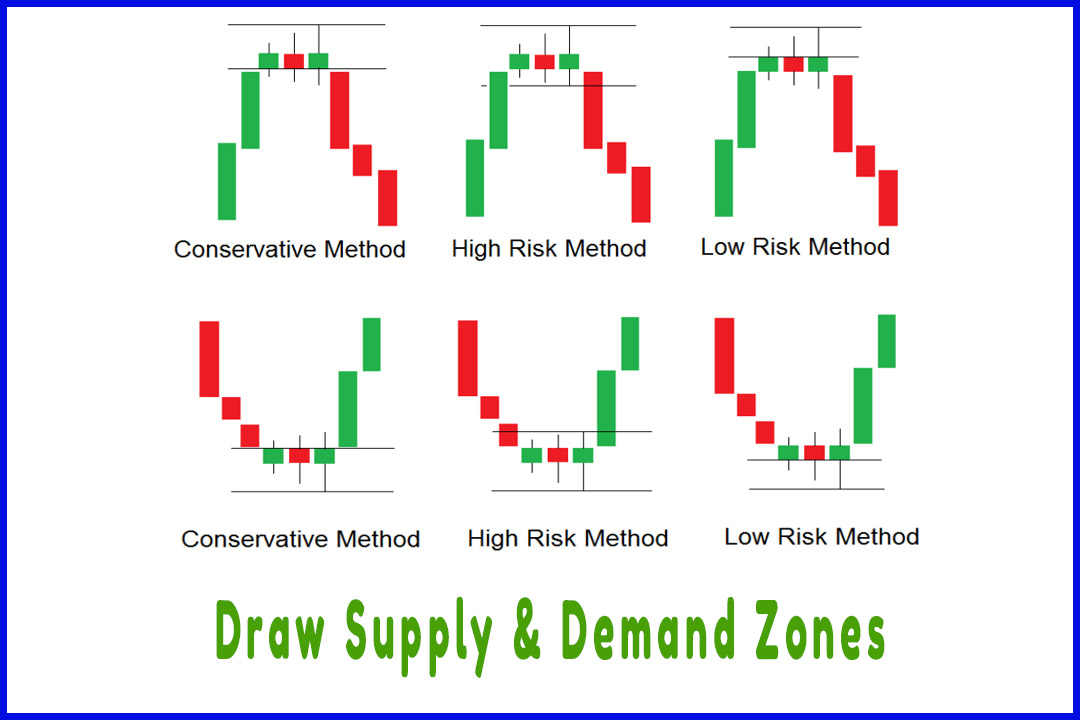
Time at the Base on Supply and Demand Zone
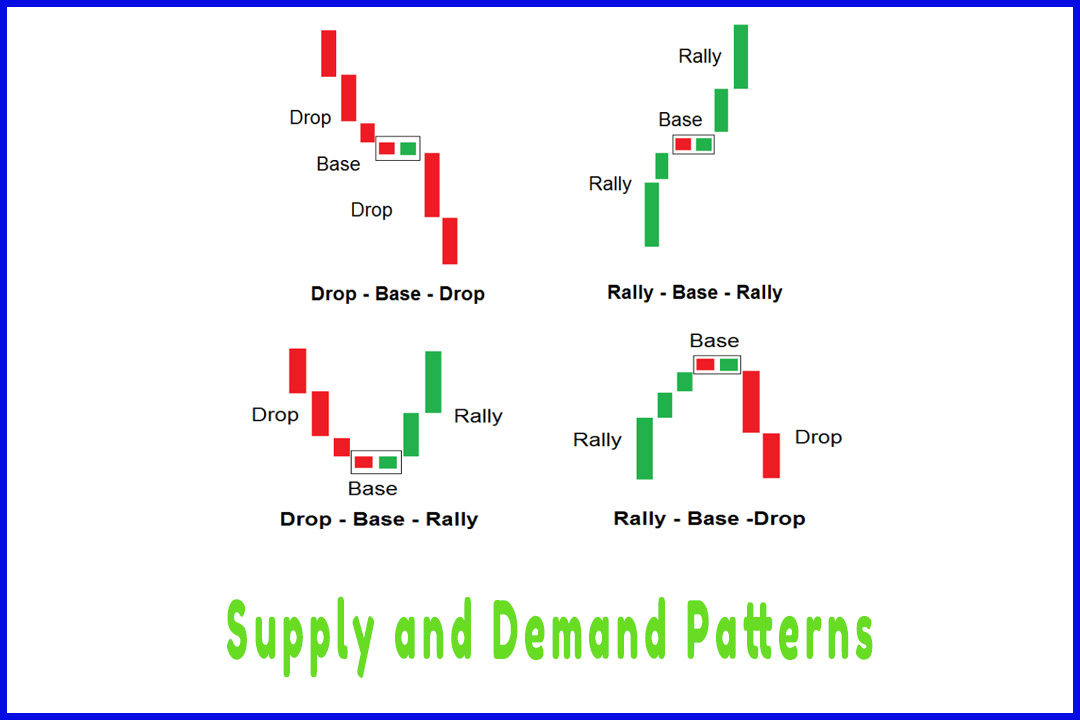
Strong candlestick pattern, Single candle dropdown, Rally base Rally, Drop base drop, Best supply zone, Best Demand zone
Course: [ Easy Way To Learn Supply & Demand Trading Strategy : Supply and Demand Trading Strategy ]
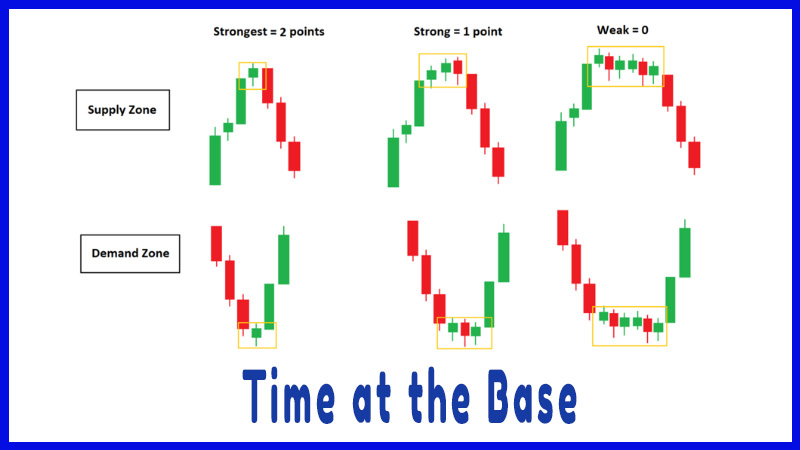
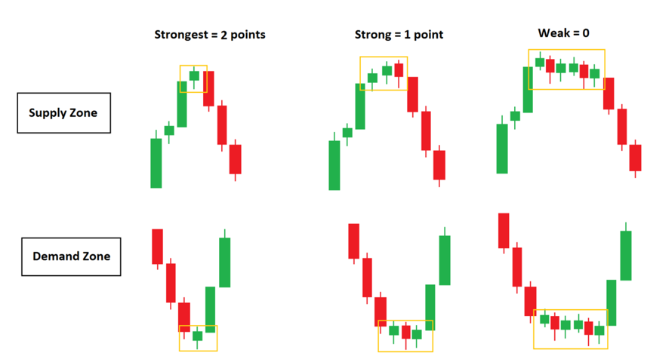
We look at how many candles are in the basing structure. In general, the best zones have between 1 to 6 candles in the base. Beyond 6 candles, the zone is considered weak and the price might ignore it and therefore, resulting in a losing trade.
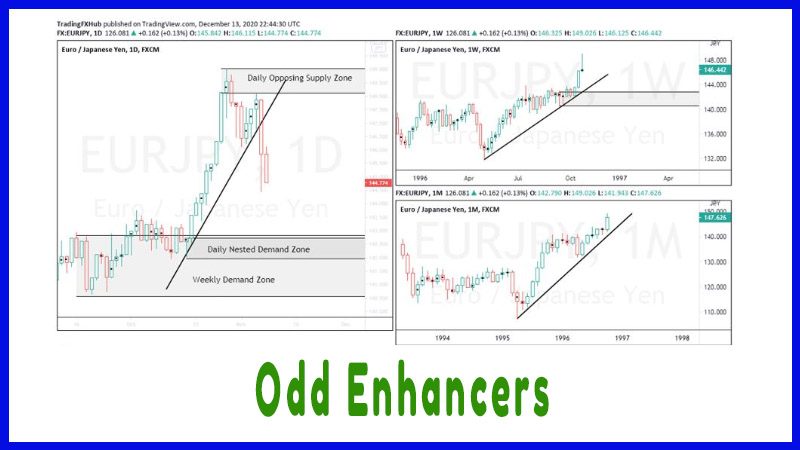
Odd Enhancer 2: Time at the Base
We look
at how many candles are in the basing structure. In general, the best zones
have between 1 to 6 candles in the base. Beyond 6 candles, the zone is
considered weak and the price might ignore it and therefore, resulting in a
losing trade.
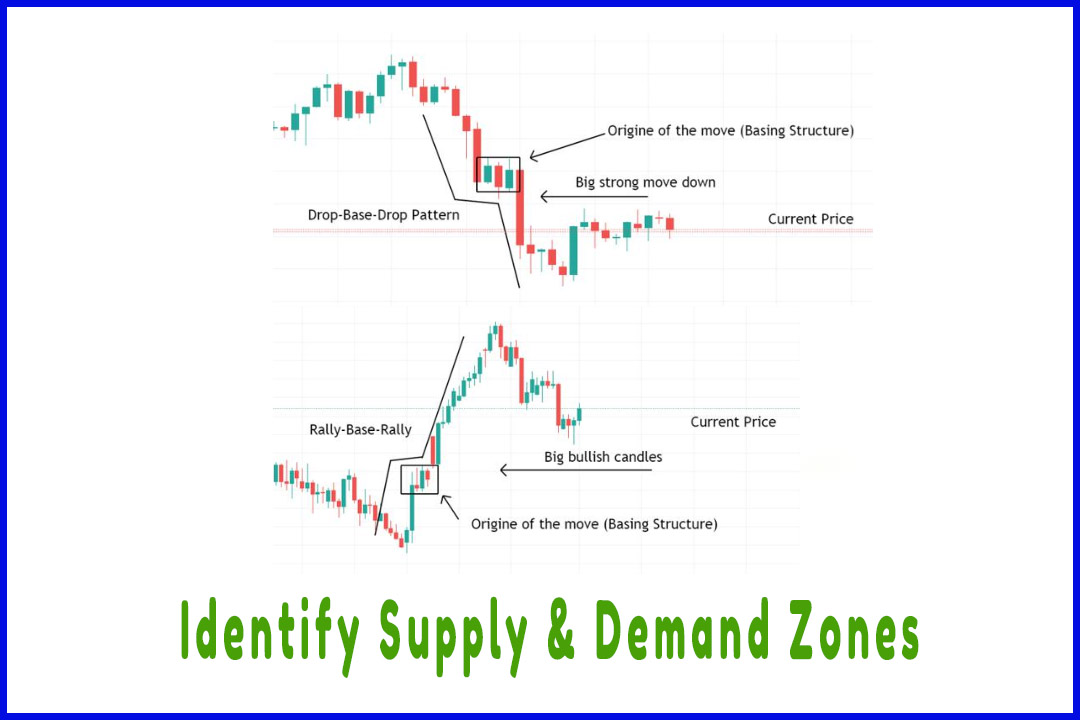
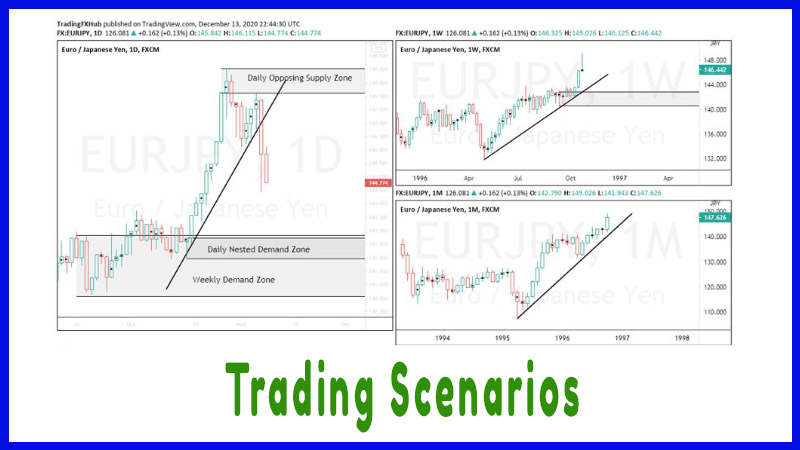
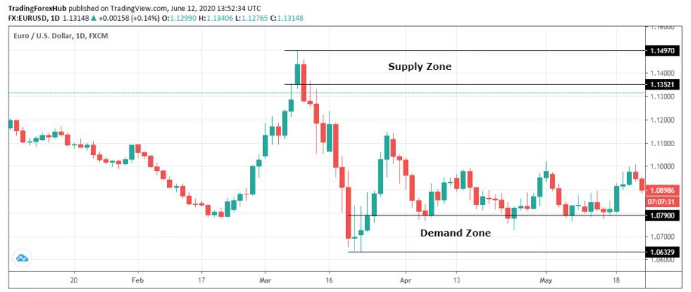
On the
next chart, we have a rally-base-drop with one basing candle at the supply
zone. This is a very strong basing structure.
For the
demand zone, the price spent a little more time and created three candles at
the basing structure.
Another
thing to consider when analyzing the basing candles is the tails or the wicks.
Basing candles with long wicks are a sign of a weak zone.
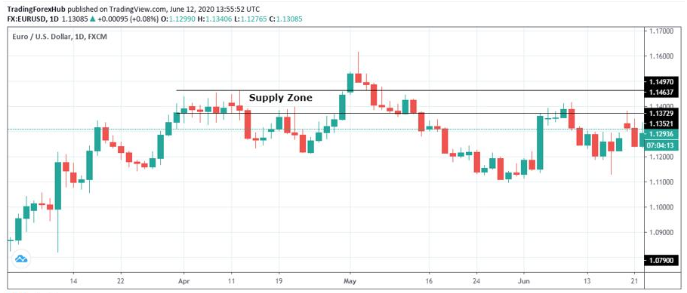
In the
next example, the price spent too much time at the base creating more than six
candles. Therefore, this supply zone is considered weak. Look how price
retested the zone and broke above it.
Using
this odd enhancer we can give a maximum score of 2 points.
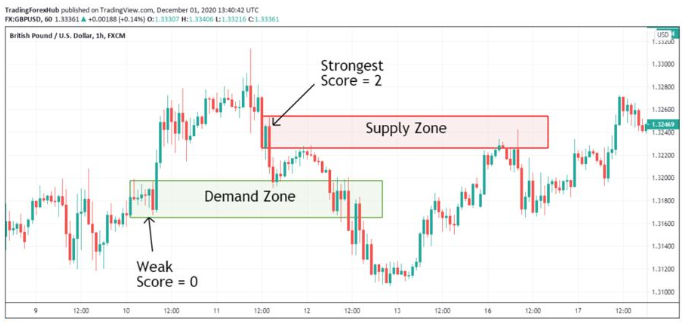
Here’s an
example where we have a demand zone with too many candles at the base. This is
a weak zone because the price did react to it but failed to move higher and
finally went through the zone to look for another demand imbalance.
The score
for this demand zone is zero.
The
supply zone above, on the other hand, is strong because we have one candle at
the base. Price did return to the supply zone and dropped giving us a great
profit margin before it returned for the second time to test the supply again.
The score
for this supply zone is 2.
Easy Way To Learn Supply & Demand Trading Strategy : Supply and Demand Trading Strategy : Tag: Supply and Demand Trading, Forex : Strong candlestick pattern, Single candle dropdown, Rally base Rally, Drop base drop, Best supply zone, Best Demand zone - Time at the Base on Supply and Demand Zone