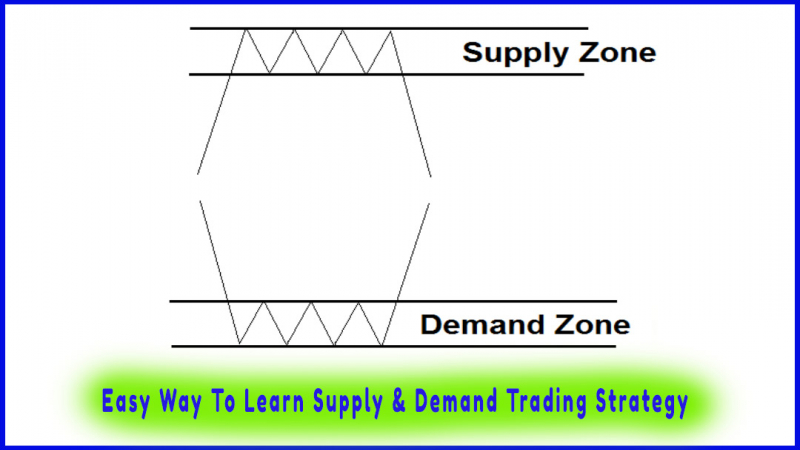
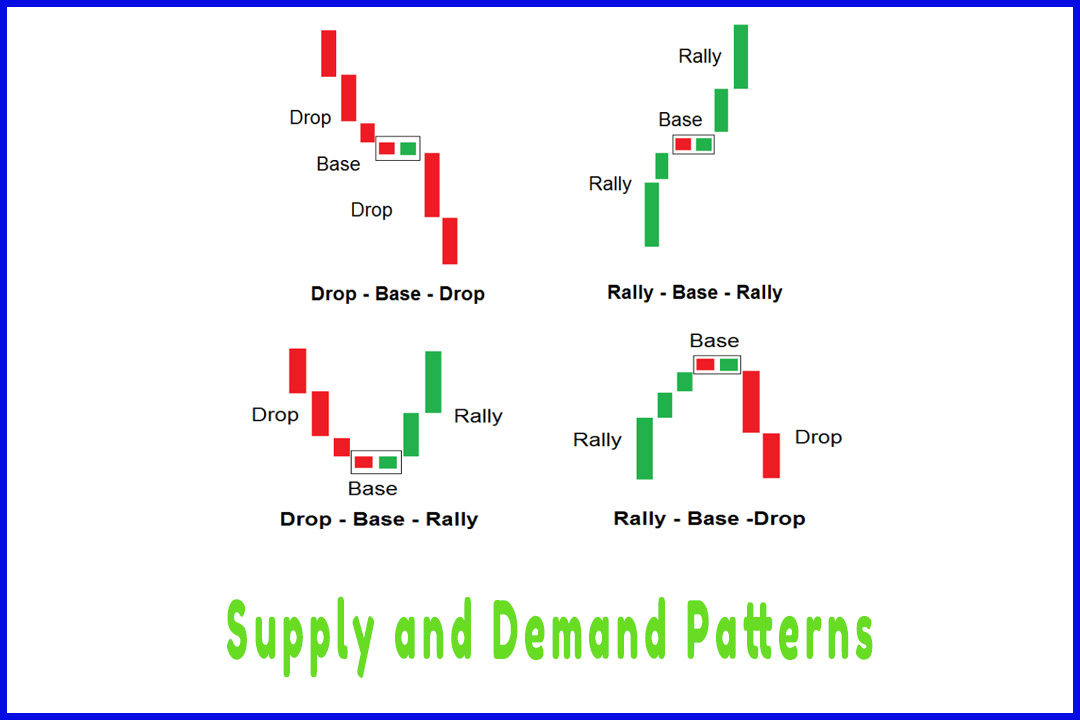
Supply and Demand Patterns
Reversal Patterns, Continuation Patterns, Types of Supply and Demand Patterns, Drop base rally, Rally Base Drop, Drop Base Drop, Rally Base Rally
Course: [ Easy Way To Learn Supply & Demand Trading Strategy : Supply and Demand Trading Strategy ]
These reversal patterns are chart patterns that are formed at the extreme of the curve: at reversal points where the trend changes direction. Normally, they are reactions to previous supply and demand levels: peaks and troughs or continuation patterns.
Two Types of Supply and Demand Patterns
There are
two types of supply and demand patterns: Reversal and Continuation Patterns.
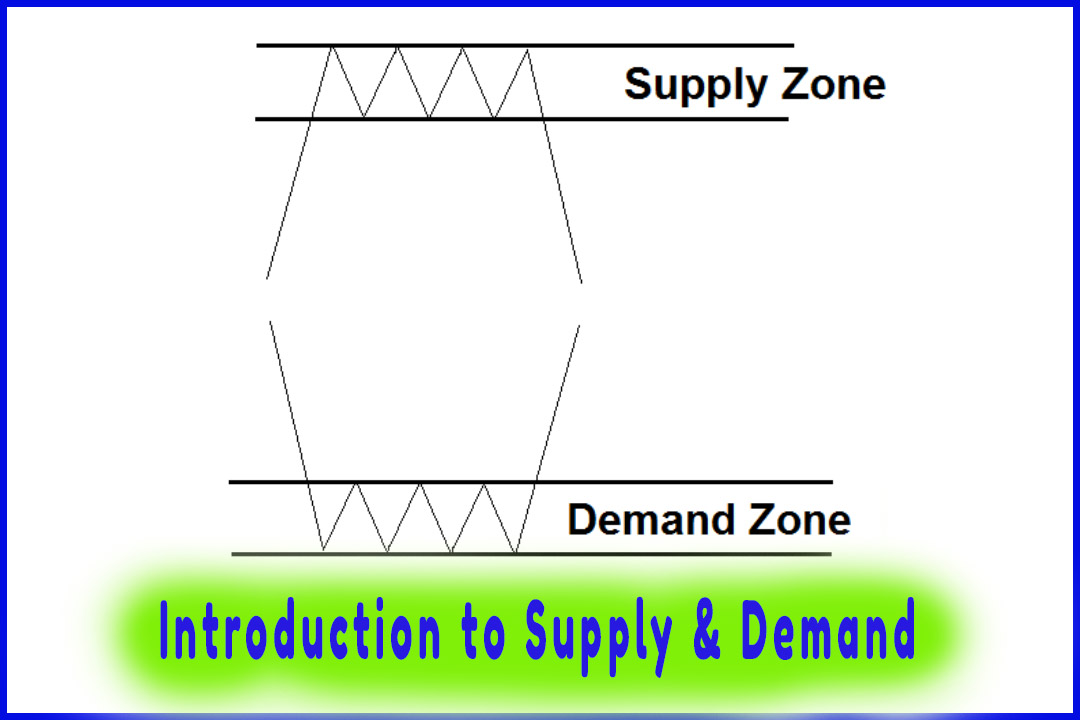
In this
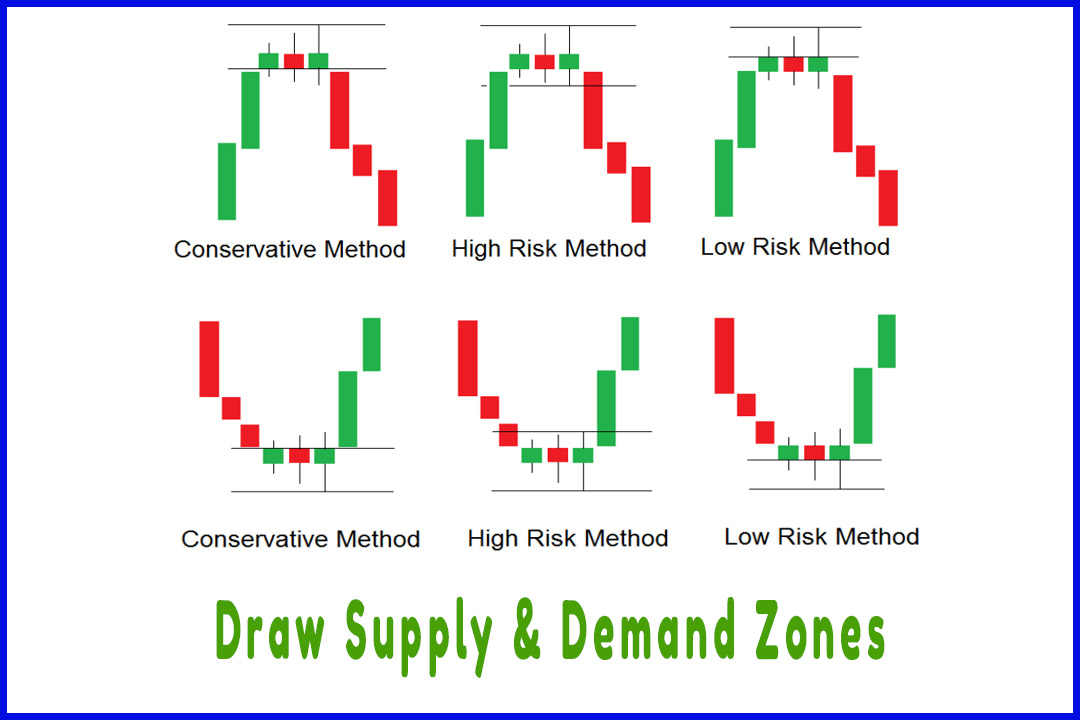
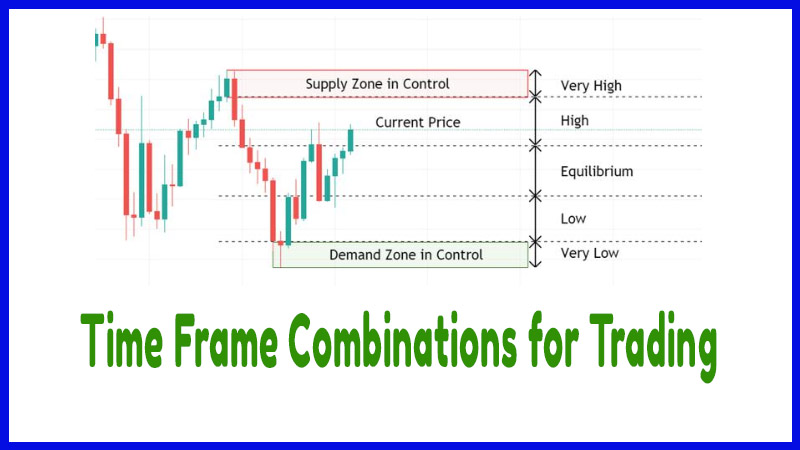
chapter, you will learn how to identify and draw supply and demand zones
properly using the proximal and distal lines.
Reversal & Continuation Patterns
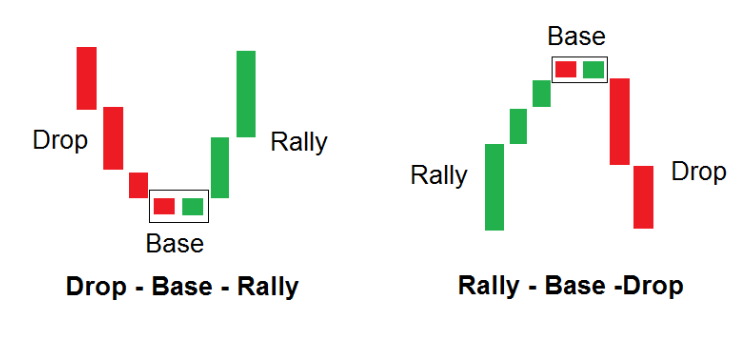
Reversal Patterns
These
reversal patterns are chart patterns that are formed at the extreme of the
curve: at reversal points where the trend changes direction. Normally, they are
reactions to previous supply and demand levels: peaks and troughs or
continuation patterns.
These
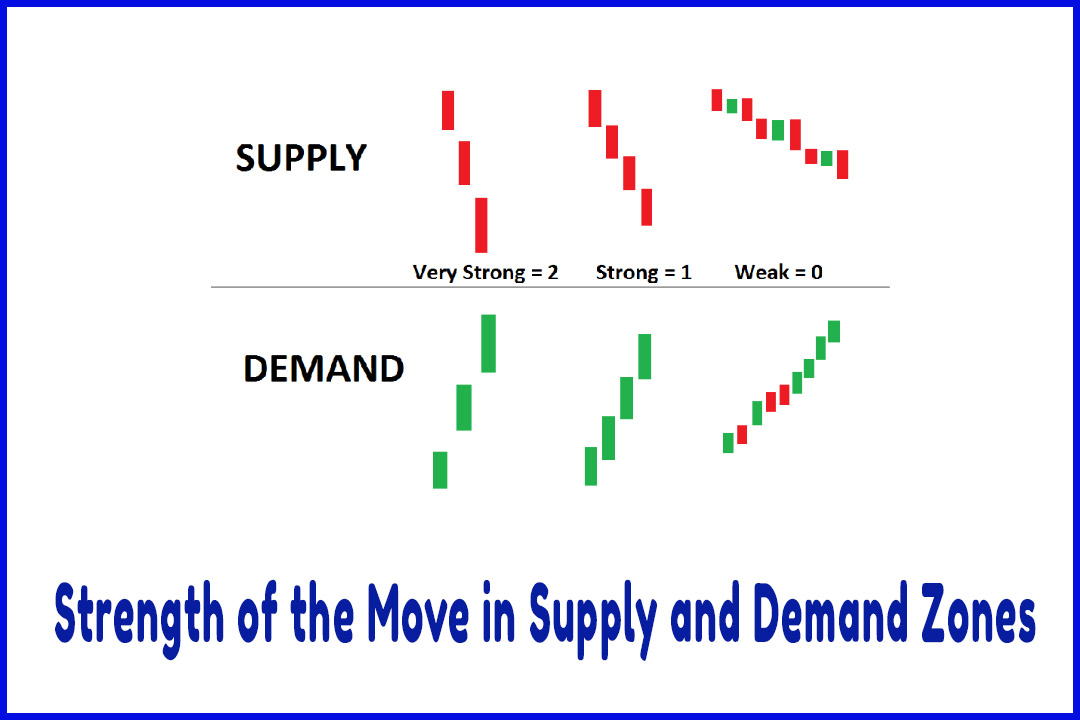
reversal patterns are strong and price tends to respect them.
We have two structures:
Drop-Base-Rally: in
this structure, price moves down, creates a base, and then rallies to the
upside.
Rally-Base-Drop: in
this structure, price moves up, creates a base, and then drops to the downside.
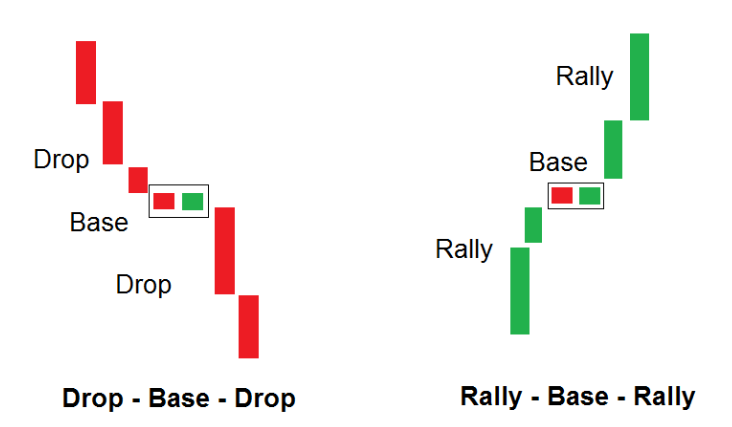
Continuation Patterns
These continuation
patterns (CPs) are found inside the trend. The best continuation patterns to
trade are those formed at the beginning of a reversal.
These continuation patterns are:
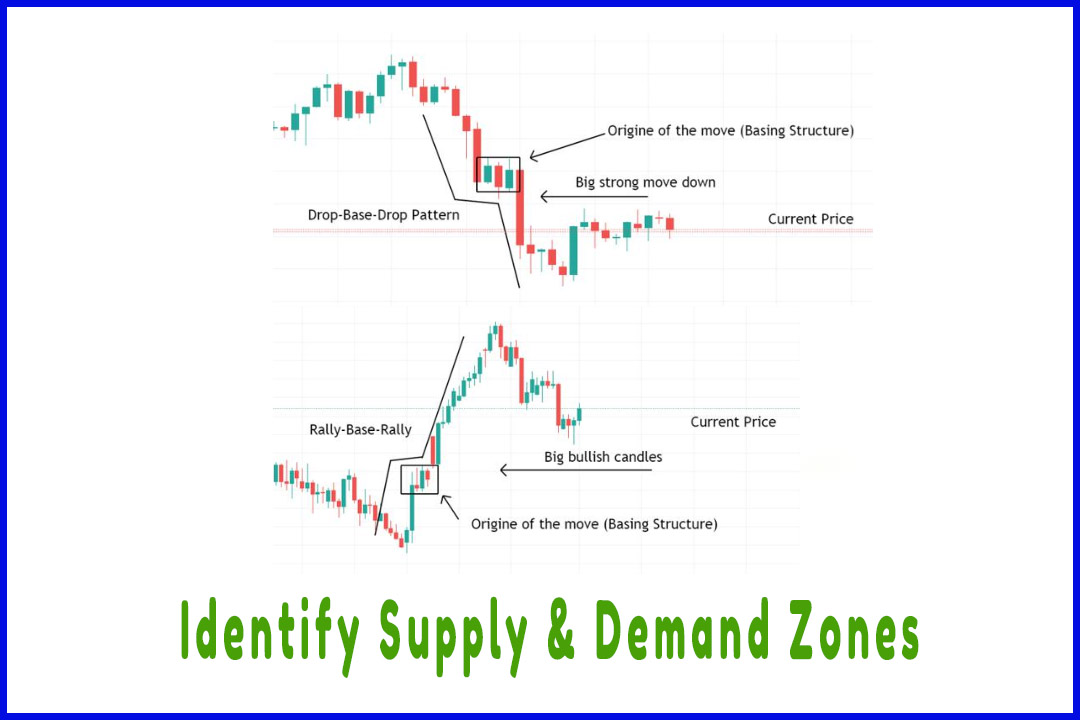
Drop-Base-Drop: price
drops down, pauses for a moment creating a base, and then continues moving
down.
Rally-Base-Rally: price
rallies, pauses for a moment creating a base, and then continues moving up.
Easy Way To Learn Supply & Demand Trading Strategy : Supply and Demand Trading Strategy : Tag: Supply and Demand Trading, Forex : Reversal Patterns, Continuation Patterns, Types of Supply and Demand Patterns, Drop base rally, Rally Base Drop, Drop Base Drop, Rally Base Rally - Supply and Demand Patterns