Draw Supply & Demand Zones
Distal and Proximal Lines, Supply Zones, The High-Risk Trading Method, Demand Zones, how to correctly draw supply and demand zones
Course: [ Easy Way To Learn Supply & Demand Trading Strategy : Supply and Demand Trading Strategy ]
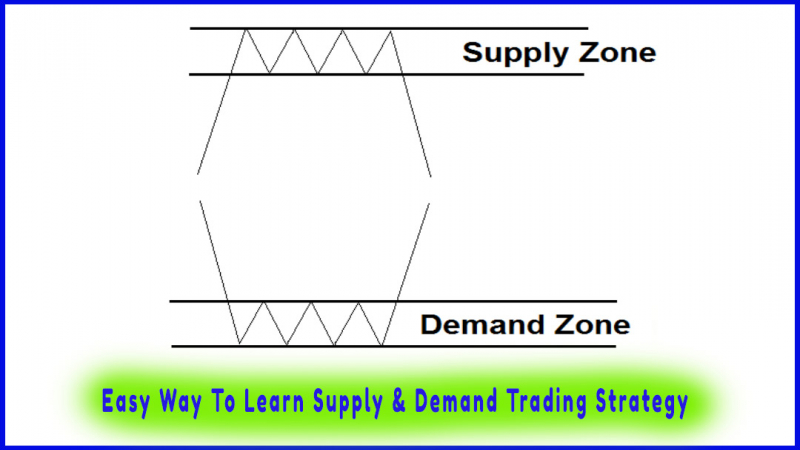
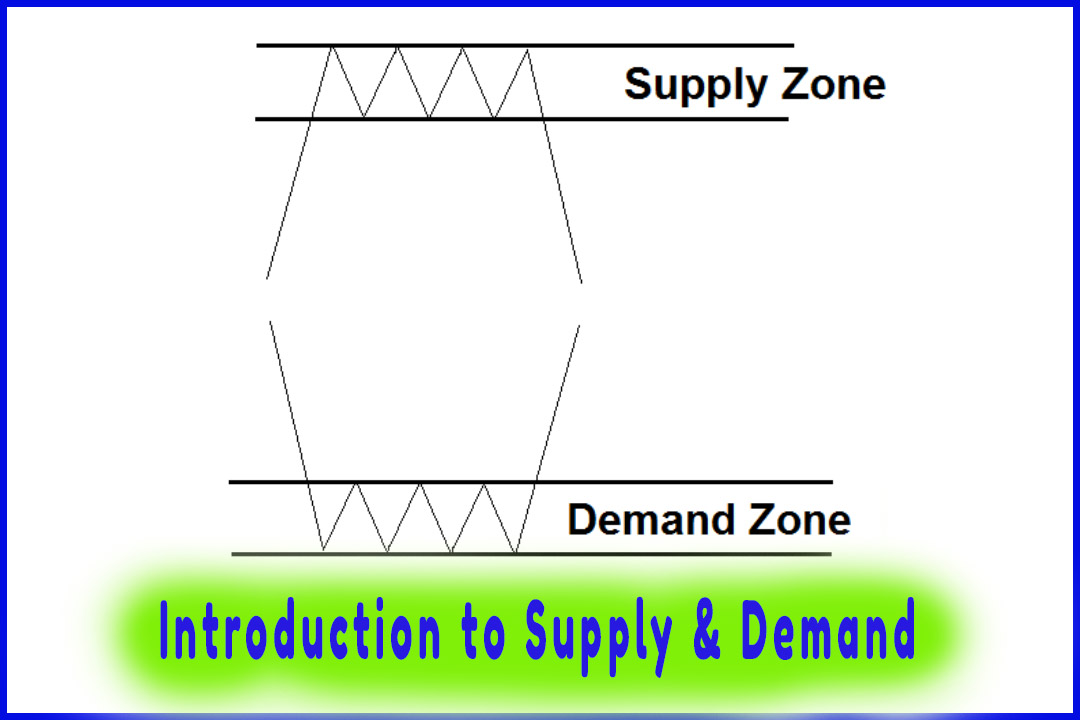
Once we have successfully identified our supply and demand zones, we need to draw two lines around the origin of the move or the basing structure.
How to Draw Supply & Demand Zones
Once we
have successfully identified our supply and demand zones, we need to draw two
lines around the origin of the move or the basing structure.
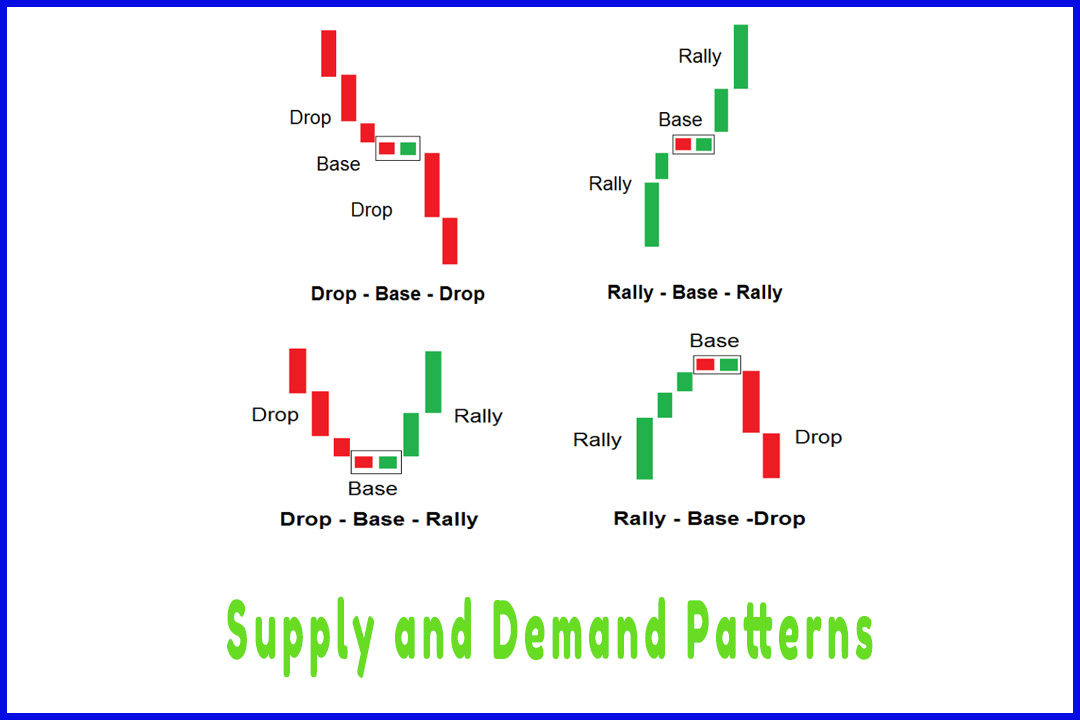
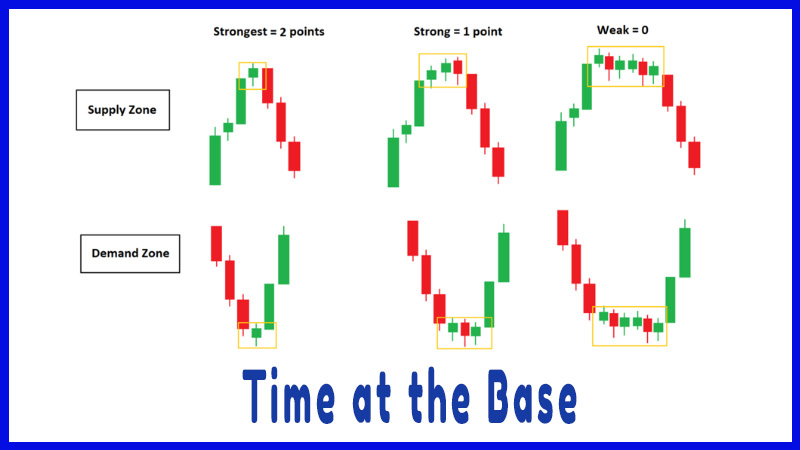
The Structure of the Base
A base
must have:
-
less than six candles,
-
the candle’s body is less than or equal to 50% of the candle range,
-
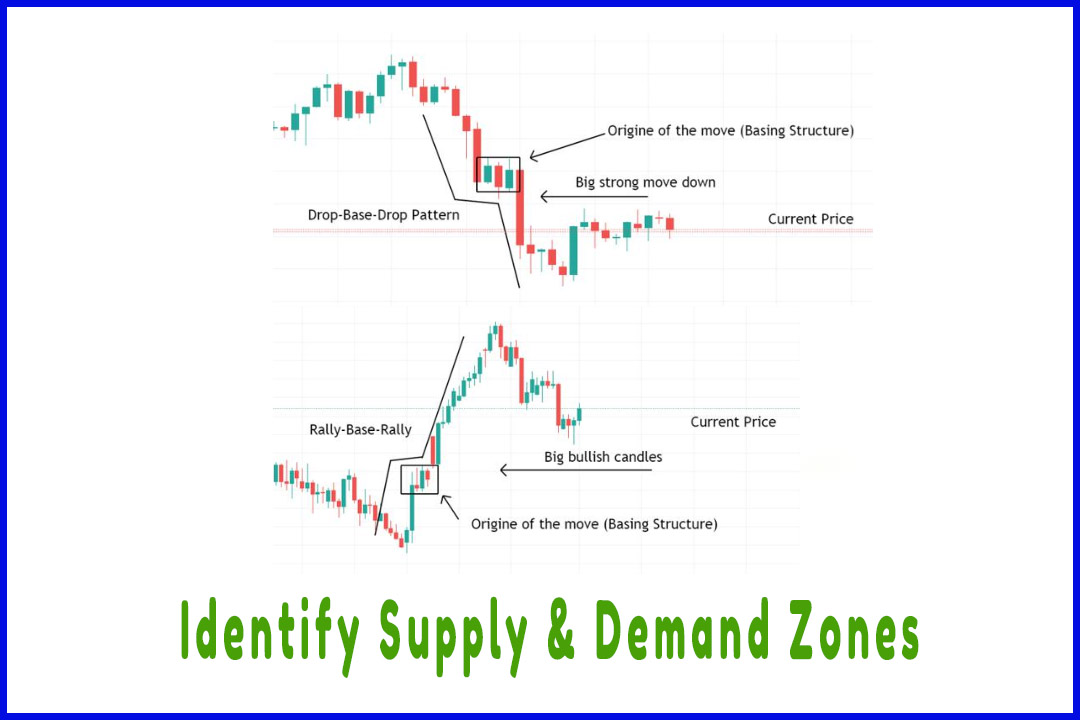
the price has left the basing structure with ERC candles (explosive move),
A base
must not have:
-
more than six candles,
-
only doji candles,
-
candles with long tails or wicks,
-
stair step candles,
Let’s take a look at the following chart:
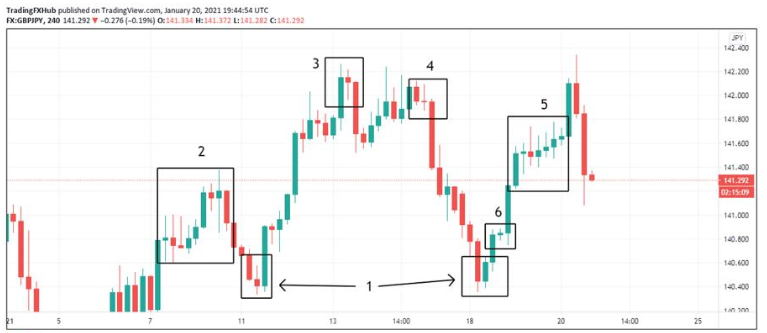
In (1)
and (3), we have the perfect basing structure to draw our demand zones. The
base has one candle and price left the structure with ERCs.
If the
base has more than 6 candles, we ignore it. We need to find a basing structure
that has less than 6 candles. A base with more candles simply means that supply
equals demand and that most orders are filled.
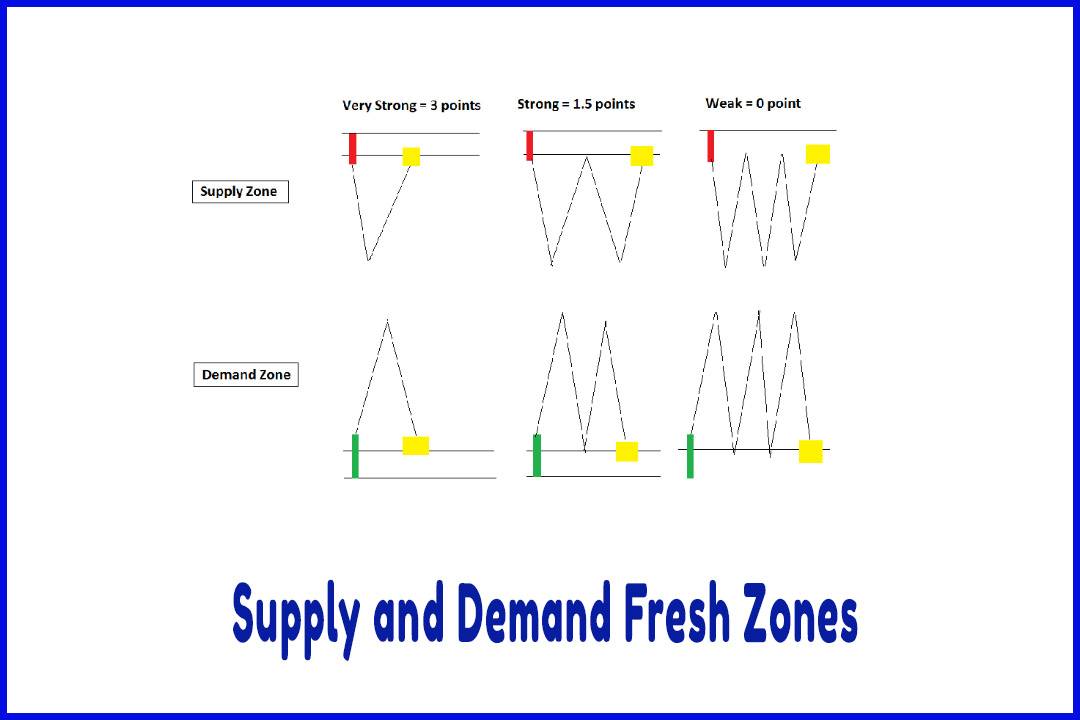
A base
with less than 6 candles shows great imbalance and that more unfilled orders
are still waiting for the price to retrace back and fill them.
If the
basing structures have only doji candles (2 and 4), we also ignore them. Look
how the price ignored the zone and continued moving up.
When the
base has candles with long tails (2 and 6), it simply means that the level is a
reaction to a previous supply or demand zone.
In (6),
we have a base with one candle followed by an ERC candle that has a tail below
the low of the basing candle.
This is a
reaction to the previous demand zone below. The tails show that market
participants went all the way down to look for unfilled orders.
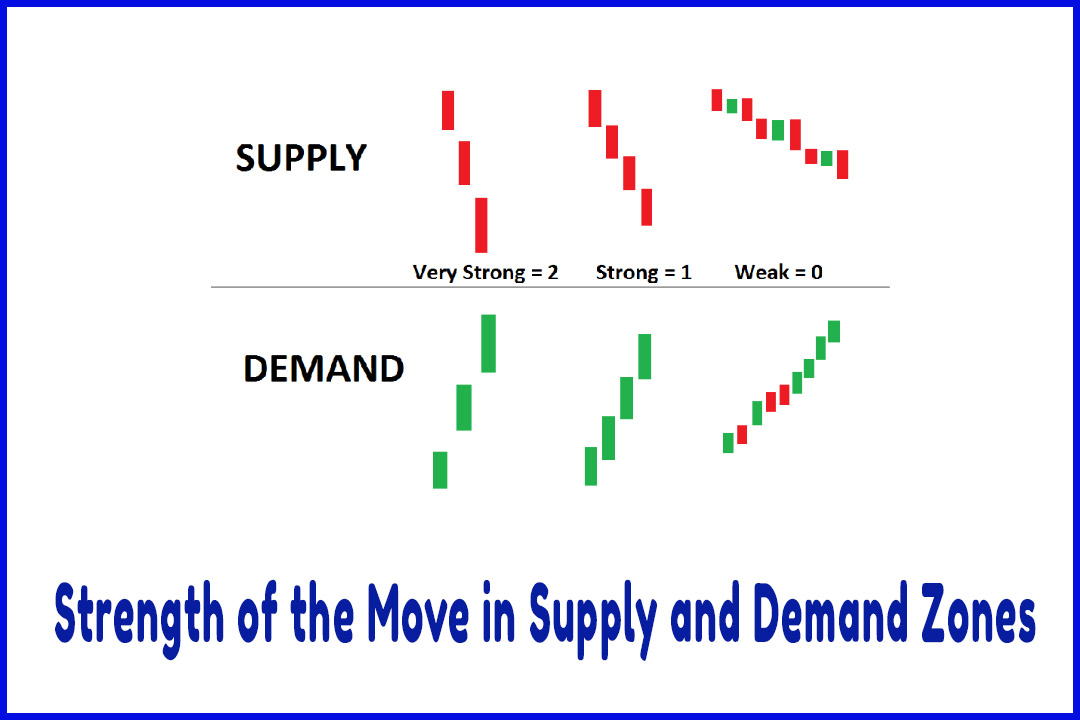
Also, a
base structure that has stair-step candles (5) is a low probability zone. The
stair-step structure is formed by:
-
one candle closing below the close of the previous candle for a supply zone,
-
one candle closing above the close of the previous candle for a demand zone.
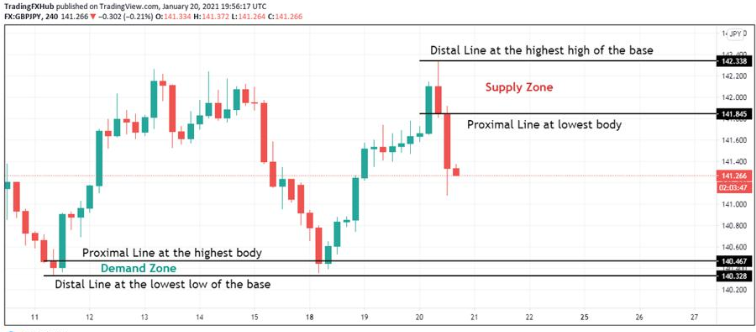
Distal and Proximal Lines
In order
to draw supply and demand zones, we draw two lines around the base of the
zones. The first line is called the distal line and the second line is called
the proximal line.
Both
lines are placed around the base to determine the supply or demand zone.
The
distal line is the outer line of the zone placed away from the current price.
The
proximal line is the inner line of the zone placed near the current price.
When it
comes to drawing supply and demand zones, everyone has his method and his
style.
In
general, there are 3 different methods of drawing these lines based on your
risk appetite and how conservative you are in your trading.
You can
choose the right method that better suits your trading and your risk tolerance.
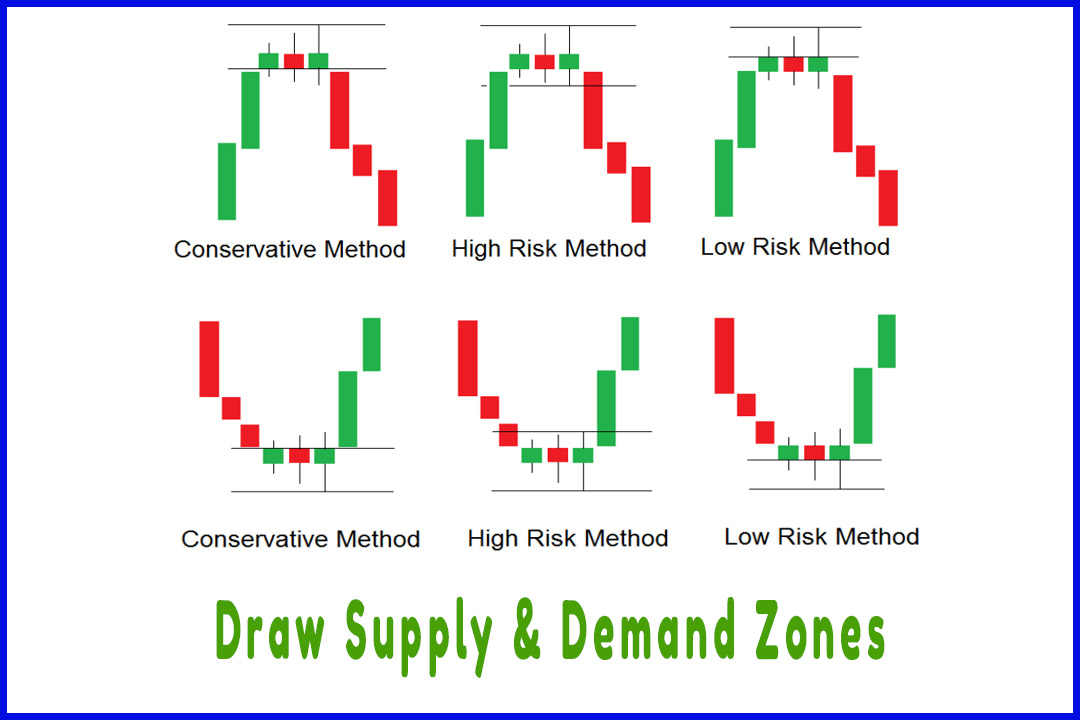
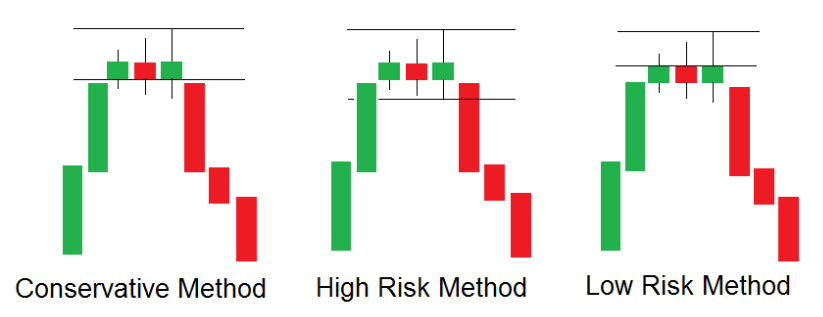
Supply Zones
There are
three ways of drawing a supply zone:
The Conservative Method:
The
distal line is placed at the highest wick of the base and the proximal line at
the lowest body in the basing structure.
The High-Risk Method:
The
distal line at the highest wick of the base and the proximal line at the lowest
wick of the basing structure.
The Low-Risk Method:
The
distal line at the highest wick of the base and the proximal line at the
highest body in the basing structure.
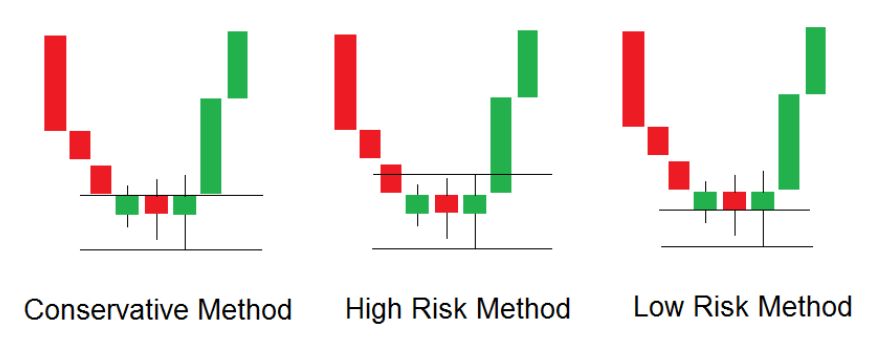
Demand Zones
There are
three ways of drawing a demand zone:
The Conservative Method:
The
distal line is placed at the lowest wick of the base and the proximal line at
the highest body in the basing structure.
The High-Risk Method:
The
distal line at the lowest wick of the base and the proximal line at the highest
wick of the basing structure.
The Low-Risk Method:
The
distal line at the lowest wick of the base and the proximal line at the lowest
body in the basing structure.
Easy Way To Learn Supply & Demand Trading Strategy : Supply and Demand Trading Strategy : Tag: Supply and Demand Trading, Forex : Distal and Proximal Lines, Supply Zones, The High-Risk Trading Method, Demand Zones, how to correctly draw supply and demand zones - Draw Supply & Demand Zones