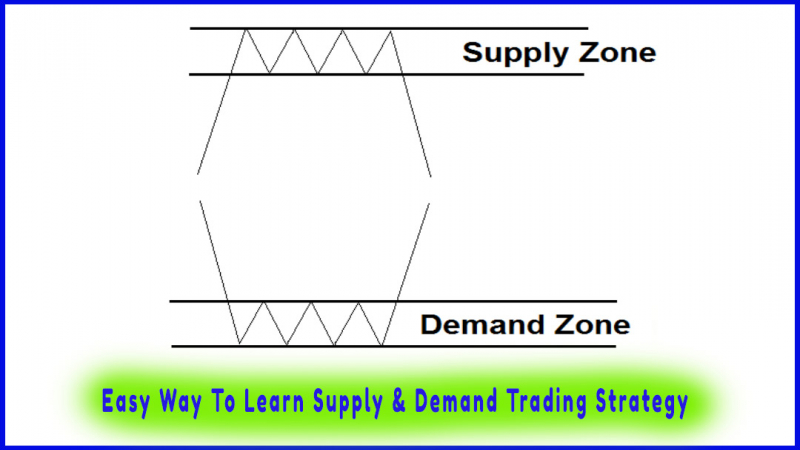
The Curve
higher time frame, lower time frames, direction of the trend, buy at demand zones, sell at supply zones
Course: [ Easy Way To Learn Supply & Demand Trading Strategy : Supply and Demand Trading Strategy ]
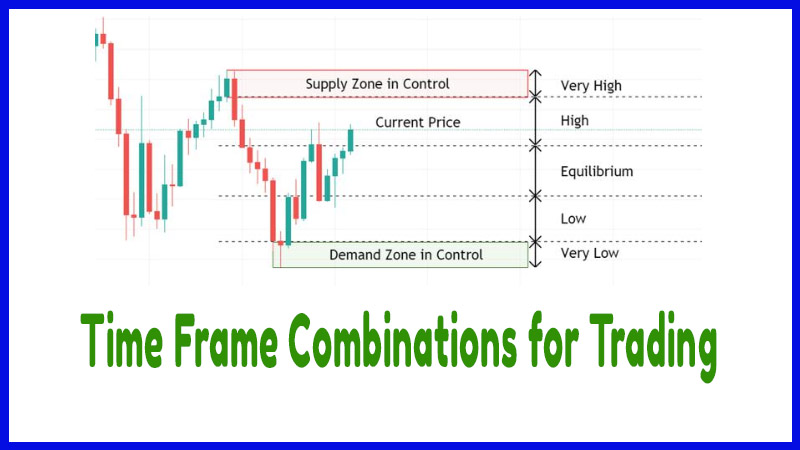
In order to determine the curve on a price chart, we use the higher time frame to find the closest supply and demand zones to the current price. This is very important because it gives us a clear picture of who’s in control; buyers or sellers, and to avoid buying at supply and selling at demand.
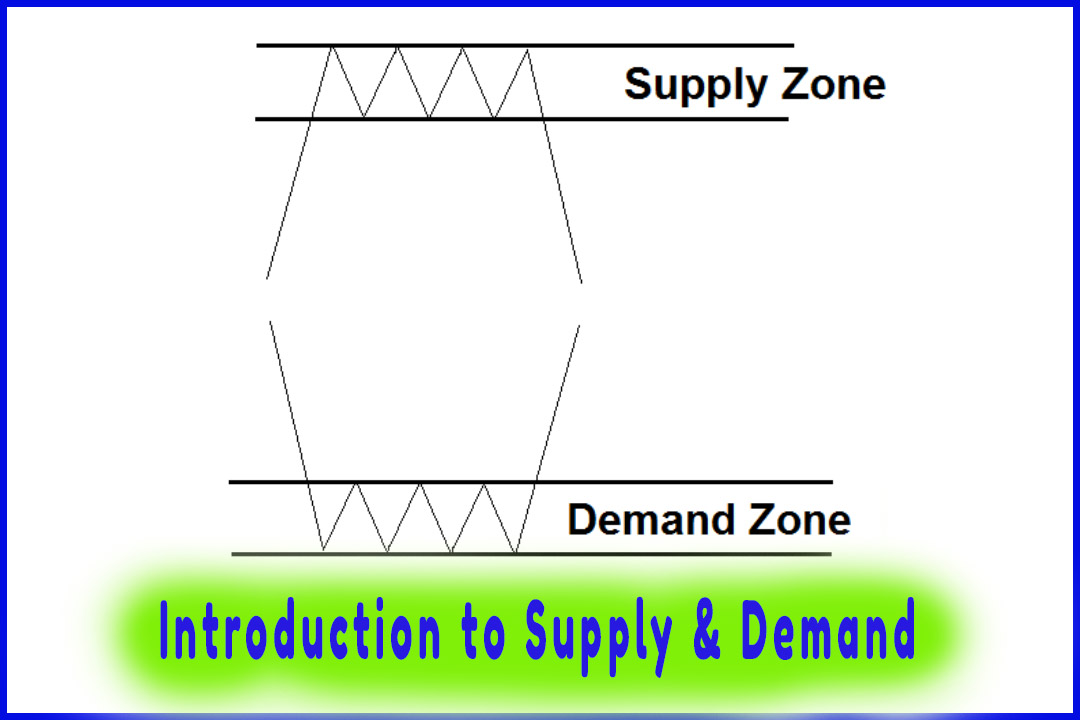
The Curve
In order
to determine the curve on a price chart, we use the higher time frame to find
the closest supply and demand zones to the current price.
This is
very important because it gives us a clear picture of who’s in control; buyers
or sellers, and to avoid buying at supply and selling at demand.
The rules are:
·
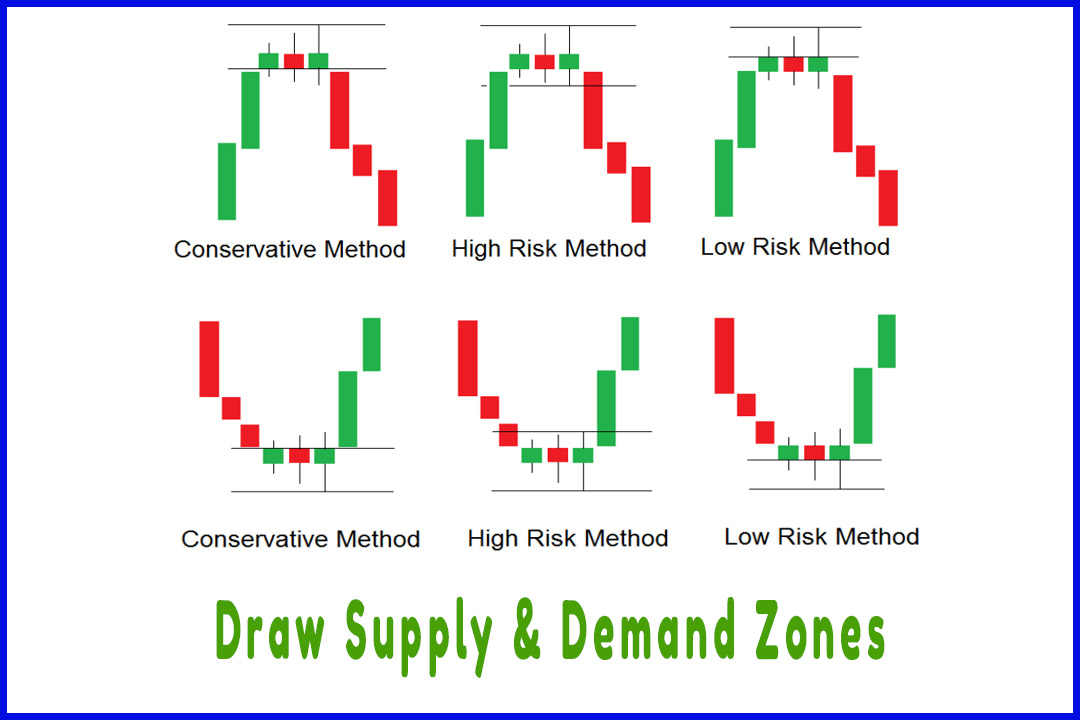
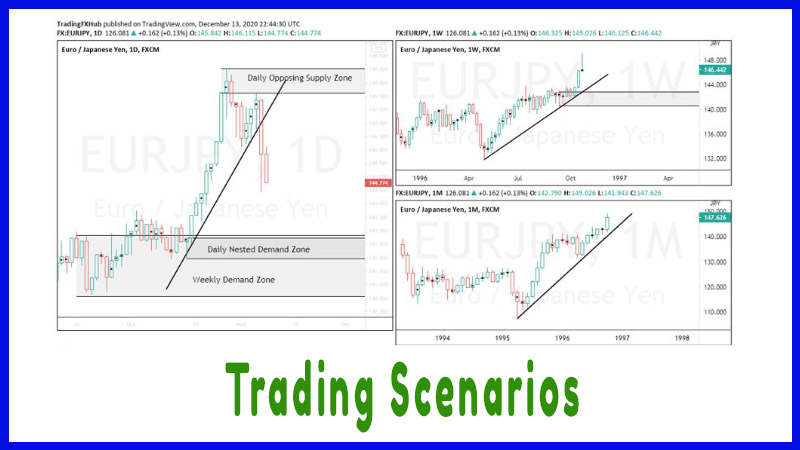
We look for the closest fresh
supply and demand zones on the higher time frame, in our example, we are using
the monthly chart.
·
On the higher time frame, we
divide the area between the two proximal lines into 3 equal parts: Very Low,
Low, Equilibrium, High, and Very High.
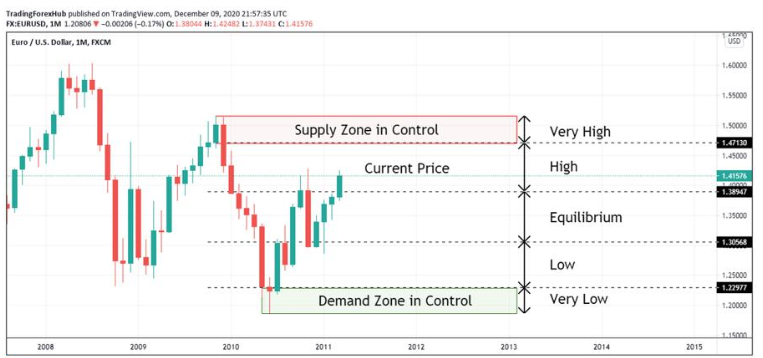
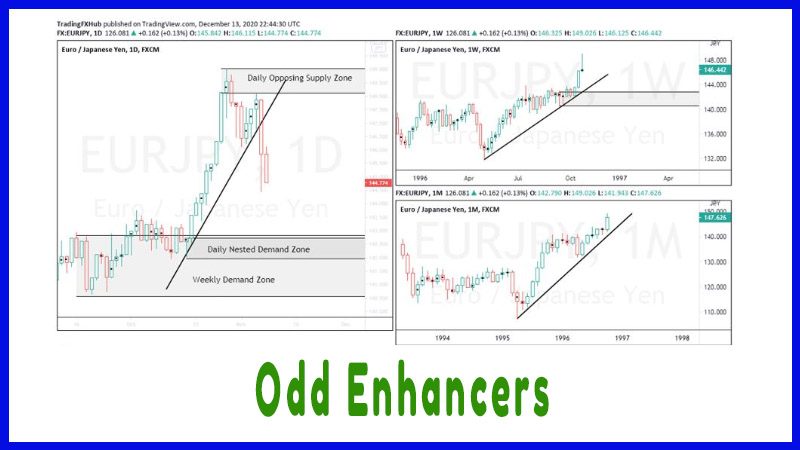
When the
price is High and Very High in the curve, we only SELL.
When the
price is Low and Very Low in the curve, we only BUY.
When the
price is at Equilibrium, we can either trade in the direction of the
trend using the intermediate time frame or we don’t trade and wait for the
price to move away from this zone.
Once we
determine the curve on the higher time frame, we move to lower time frames to
identify and draw our supply and demand zones and place our entries
accordingly.
If there
are no supply or demand zones on the higher time frame, we simply trade with
the prevailing trend using the intermediate time frame.
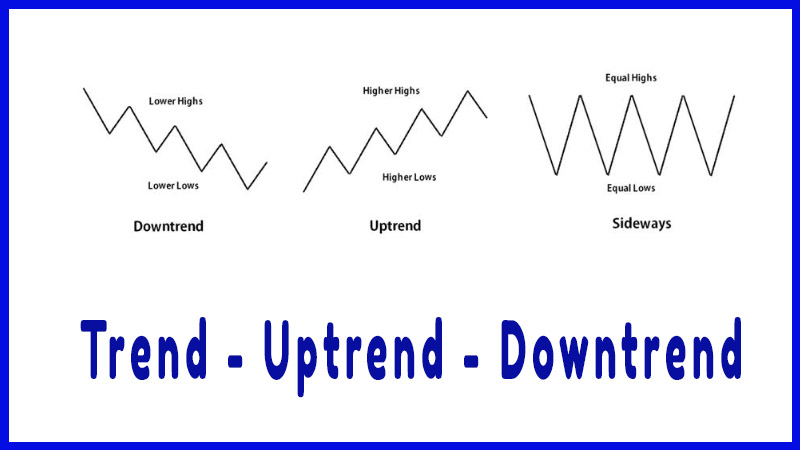
For
example, if the trend is up in the intermediate time frame, we move to the
lower time frame and we buy at demand zones. And if the trend is down, we sell
at supply zones on the lower time frame.
If we
have a sideways trend, we don’t trade unless the lower time frame zone overlaps
with the intermediate or the higher time frame zone.
For
example, if in the intermediate time frame, we have a sideways trend
approaching a support level, we move to the lower time frame and identify an
overlapping demand zone to buy with the premise that the price will keep bouncing
between support and resistance.
As a rule
of thumb, when the price is in the middle of the curve, it is better not to
trade.
Easy Way To Learn Supply & Demand Trading Strategy : Supply and Demand Trading Strategy : Tag: Supply and Demand Trading, Forex : higher time frame, lower time frames, direction of the trend, buy at demand zones, sell at supply zones - The Curve