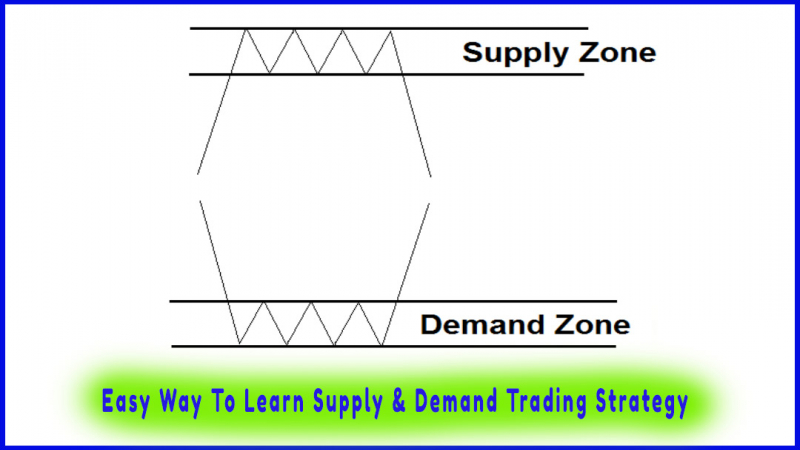
Trading Scenarios
supply and demand curve, how to identify trading opportunities, How to trade multiple scenarios
Course: [ Easy Way To Learn Supply & Demand Trading Strategy : Supply and Demand Trading Strategy ]
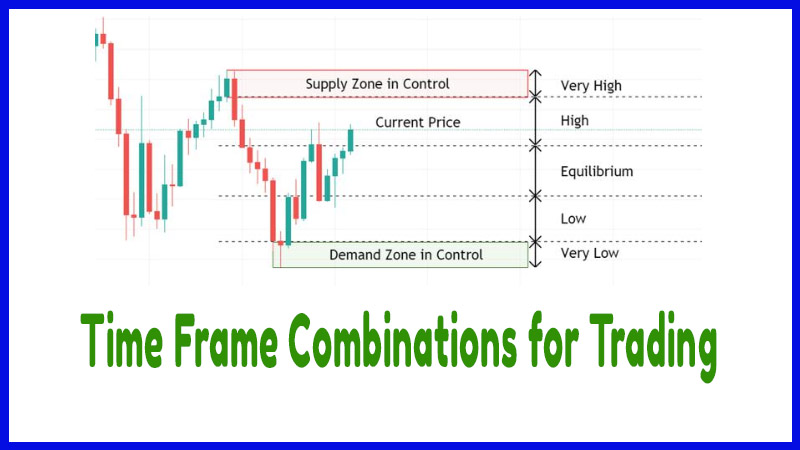
These trading scenarios are common in the forex market and we use them to better understand how MTF and the curve work together to identify trading opportunities based on market conditions.
Trading Scenarios
In this
section, we will discuss some of the special cases using both the MTF analysis
and the supply and demand curve.
These
trading scenarios are common in the forex market and we use them to better
understand how MTF and the curve work together to identify trading
opportunities based on market conditions.
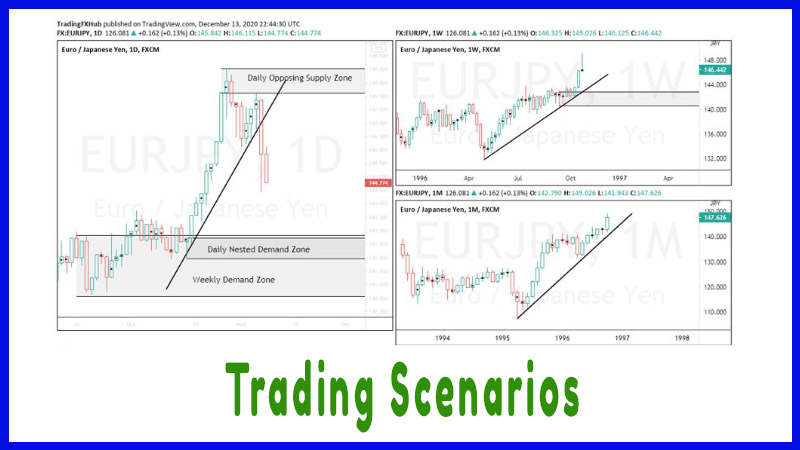
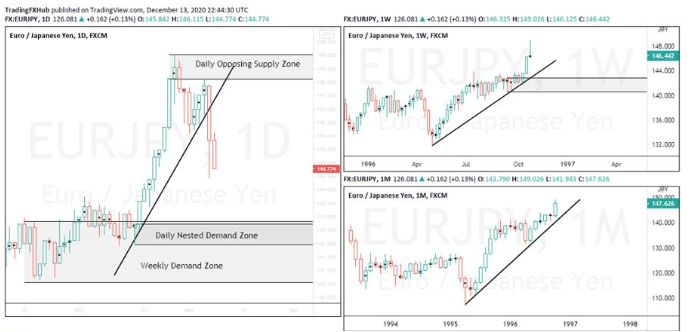
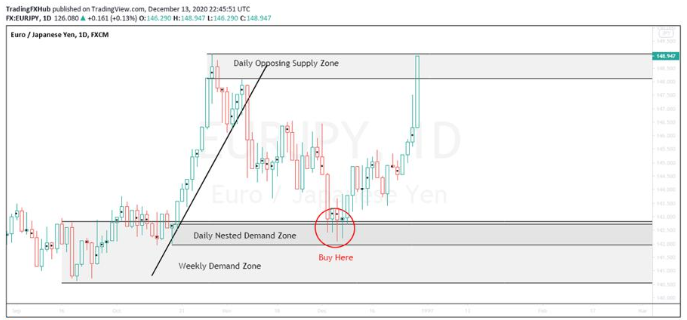
Scenario 1:
In this
trading scenario, we have:
[Monthly:
Uptrend, Weekly: Uptrend, and Daily: Downtrend]
The daily
chart has lost momentum and is not aligned with the monthly and weekly charts.
We need to look for nested demand zones between daily and weekly charts if we
want to buy.
If we
have an opposing supply zone close to the current price on either weekly or
daily charts, we move to the weekly chart and look for demand zones to buy.
If we
have an opposing zone on the monthly chart, we wait for the price to reach a
monthly demand zone in order to buy. We don’t consider weekly or daily demand
zones here, only monthly demand zones.
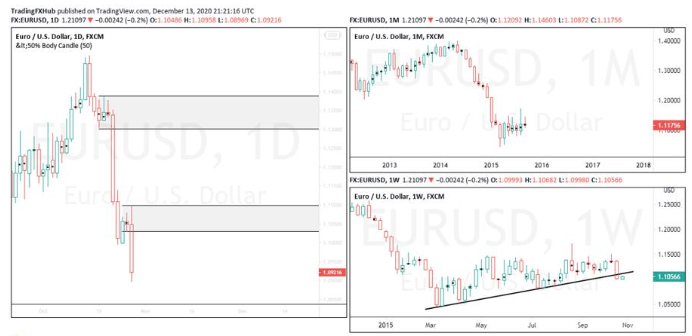
Scenario 2:
In this
scenario, let’s assume that we have:
[Monthly:
Sideways, Weekly: Downtrend, and Daily: Downtrend]
What we
need to do is wait for the price to test an opposing supply zone on one of
these charts. If we don’t have any opposing supply zone, we don’t trade.
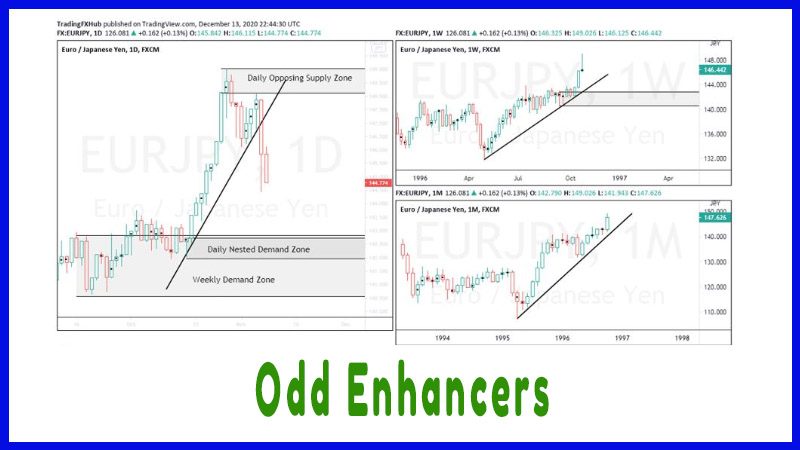
On the
chart below, we can see that the monthly price is moving in a tight range. On
the weekly chart, price broke the trend and on the daily chart, we have two
opposing supply zones.
If price
retraces back up and tests one of them, we short.
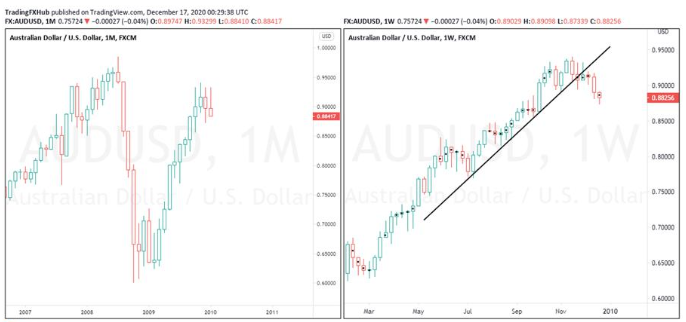
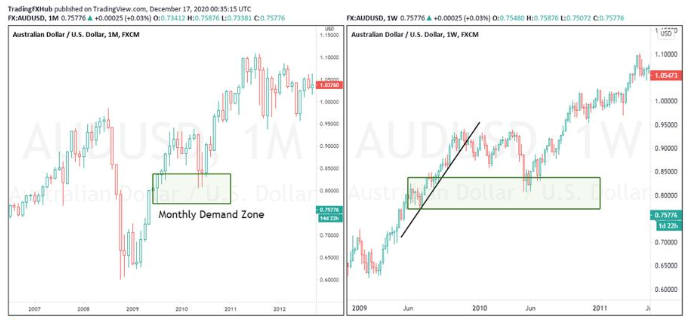
Scenario 3:
In this
scenario, we have the weekly chart going against the monthly chart. At this
point, there is no need to look at the daily chart until we have both monthly
and weekly aligned and moving in the same direction.
[Monthly:
Uptrend, Weekly: Downtrend]
Here, we
wait for the price to test an opposing monthly demand zone to buy.
Easy Way To Learn Supply & Demand Trading Strategy : Supply and Demand Trading Strategy : Tag: Supply and Demand Trading, Forex : supply and demand curve, how to identify trading opportunities, How to trade multiple scenarios - Trading Scenarios