High Close Doji - Spot Triggers
pivot point analysis, support and resistance levels, pivot point support, pivot point resistance, Spot Forex Triggers, bullish momentum
Course: [ The Candlestick and Pivot Point Trading Triggers : Chapter 8. Setups and Triggers ]
he most reliable and most common method used to determine support and resistance levels is the mathematical-based calculations from pivot point analysis.
HIGH CLOSE DOJI
The
most reliable and most common method used to determine support and resistance
levels is the mathematical-based calculations from pivot point analysis.
Through the years, I have noticed that doji formations form more often than not
at these predefined levels. In Chapter 7, we have statistical information that
backs up that observation. That is the focus on which we want to
concentrate—the market’s behavior at support and resistance levels, especially
when dojis appear. The key is to watch for confirmation for a transition to
take place and to act when there is a shift in momentum. We are looking for a
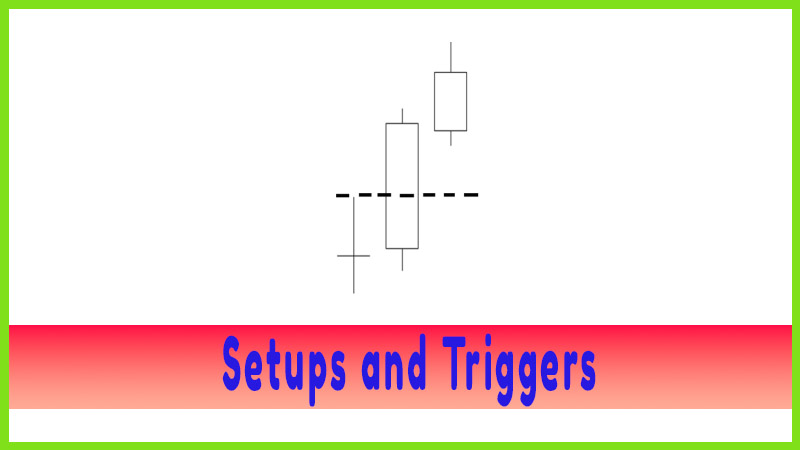
specific conditional change to take place in the market, namely a higher
closing high above a doji’s high at the pivot point support level. This is the
pattern I call the high close doji (HCD) method. It has dimensions of specific
criteria that need to fall in place, helping to eliminate and to filter out
false signals. It is a simple and basic approach to candlestick chart patterns
that is a high-probability winning strategy.
Characteristics
When the
market is in an extended trend to the downside and the market condition is
oversold, a doji appears, indicating indecision and weakness of sellers to
maintain the downward trend. In addition, prices are near a projected pivot
point support target level (Figure 8.1).
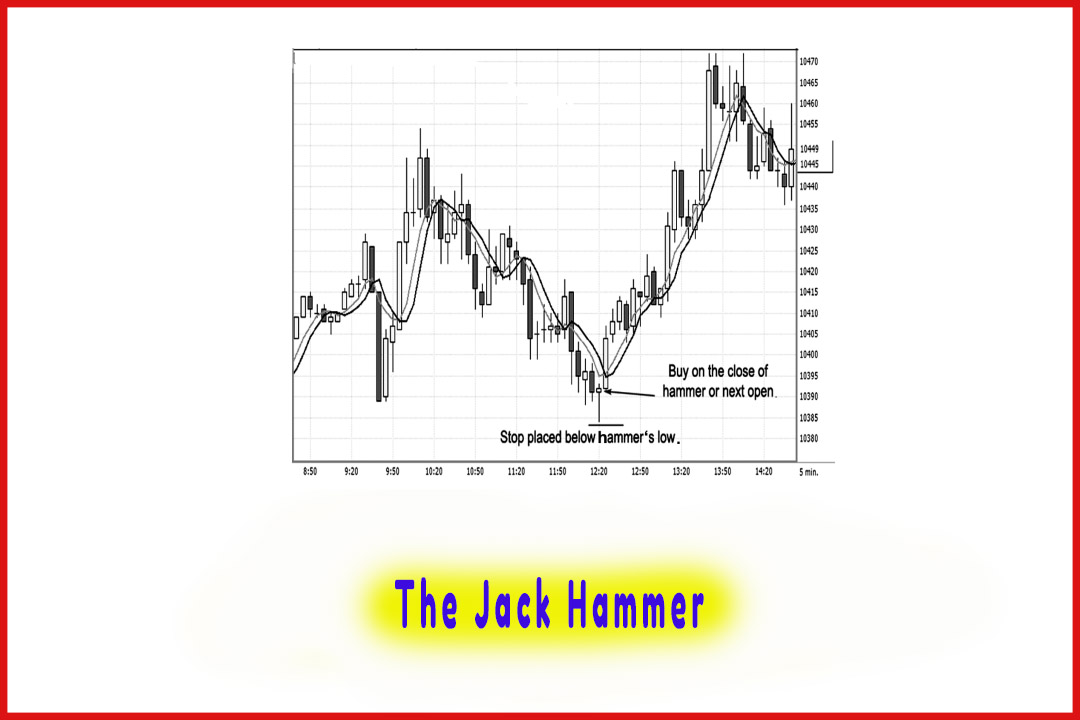
When a doji appears, you should:
- Buy on the close or on the next open after a new closing high is made from the previous doji candle high, especially when the market is against a key pivot point support target number.
- Place stops below the lowest low point of the doji. Stops should be initially placed as a stop-close-only, meaning you do not exit the trade unless the market closes back below the doji’s low.
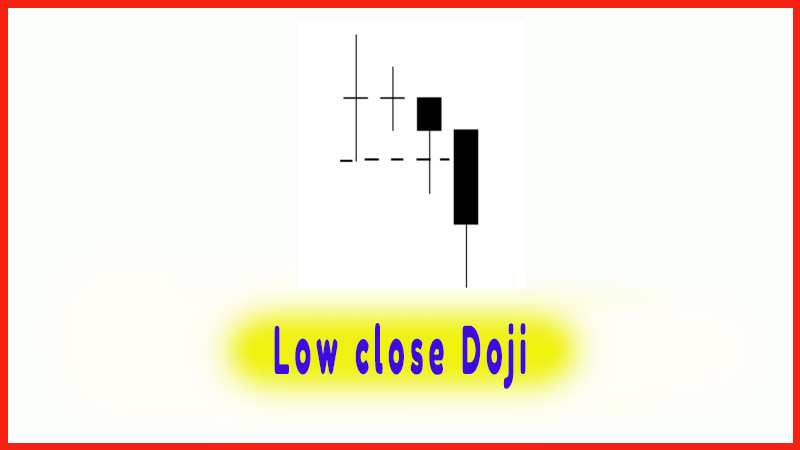
- Sell or exit the trade on the close or on the next open of a candle that makes a lower closing low near a key pivot point resistance number.
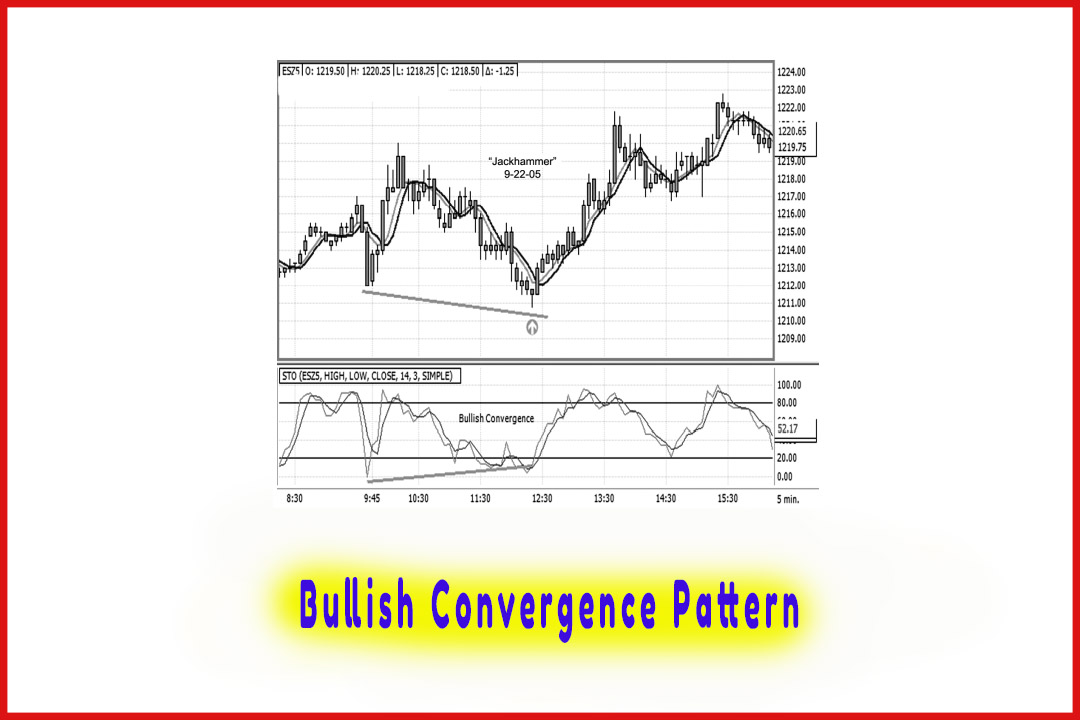
You can
use a “filter” or backup process to confirm the buy signal, such
as a bullish convergence stochastic pattern or a bullish convergence on moving
average convergence/divergence (MACD).
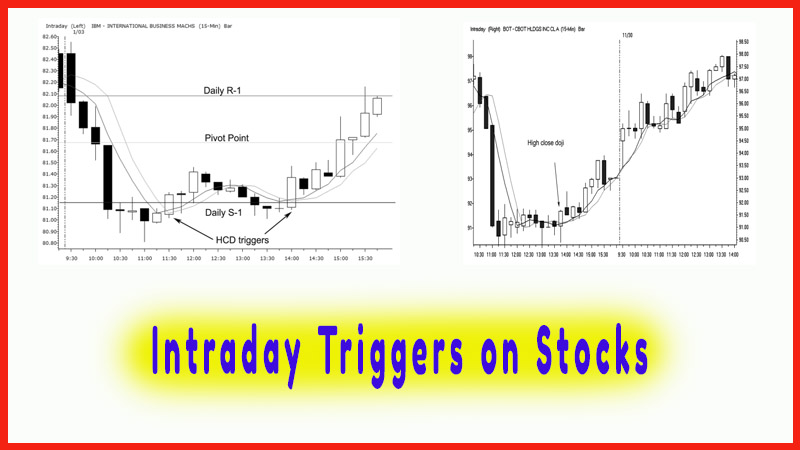
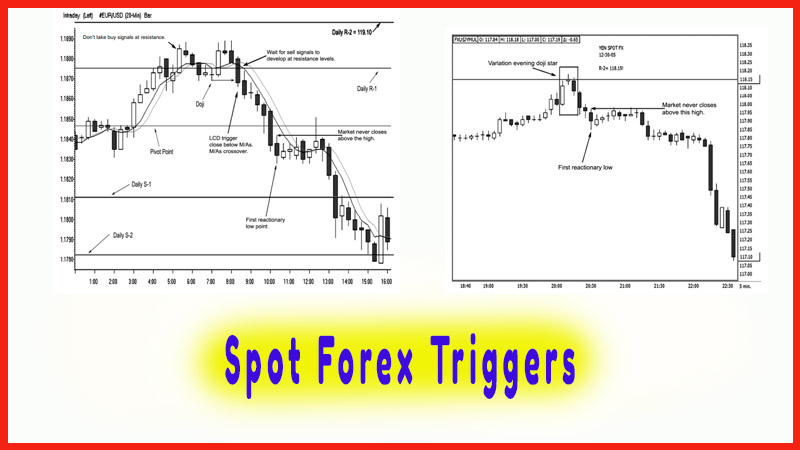
Spot Forex Triggers
Now let’s
put these rules into practice by examining active trading markets, such as in
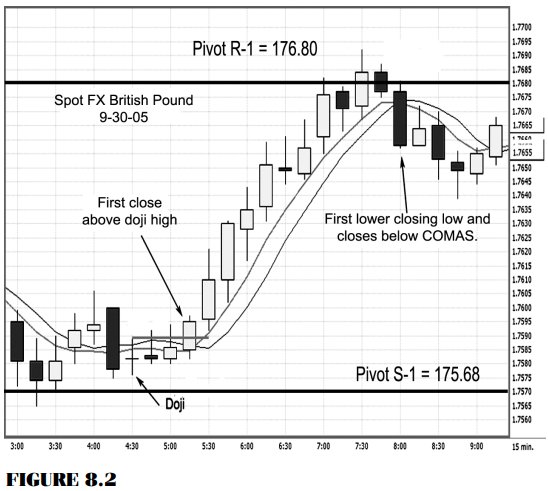
foreign currency markets. Figure 8.2 shows a 15-minute time period candle chart
on the spot British pound. Taking the data from September 29 and using the
close from the 5 p.m. (ET) New York Bank settlement, we have a high of 177.04,
a low of 175.92, and a close of 176.13. Once we calculate the pivot points, we
have the first support (S-1) figured as 175.68. The first resistance (R-1) is
176.80.
As you
can see, the market trades for almost two hours at the pivot support; but at
4:30, a doji forms. Three time periods later, a close above the doji’s high
occurs. Note that the market closes above both moving average values. In
addition, the COMAS (Conditional Optimized Moving Average System™) method shows
the shorter-term moving average cross above the longer-term average, confirming
a trigger to go long. The trigger to enter a long position would be on the time
period’s close or the very next session’s open; the entry price would be
175.95.
As the market blasts off into trend mode, the
money-making sequence of events transpires—higher highs, higher lows, and
higher closing highs.
As the
trade matures, watch the reaction at the pivot resistance R-1 of 176.80.
Observe the bullish momentum dry up; for the first time, there is a lower
closing low, and prices close below both moving average values. The moving
averages also form a negative cross, confirming a trigger to exit the long
position. As a day trader, you have completed your mission to capture money
from the market. This example would have had you exit the position at 176.57.
For each full-lot-size contract, that would be a 62-PIP profit or $620 gain.
Granted, you did not buy the low or sell the high; but you certainly did what
you always want to do—capture a nice chunk of the middle of a price move. If
you understand that markets move from trend mode to consolidation (or
congestion) phase, then you will realize that at this time it is best to walk
away and wait for the next setup because you are now vulnerable to getting
whipsawed in the market during the consolidation phase. That is why most
successful traders make their money and walk away. Other less fortunate traders
tend to make money early in the day and lose it by trading it away late in the
trading session during the consolidation period.
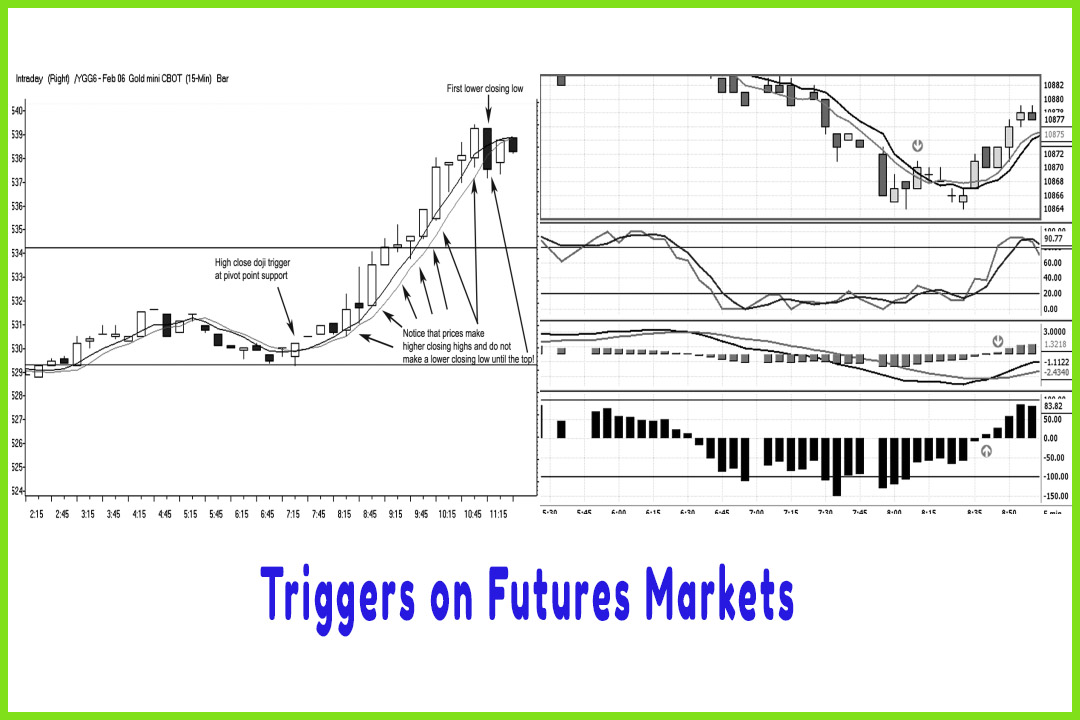
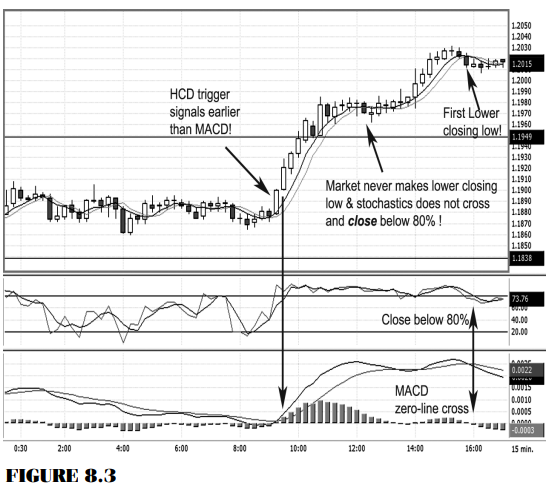
Let’s
examine another trading setup in a spot forex market and see how the HCD signal
responds. Figure 8.3 is another 15-minute chart on the euro currency with the
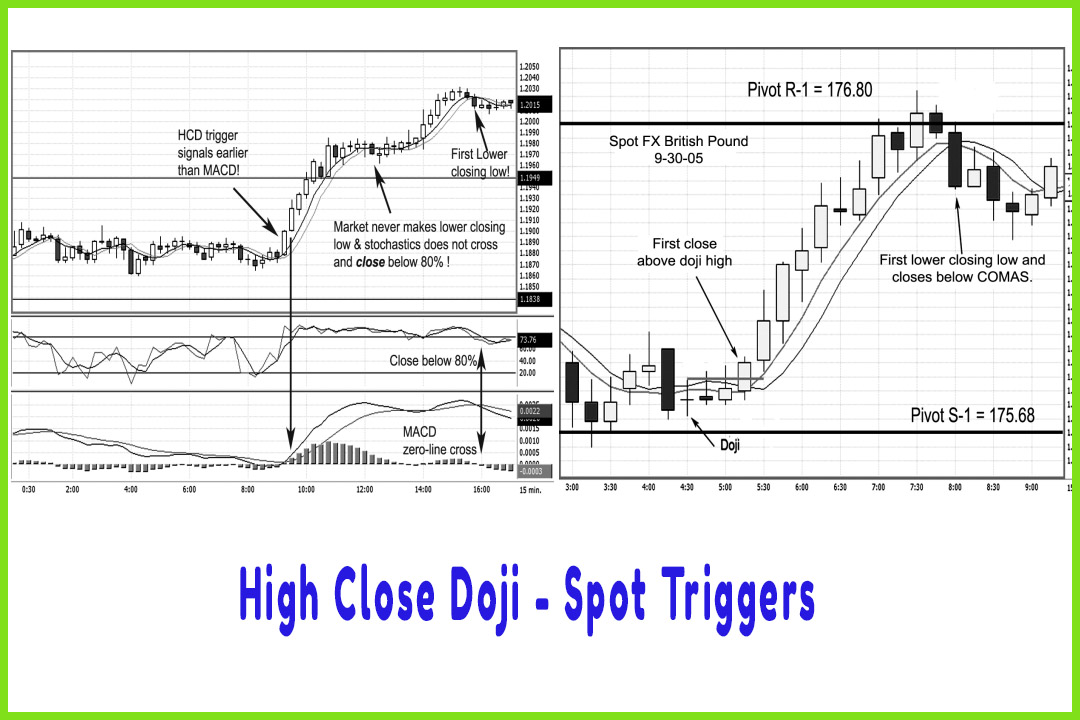
two indicators stochastics and MACD. So far in this book, you have learned how
to spot triggers and how to properly read the indicators. The HCD trigger
signals to enter in a position earlier than the MACD does and is confirmed by
the stochastics as the %K and %D both close above the 20 percent line. What
helps keep you in the trade is the sequence of trading events, such as higher
highs, higher lows, and higher closing highs. Note that the %K and %D
stochastic readings do not close beneath the 80 percent level until the end of
the trend run. Also note that once the market closes below a prior time
period’s low and a doji forms at the top of the price peak, the stochastics
does cross beneath and closes below the 80 percent line. The MACD also signals
a zero-line cross. All the indicators lined up with an exit point.
This
signal generated a buy at 119.06. If you applied the combined technical tools
covered in this book, it would have allowed you to stay with the trade and to
capture the bulk of the move as the exit triggered at 120.15. Per 100,000 lot
contract in the spot forex market, that would have generated a handsome profit
over $1,000 per position. All it takes is a few of those per month to generate
a tidy income.
The Candlestick and Pivot Point Trading Triggers : Chapter 8. Setups and Triggers : Tag: Candlestick Pattern Trading, Forex, Pivot Point : pivot point analysis, support and resistance levels, pivot point support, pivot point resistance, Spot Forex Triggers, bullish momentum - High Close Doji - Spot Triggers