Spot Forex Triggers
daily pivot point levels, support and resistance, moving average crossover
Course: [ The Candlestick and Pivot Point Trading Triggers : Chapter 8. Setups and Triggers ]
Let’s examine market price action and how to execute this signal. You have your predetermined pivot point resistance levels already mapped out for you.
Spot Forex Triggers
Let’s
examine market price action and how to execute this signal. You have your
predetermined pivot point resistance levels already mapped out for you.
RealTick has the feature that automatically sets the daily pivot point levels
on the charts. Genesis Software has the Person Pivot with the COMAS triggers
programmed in a library feature that highlights the buy and sell signals with
the red and green arrows. Some charting packages have pivot points available as
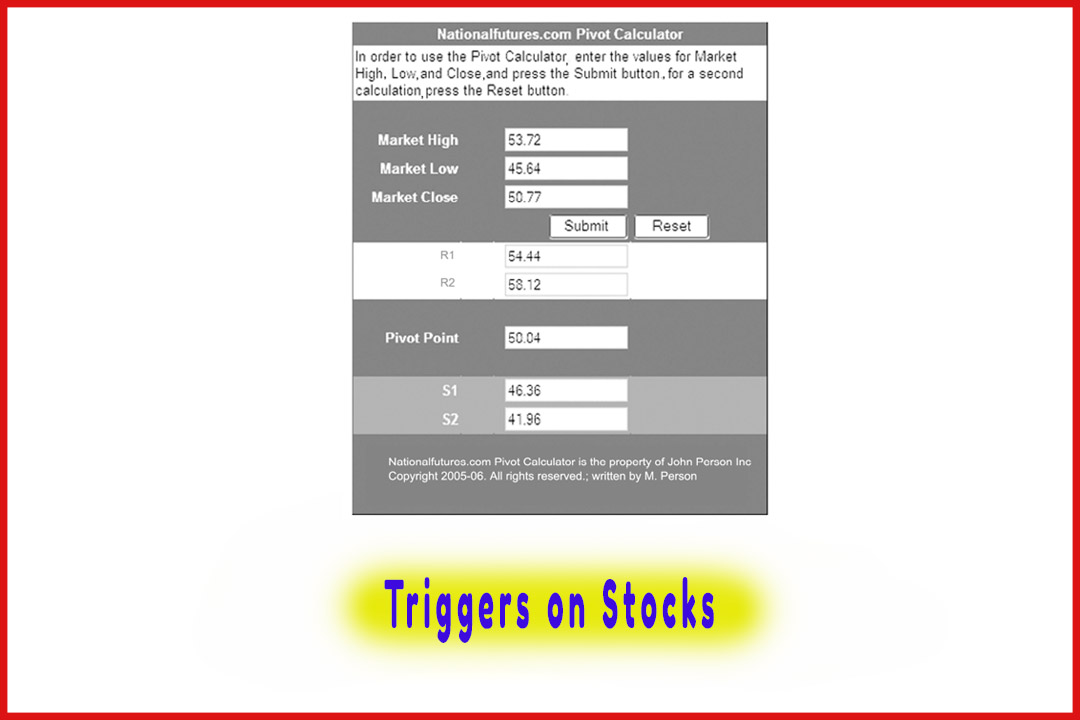
well. If you do not have either of these two software packages, you can do an
Excel program; or at the very least, you can use my pivot point calculator
included on the CD or on my web site www.theforex7.com to program any
market for any time frame you want. The key is that once you have the
predetermined support and resistance numbers, it is the second variable that is
more important, which is looking for a signal that triggers a call to action.
That would be the LCD signal.
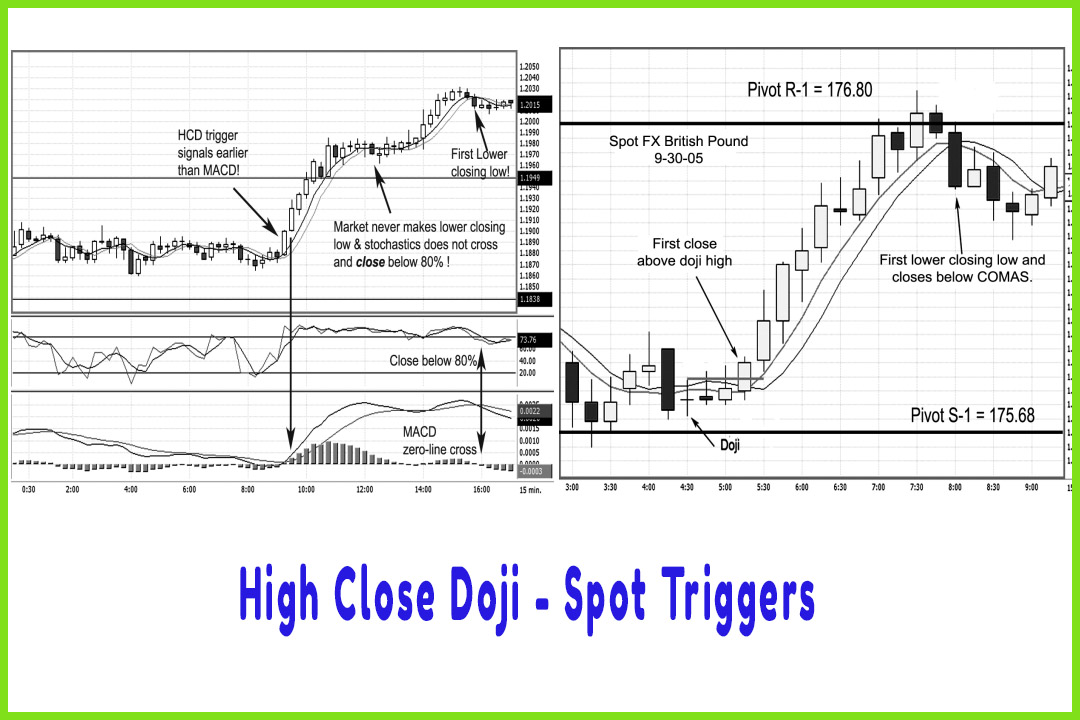
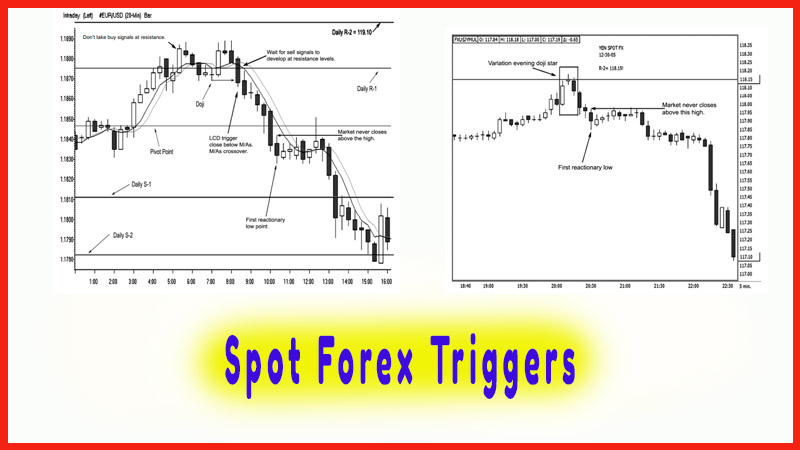
The chart
in Figure 8.17 is a spot forex euro currency that shows once again why it is
important to wait for sell signals at resistance rather than buying breakouts.
The euro currency chart shows the market breaking out above the R-1 level. As a
standard rule, I do not like to take buy signals at resistance (we have covered
that in the pivot point section). I would rather wait for a sell signal to
develop and go with the declining momentum. I believe that one reason why this
signal works so well is that many traders are trying to trade breakouts of
pivot point resistance and, therefore, go long once they see the breakout above
the R-1 level. Once there is little follow- through and prices start to
retreat, sell to get out of their losing trade.
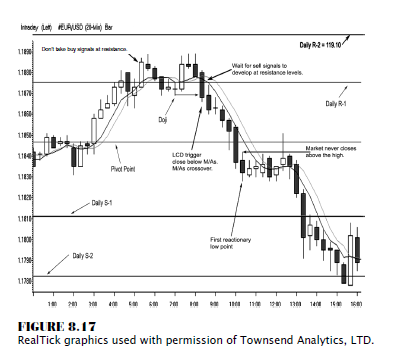
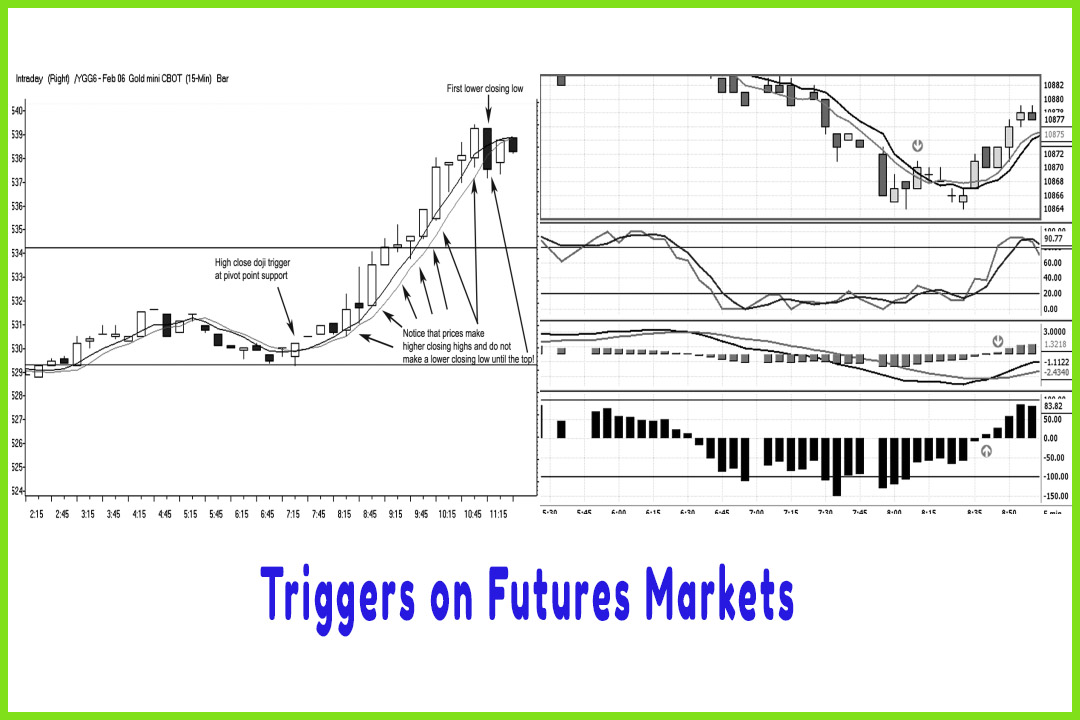
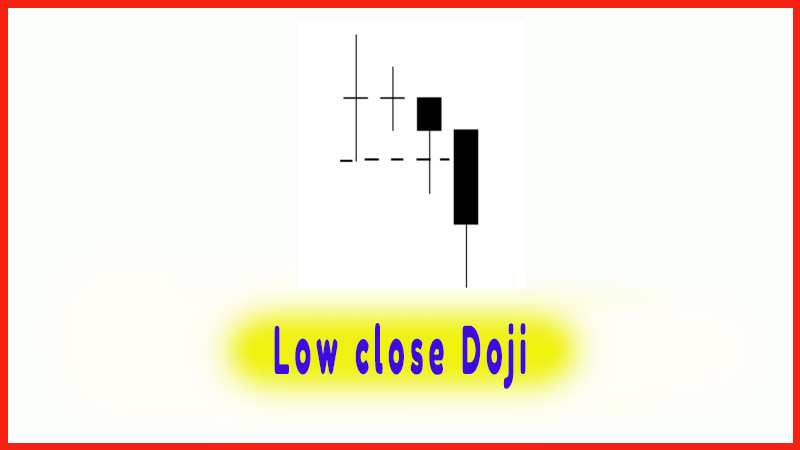
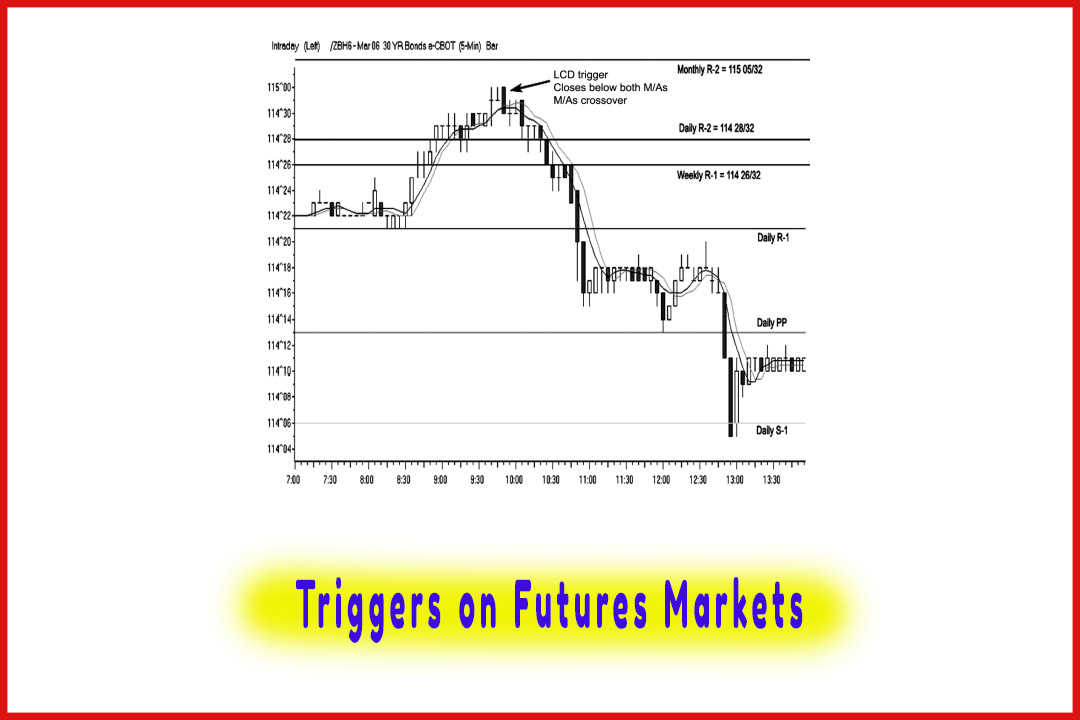
In this example, notice where we have a moving
average crossover—not only do prices close below the doji, but also below both
moving average values.
The
trigger to sell short was executed at 118.67, and we saw an immediate reaction
as prices plunged. The sequence of events that we want to see once we are in a
short position, as in this example, is lower highs, lower lows, and the most
important lower closing lows. Finally, the market pauses at 118.30, where we
would look to cover half to two-thirds of our position, banking a quick
37-point (or PIP) gain per position. Now we can make a decision instead of
placing a hard stop above the initial doji high. We could decide, since the
move was a decent distance away from our initial entry, to place a stop at
breakeven on the balance of our position. As the market enters a consolidation
phase, we see that prices never close above the high of the first reactionary
low’s high. That keeps prices contained in a sideways channel, which is similar
to a bear flag formation. As we follow the flow of the market, notice how the
market declines by the end of the day to the S-2 of 117.80. As a day trader,
there is no question on where you need to exit the position. It is the end of
the day, and you have managed a trade all day and rode a very nice trending
market condition.
Using a
half-position scale-out method, you obviously need to trade at least a minimum
of two contracts. In this example, when you cover half of your positions at
118.30, you pick up $370 per 100,000 full-size contract. You can now afford to
ride the balance. That generates the bulk of your profits, as you would be
covering the other half of the trade at the 118.00 level for a 67-PIP gain, or
$670. Combined, you have a profit of $1,040 on just a two- lot position.
In Figure
8.18, I want to look at a textbook setup in the Japanese yen. This is a
5-minute chart without the pivot point moving averages overlaid to help you see
the progression of the trade and the sequence of the open/close relationship
that candlestick charts display.
As the
market advances toward the projected pivot point daily R-2, traders may assume
the market conditions are in a bullish mode. When you get in that mindset, you
tend to forget about looking at the current market conditions. The top pattern
is not a traditional or classic morning doji star formation because the third
candle does not close below the midpoint of the tall white candle. However, it
does close below the doji’s low; that is the conditional change that takes
place giving us the clue that the bullish momentum has dried up and that a
reversal is imminent. First, there is a lower closing low; then, the market
closes below the open; and finally, prices reversed direction—all after the
market tapped the pivot point resistance level.
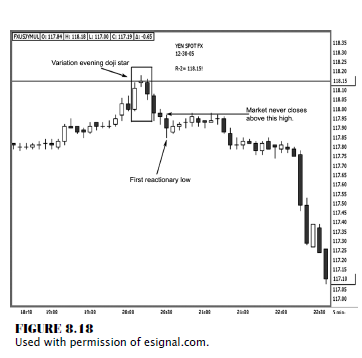
Therefore,
we want to sell on the close or on the very next time period’s open, placing
our stop (initially) as a mental stop-close-only above the high of the doji,
which is 118.18. That is just three PIPs above the daily pivot point resistance
level, too.
Again,
what we want to see is almost instant follow-through for the price to decline.
As you can see with this trade, there was immediate follow through. Notice the
progression of the market as it declines from the entry price at 118.07
straight down to 117.87, for a quick 20-PIP gain. The market then trades back
and forth, creating small-range candles, which form a sideways channel. If you
look carefully at each candle’s close, you will see that it does not close back
above the high of candle that established the first reactionary low. As a
trader, you may want to hold all positions at this time or at least cover half
of your positions for small gain. One reason to do that is because, as powerful
and reliable as these triggers are, we still do not know how far prices can or
will actually move. Remember that the patterns recur; the outcome is what is
different each time.
The
markets could easily reverse back and challenge the highs. By taking money out
of the market immediately on half of your positions, you have profits; and more
important, you reduce your risk exposure in the market.
Always
remember that every time you are in the market, you face risk. So by
establishing a profit and following the flow of the market, you can manage the
balance of your trade with less stress, knowing you have made money. See how
the candles in Figure 8.18 show the true direction of the market: The dark
candles reflect closes below the open. For the most part, there are more of the
dark, or negative assigned, candles, which are establishing lower closing lows,
than there are white, or positive assigned, candles. Not only do they have
smaller ranges, but they do not make higher closing highs. This shows that
every time the market rallies just a little bit, sellers are present. Long
real-body, or negative assigned, candles represent sellers, who dominate this
market. Therefore, staying short on the balance of the position is warranted.
Now, as the market price disintegrates, demonstrating the conviction of
sellers, we can place a hard stop at breakeven on the balance of the position
and start to adjust the stop to protect profits accordingly. This is what
managing the trade is about and what we will go over in Chapter 9.
As a
short-term trader, it is imperative to trade with the current flow or momentum
of the market. Because there are so many variables that can influence your
trading decisions, using the methods described here will help you keep focused
and will alleviate the problem of trading on emotional impulses.
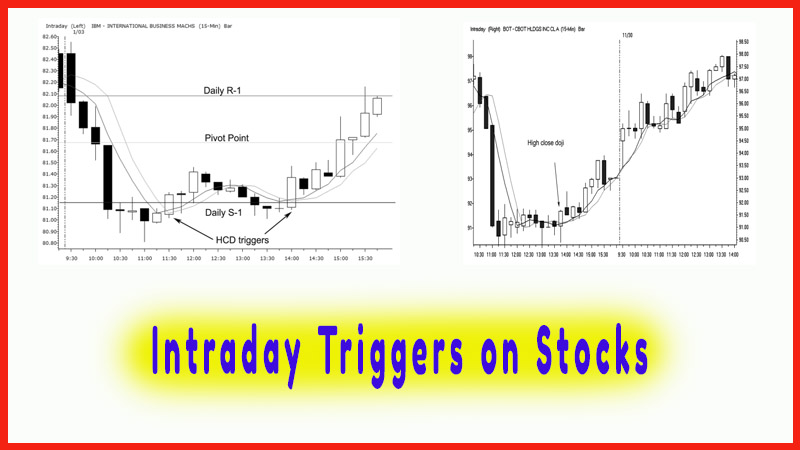
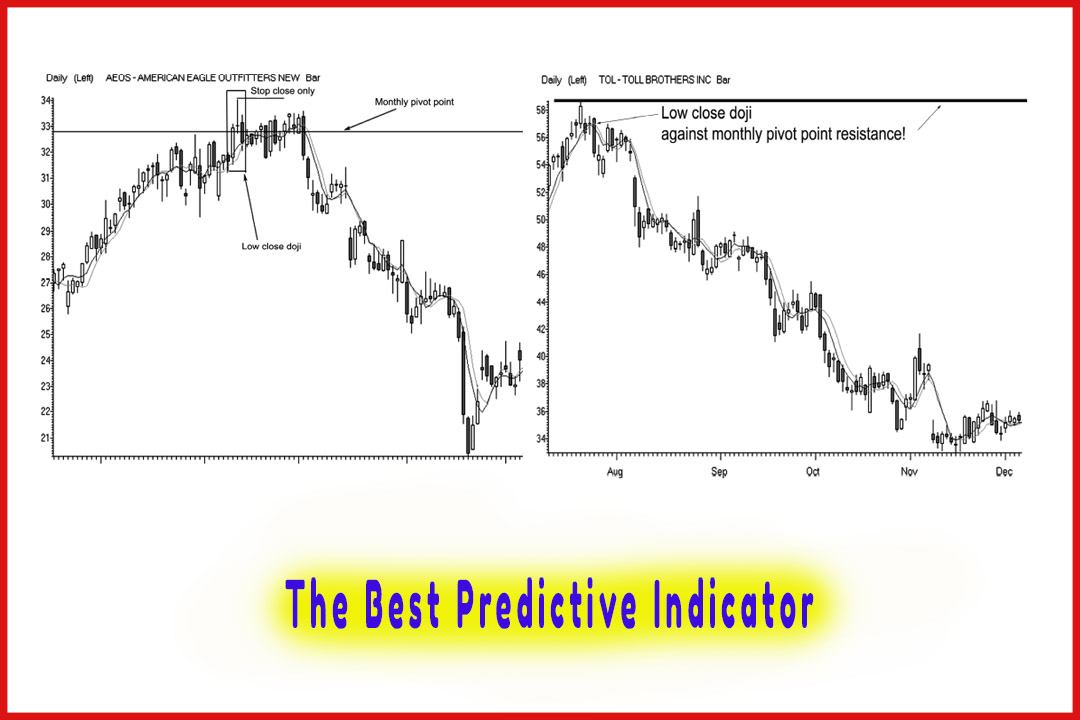
When you
are armed with what the potential resistance levels are, then once you identify
a low close doji signal and then apply trade management techniques, you can
certainly increase your chances to consistently capture profits. It is
literally up to you to pull the money out of the markets. In Figure 8.19, we
have a 10-minute chart, just to illustrate that dojis form on various time
frames as well. As you can see, the market starts to rally and closes above the
pivot point resistance. By not allowing emotions to interfere with your better
judgment, just by applying one mechanical rule—do not take buy signals at
resistance—you will have eliminated the greed factor that often causes a trader
to chase after a market. Therefore, just wait, and practice patience to look
for a sell signal to develop. As you can see in Figure 8.19, after the long
white candle forms, a doji forms. Then, as the method dictates, you do not
enter a short position until you see confirmation of a breakdown in the bullish
momentum by a lower closing low below the doji’s low. Once that occurs, you
enter a short position on the close of that period or on the next open.
Remember that this does not tell you how much money you will make on each
trade. Every outcome is different. There is a strong possibility that, based on
historic reference, you should see a decline in prices; the question is by how
much.
In this
chart, you see an immediate reaction, as you would have entered a short from
122.94; and the bears take over almost immediately. There is a sequence of
lower highs, lower lows, and lower closing lows.
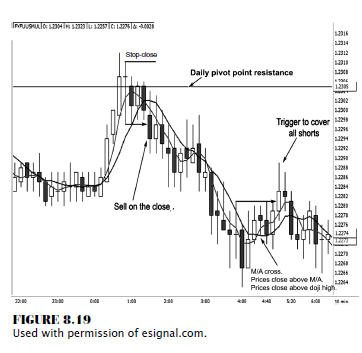
In fact,
using the moving averages, notice the confirmation of a negative crossover and
prices closing below the moving averages. This short-term downtrend ends when
you see a change in conditions once the moving averages cross back up and
prices start to close above both moving average values. This is a sign that the
negative momentum, or selling pressure, is fading and that it is time to exit
your position. Also, notice that a doji forms at the bottom of this downturn;
it is the candle that closes above the doji’s high that makes you commit to
exiting all positions. This trade results only in an 11-PIP gain; but not all
outcomes will be grand-slam home runs. The key is in being able to identify
true conditional changes that will make you act on facts, triggering a call to
action by a set of rules rather than by emotional impulses. If you have the
discipline to trade by a set of rules and to follow those rules, you will reap
some juicy trading profits consistently over a long period of time.
The Candlestick and Pivot Point Trading Triggers : Chapter 8. Setups and Triggers : Tag: Candlestick Pattern Trading, Forex, Pivot Point : daily pivot point levels, support and resistance, moving average crossover - Spot Forex Triggers