Triggers on Futures Markets
dow jones futures, future markets, stock futures, double doji formations triggering, signals triggered
Course: [ The Candlestick and Pivot Point Trading Triggers : Chapter 8. Setups and Triggers ]
Let’s look at implementing a confluence of pivot points and see how the market behaves at these longer-term resistance projections.
Triggers on Futures Markets
Let’s
look at implementing a confluence of pivot points and see how the market
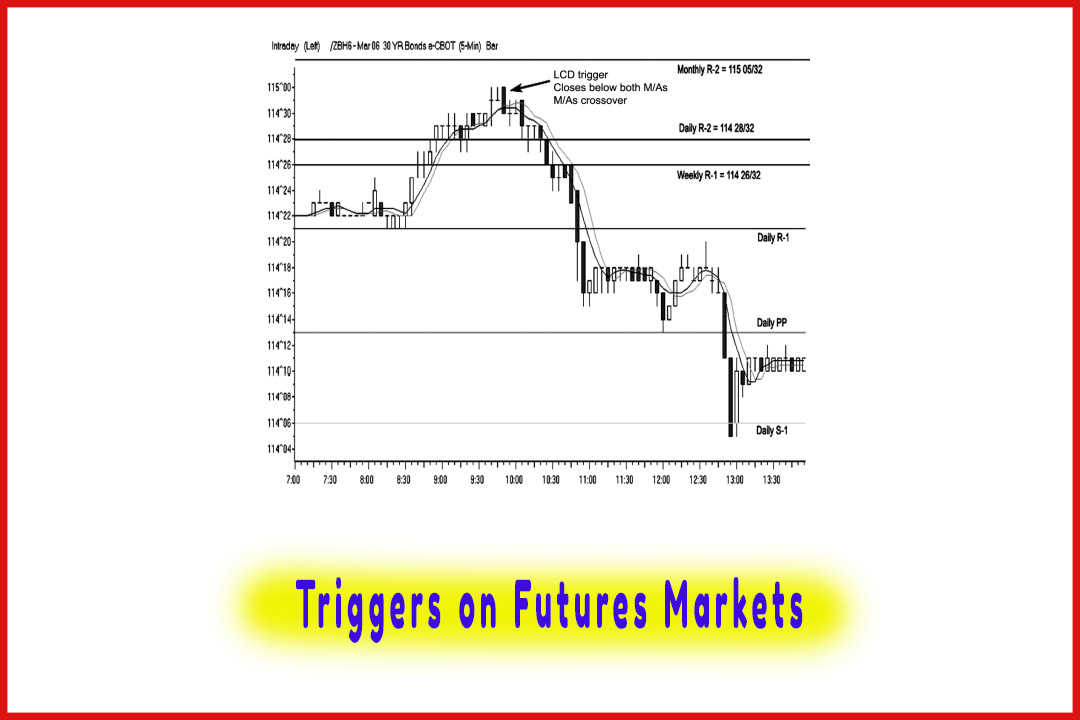
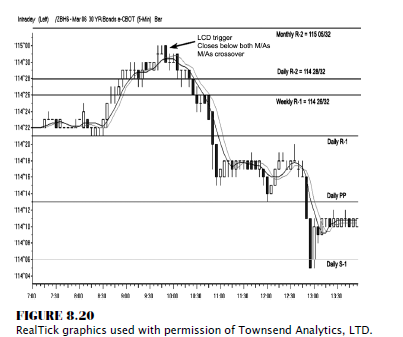
behaves at these longer-term resistance projections. In Figure 8.20, we have
the daily, weekly, and monthly numbers all concentrating near 115 in the bonds.
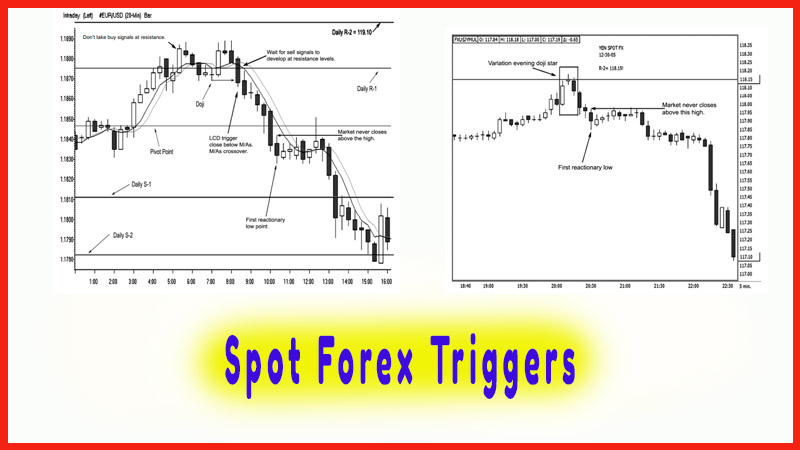
This chart is a 5-minute time period that illustrates again why it is important
to look for sell signals at resistance and for buy signals at support.
Many
traders fail to see the bigger picture and get caught up in the excitement of a
trending market condition. As prices trade above the daily R- 2 pivot point,
some traders look at their R-3 numbers and think they are on a “cash cow” train ride that will never stop climbing higher.
By examining the higher-degree time periods, such as the weekly and monthly
numbers, you can get a better idea that the market may soon run out of steam as
there is hidden resistance from longer-term pivot analysis. Practicing
discipline by not following the herd mentality and demonstrating patience to
wait for a sell signal will lead to a more fruitful opportunity.
As you
can see, once the market closes below the double doji formations triggering a
short position, the moving averages cross and the market closes below both
values. Once again, here is the market reaction as bulls scramble to sell out
their longs. The trigger to sell short was 1142832, and the market plunged to
114%, for a quick %-point decline (each point is $31.25), or a gain of nearly
$400 per position. Notice how the market pauses or consolidates forming a bear
flag. Here is where tightening your stops and covering half or two-thirds of
your positions would again come into action and be a wise and profitable decision.
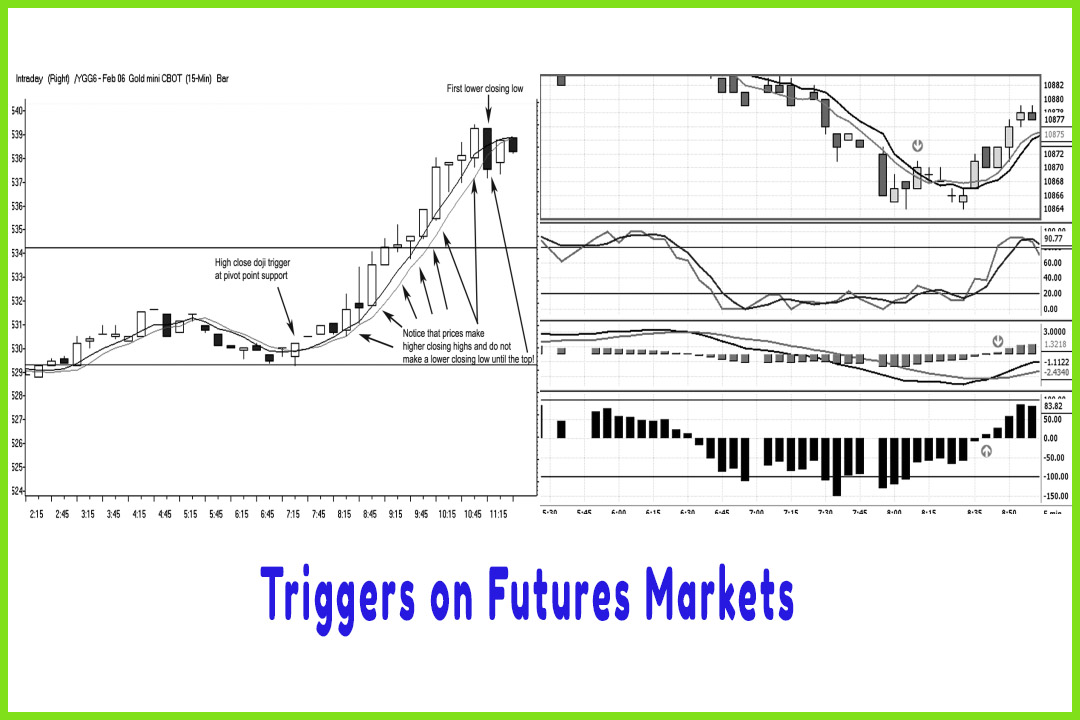
The LCD
signal works on most active markets, as long as there is volatility and price
movement. In late 2005, as commodity markets came alive, the Chicago Board of
Trade’s electronic gold contract allowed easy access to take advantage of some
pretty good intraday moves.
With the
statistical study done in Chapter 7, it makes good sense to diversify in other
markets that respond to certain technical patterns, such as dojis, hammers, and
shooting stars. It is also rewarding to see how robust this method is, as it
works in no- to low-correlation market relationships and in various time
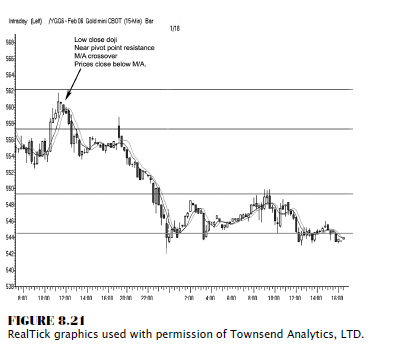
periods. In Figure 8.21, as bullish as gold was in 2005, there were periods of
consolidation. No market ever goes straight up. A sector or market segment
trading with such high interest as gold attracted many traders. In this example,
a sell signal was triggered at 559.70, and we started to see a progression of
price deterioration down to the pivot support of 544.00.
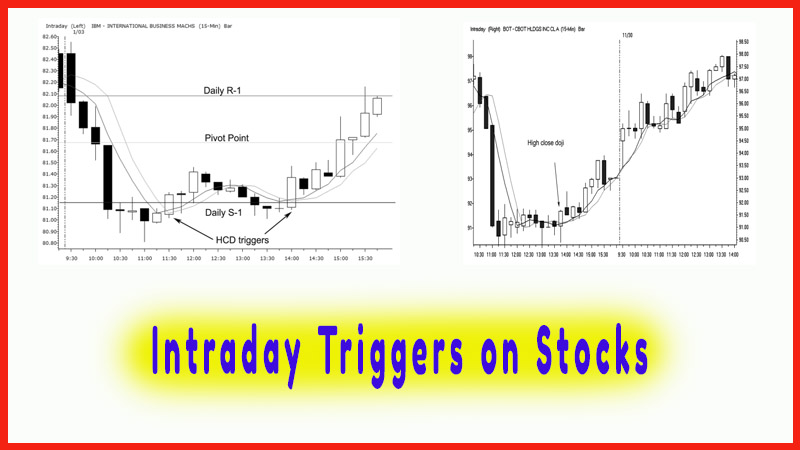
Utilizing
the stock index futures is one of the better markets for day traders, as we
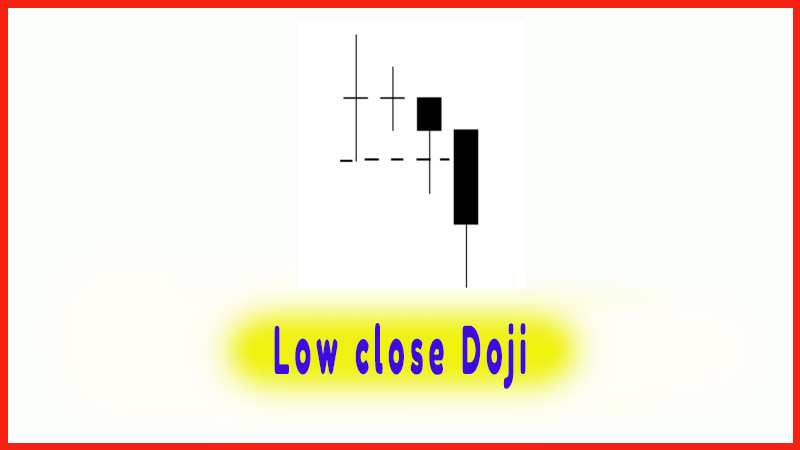
have discussed. The low close doji trigger is a highly effective pattern in
these markets. Figure 8.22 displays the e-mini-Standard & Poor’s (S&P)
on a 15-minute candle chart illustrating an entry based on the close below the
doji low, a negative crossover from the moving averages, and confirmation that
prices closed below both moving average values. Here we have a trigger to sell
short at 1239.25. Prices continue to follow the same progression of a pause or
consolidation, and then continuation of the
downtrend resumes.
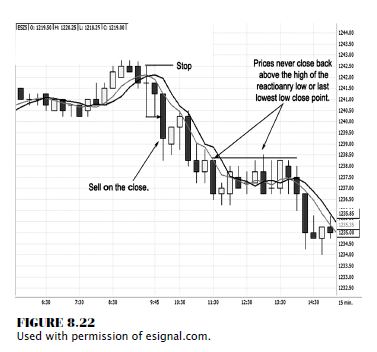
During
the consolidation period, notice that prices do not close above the high of the
last reactionary low point. In fact, notice the doji as the sideways channel
develops; prices do not close above that high either.
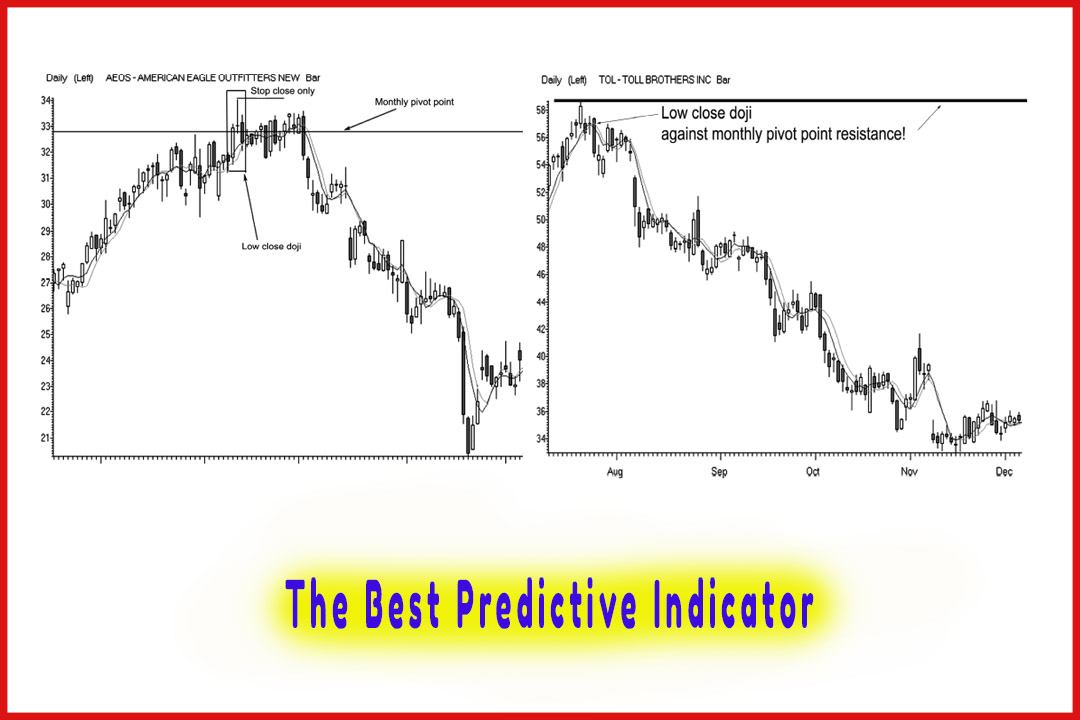
The low
close doji pattern, when combined with the three elements using pivot point
analysis, is a very effective trading system. You are not simply relying on
predicting a top, but rather waiting to see a conditional change occur in the
market. By following the flow of the markets—lower highs, lower lows, and lower
closing lows—you can really stay in the trade and, more important, on the right
side of the market. Examine Figure 8.23, which is a 5-minute chart on the CBOT
mini-Dow contract. You will notice that it is not the same chart as in Figures
8.19, 8.20, or 8.22 and that the signals are triggered at different points in
time and in different time periods, just to prove the frequency and
effectiveness of this pattern. Here we see the market trade up just past the
daily projected pivot resistance target. While the high was actually formed by
a shooting star, the real trigger to sell occurred at the time period that
established a close below the doji’s low. Notice the three elements that help
confirm a trend reversal: price close below both moving average values and the
two moving average components crossed, with the short-term moving average below
the longer term moving average.
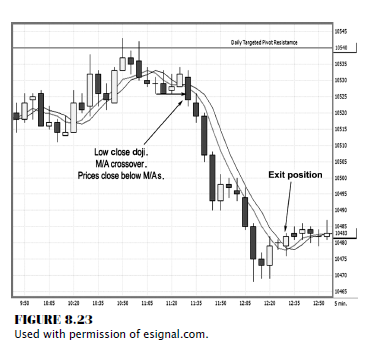
The trigger to sell short occurred at 10523,
and the exit was confirmed with the high close doji signal at 10483, for a tidy
gain of 40 Dow points, or $200 per contract, based on a day trading margin of
$500. (Day trading margins vary; initial margin requirements to hold a futures
position overnight is $2,632 as of 2/1/2006.) That is a trade setup I watch and
wait for, day in and day out; and it works on most markets in most time
periods.
The low
close doji setup combined with pivot points and the moving average component
really allows you to see the change in price momentum. As a screen-based day or
swing trader, you have superior advantage over floor traders or other traders
when using charts, pivot points, and the progression of a moving average
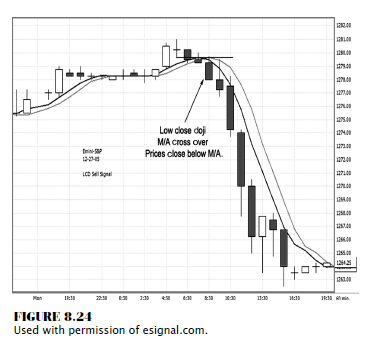
component. In Figure 8.24, we have a 60- minute e-mini-S&P chart showing
the price deteriorating once the trigger was made by a close below the doji
low. Notice, too, that the moving averages crossed and prices closed below the
moving averages as well. This signals a trigger to sell short at 1278; and by
the end of the day, the market was at 1264. There was never a signal to exit
the short position, which resulted in a 14-point gain, or $700 per contract.
Now, this is over 140 percent gain on a 500 margin in a single day.
Case in Point
Combining
the statistical data that we went over in Chapter 7 (which indicated the
frequency with which dojis, hammers, and shooting stars form) with the
correlating markets (such as the S&P, the Dow, gold, and currency) gives
you high-performing patterns; and trading using these patterns should not be
ignored. If the markets outlined here have both a high frequency and a strong
tendency to form tops and bottoms by the developing doji candle and if you
learn to wait for that specific setup and act on a trigger rather than guessing
or anticipating when a market is ready to turn, you may see a significant
improvement in your trading results.
The Candlestick and Pivot Point Trading Triggers : Chapter 8. Setups and Triggers : Tag: Candlestick Pattern Trading, Forex, Pivot Point : dow jones futures, future markets, stock futures, double doji formations triggering, signals triggered - Triggers on Futures Markets