The Jack Hammer
hammer pattern, Best trading Pattern, Jack Hammer
Course: [ The Candlestick and Pivot Point Trading Triggers : Chapter 8. Setups and Triggers ]
The jack hammer, however, develops in the middle to the end of the trading session. Usually immediately following the hammer is a bullish candle, or a marabuzo, a tall green positive (+) assigned candle.
THE JACK HAMMER
In
my experience, the one candle pattern that is associated or synonymous more
than any other with the word capitulation is the hammer as Figure 8.30 shows.
In Chapter 7, we identified the frequency or the percentage of times over a
course of the year on a 15-minute time interval when the hammer candle pattern
formed at or near the low of a given day. The jack hammer, however, develops in
the middle to the end of the trading session. Usually immediately following the
hammer is a bullish candle, or a marabuzo, a tall green positive (+) assigned
candle.
What
specifically describes the jackhammer? The jackhammer pattern is a hammer
candle, but it occurs in the middle to the end of a trading session. I call it
“the search and destroy” stop-loss order pattern. The general market
characteristics of this pattern starts off with the market establishing a low,
then consolidates or trades sideways for a bit, and then without warning sells
off abruptly. It is generally that particular sell-off that creates a hammer
pattern. Therefore, anyone who had intraday stops too close, under what is
considered the primary low for the day, got “bagged and tagged.” In other
words, stop-loss orders were elected, and longs were jacked out of their
positions and money—as in hit over the head with a billy club and “jacked”
(robbed).
Trading Rules Defined
The
jackhammer formation is an extremely powerful intraday reversal formation that
requires immediate action to enter a long position. The sequence of events that
occur for this pattern is:
- The hammer formed is a secondary low with the close at or near the primary low’s low.
- It does not matter whether the real body is formed with a higher close than open or positive assigned value; however, it is generally a more solid signal when the close is above the open.
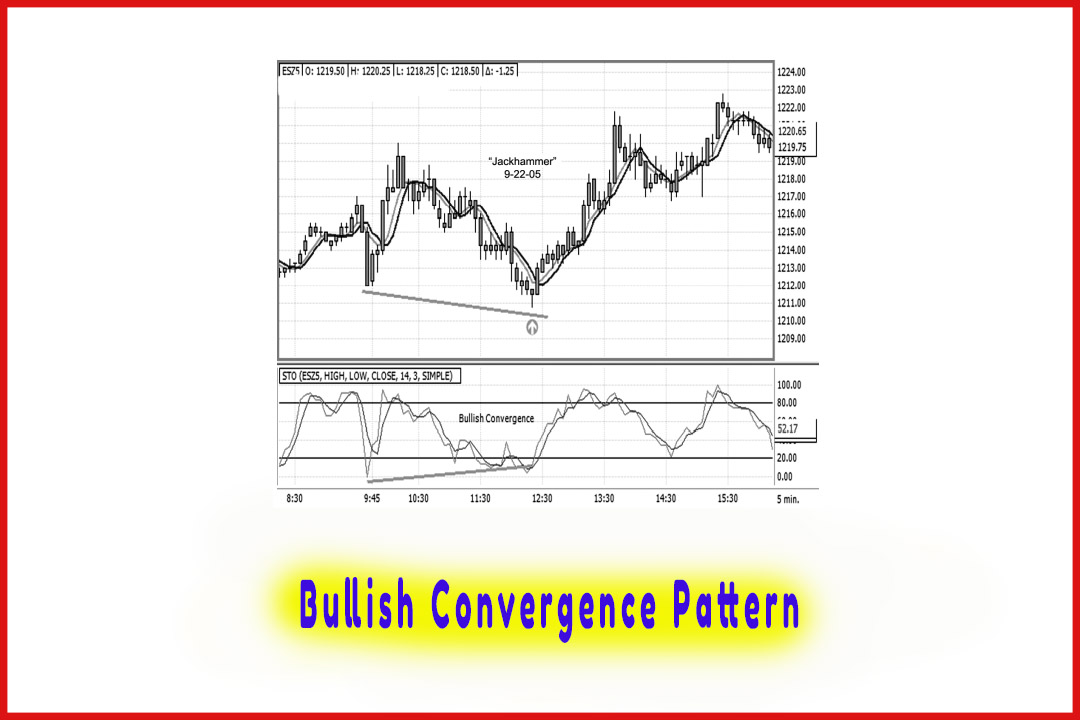
- This action generally completes a bullish convergence in the stochastics or MACD oscillator.
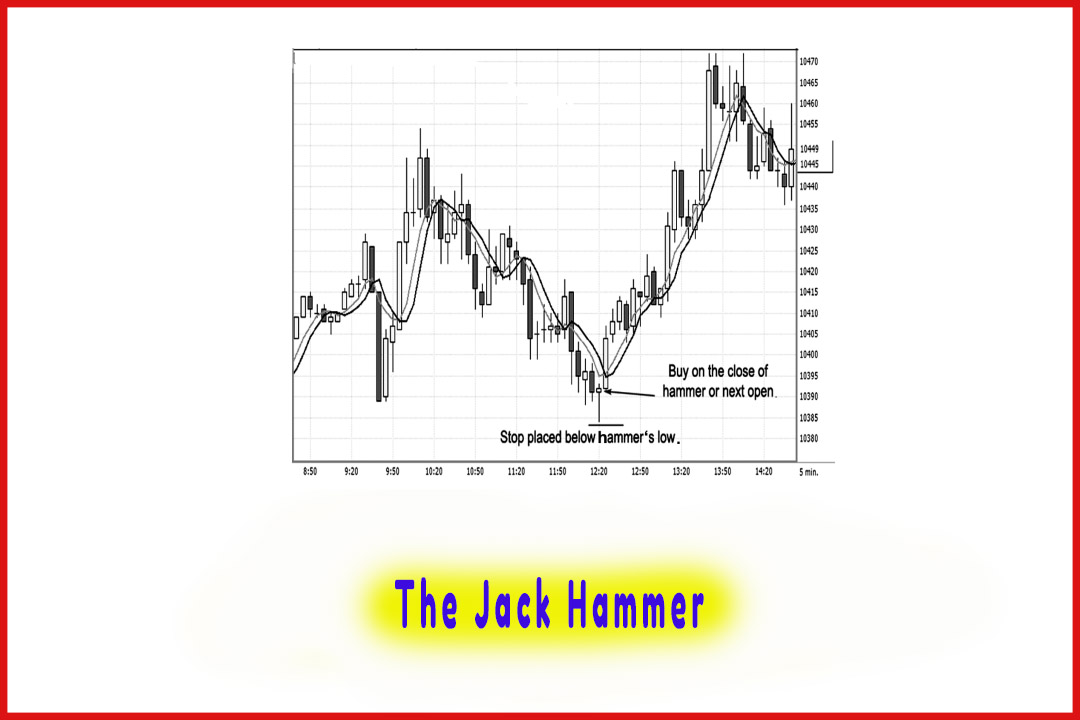
- Buy on the close of the hammer or the next time periods’ open; initial risk is a regular stop below the hammer’s low.
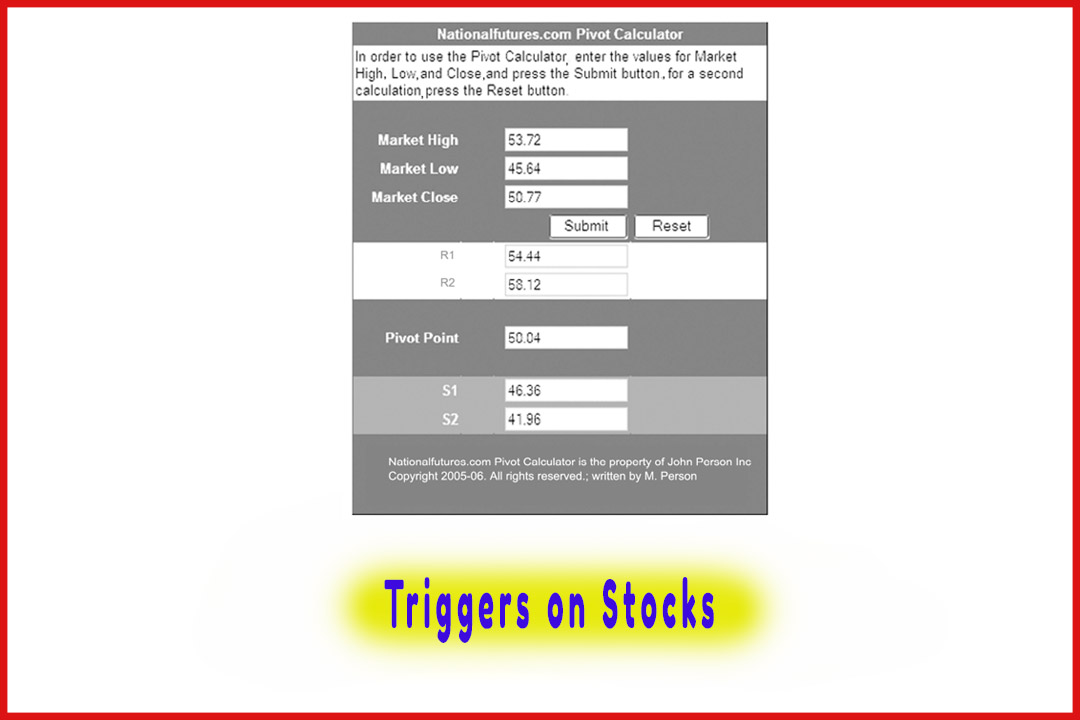
- Give additional importance if this pattern develops near pivot point support targets, especially if there is a confluence of pivot support targets from different time frames.
- Stock traders should watch for an increase or a volume spike, which indicates an exhaustion bottom is confirmed.
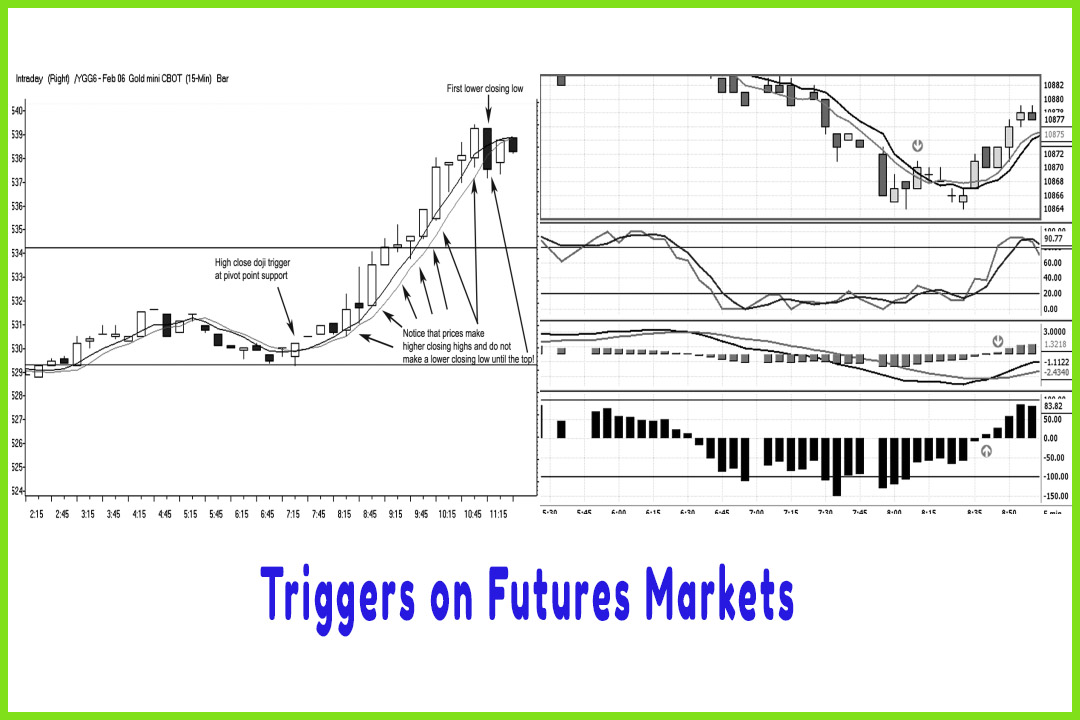
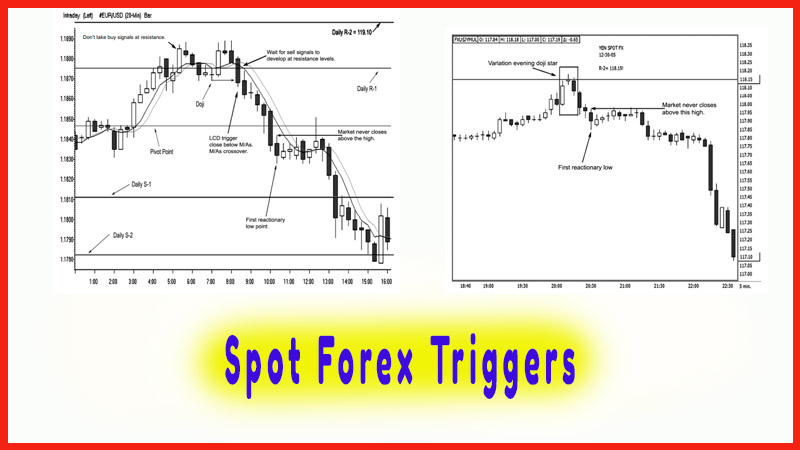
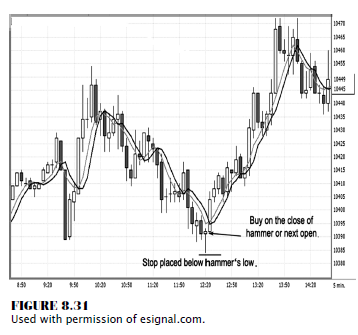
Figure
8.31 shows a 5-minute chart on the CBOT mini-Dow. Notice that the “midsession”
is defined by the middle of the day. The first intraday low has been
established, nearly three hours pass by, and the market makes a nosedive as
prices hit a new low for the trading session. In this example, the hammer
closes back within the primary low’s range. The trigger to go long is on the
hammer’s close or on the open once the hammer formation is confirmed.
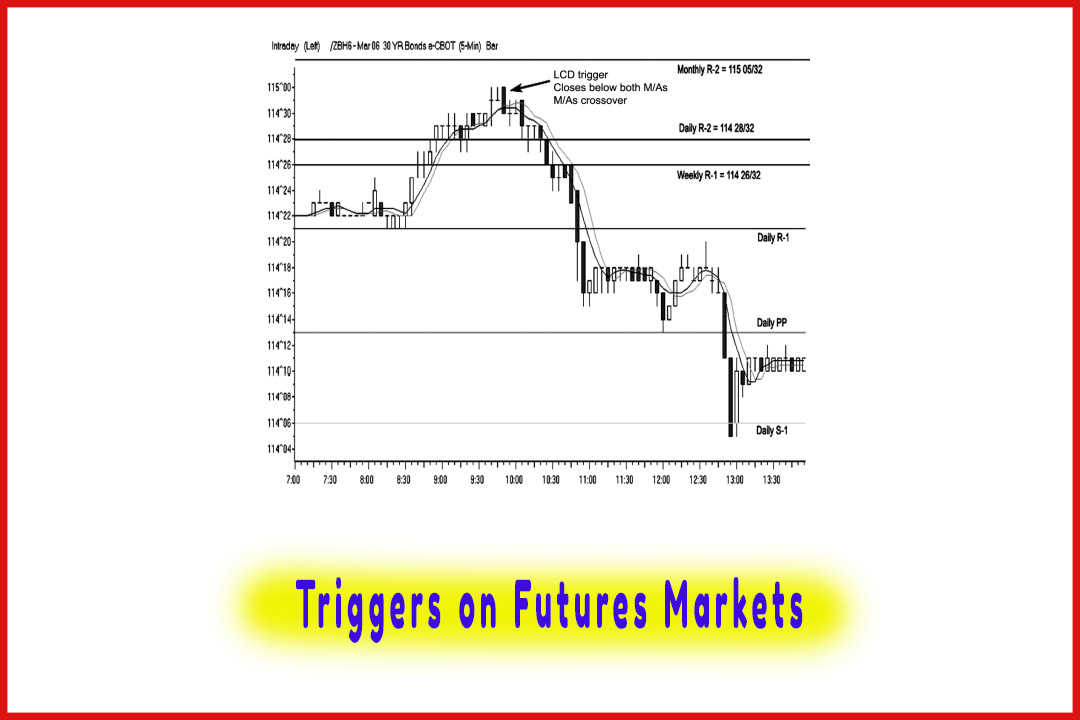
Generally, the jackhammer is followed by a
blast-off secondary candle as prices surge ahead. What we also have happen is
that the market crosses above both moving average values, thus signalling
confirmation that this is a valid buy signal. The trigger to buy was at 10393;
as you can see, the market ran straight to 10473 before giving an LCD trigger
to exit at 10443 for a 50-point Dow move, or $250 per contract.
So far in
this book, I have given you several patterns that work well for great day
trading vehicles, such as the stock index futures contracts. The electronic
markets offer retail traders a competitive advantage because they can use a
home computer with a DSL or a broadband connection to integrate charting
software packages and equal access to markets. The stock index futures
contract, such as the mini-Dow contract, has what technical and fundamental
traders need: News-driven events and other technical trading market
participants both provide volatility and liquidity. Many of the chart examples
contained in these pages are a great representation of an average day’s trading
patterns. That’s not to say the other stock index markets, such as the
e-mini-S&P and the Russell, perform differently; they interact extremely
well with each other. In fact, at times I may have a trigger in the mini-Dow
and take the trade in the S&P, and vice versa. Most times, when the Dow
gives me a trigger, that is the market I will trade in. Consider that the
e-mini-S&P have an influence from the tech sector. Dow at times may or may
not have a similar dollar value move as the S&P. Both markets are great day
trading vehicles, as is the Russell. The Dow more times than not has more
distinct trading signals; for that reason, I have il-lustrated these setups
with using the Dow.
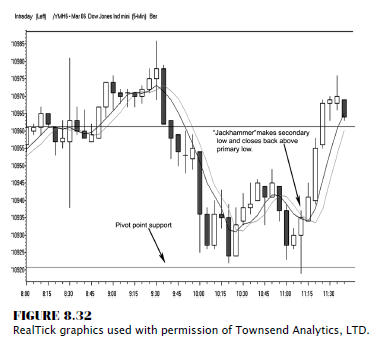
As
another example of spotting a jackhammer pattern, look at Figure 8.32, which is
another 5-minute chart in the Dow. Here you see the secondary low bounce right
off a pivot point support; and as the white or positive assigned values show,
the candles’ closes are above the opens and what is indicated immediately after
the hammer forms. Notice the immediate reaction of the market as the sequence
of higher highs, higher lows, and higher closing highs occurs. You can also see
confirmation of the buy signal with the moving averages crossing over and with
the second candle after the hammer is formed—it closes above both moving
average values. This is the confirmation that should give you the confidence to
maintain a long position. The stop is initially placed below the hammer’s low.
This should not be a stop-close-only as this setup should see an immediate positive
reaction. The trigger to go long here was at 10935; the first sign that the
bullish drive lost momentum was the lower closing low at 10965, which resulted
in a quick 30-point gain.
There are
times when we see this pattern late in the trading session. But keep in mind
that the CBOT Dow contract trades continuously until 4 p.m. (CT), whereas the
e-mini-S&P closes at 3:15 p.m. (CT) and reopens at 3:30 p.m. (CT).
This
offers day traders more time to play those short squeeze plays that tend to
occur toward the end of the day. More important, I covered why I do not look to
sell at support levels. These short squeeze plays occur as those who may have
sold at higher levels look to cover and take profits, as we see at certain times
when the secondary low was rejected, which is what the hammer represents.
Prices tend to move sharply higher in a very short period of time, signifying a
rejection of lower prices. It is that price action that shows buyers attracted
to the market, and bears start buying back or covering their shorts.
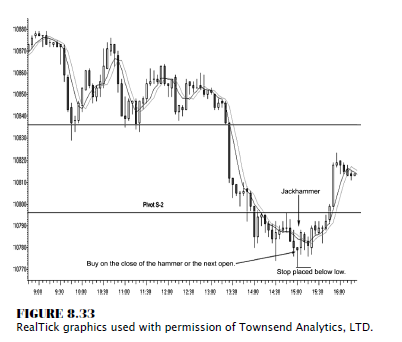
Therefore,
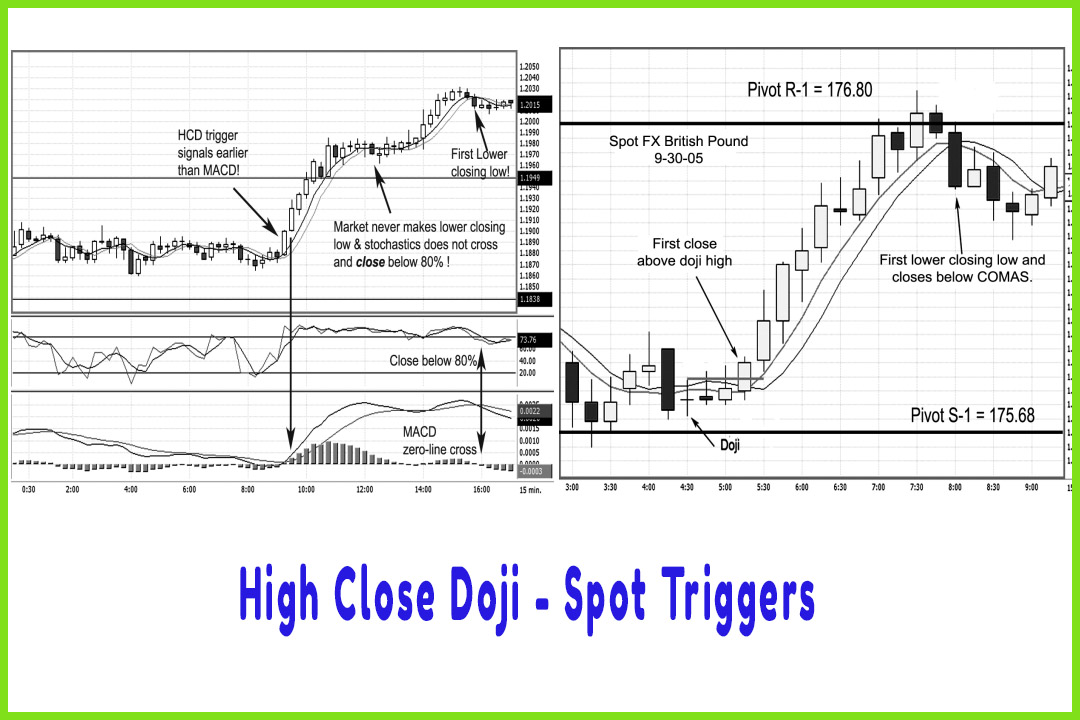
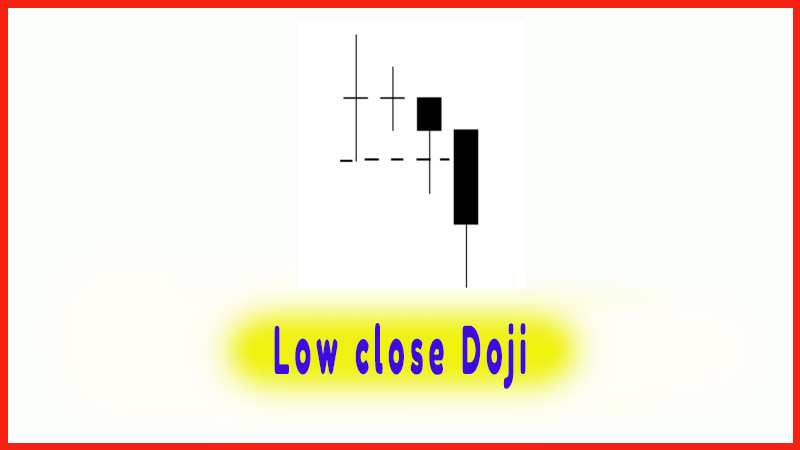
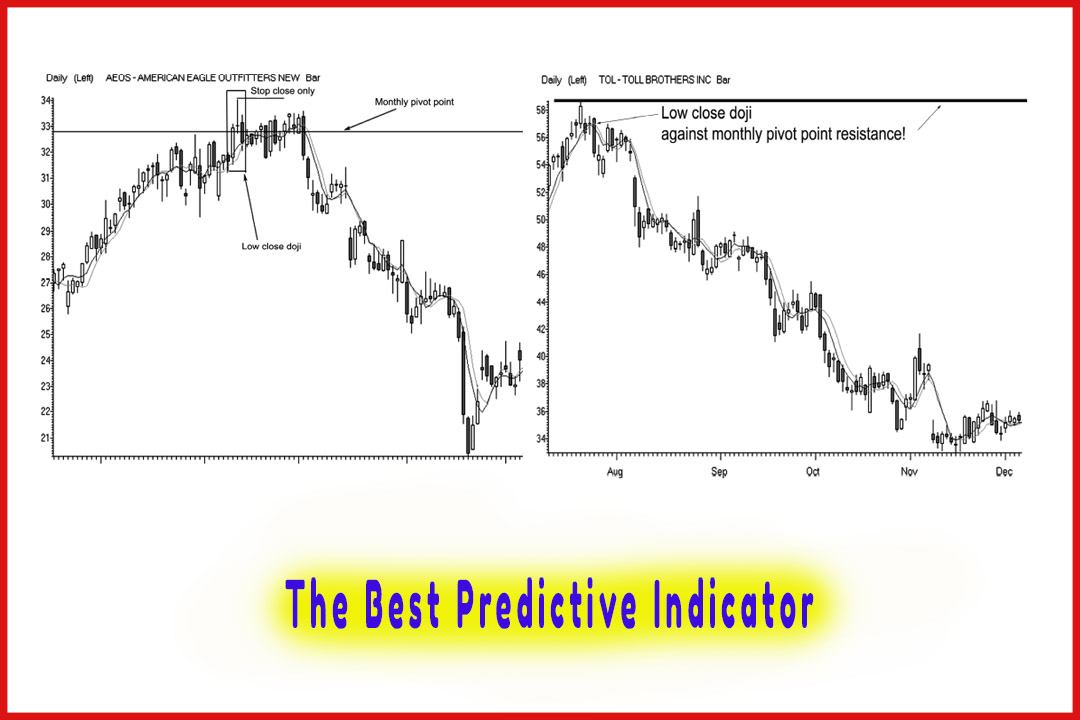
when you are looking for a pattern such as the high close doji or the
jackhammer in this situation, it is a more fruitful venture. One great example
is in Figure 8.33, where the jackhammer forms near the end of the session. The
trigger to go long was at 10784, which we see as almost an immediate reaction
for prices to move sharply higher to nearly 10830. This was another quick 40-point-plus
gain, or $200 per contract. Again, this does not sound like big money; but when
you consider that the day trading margin is $500 at most online brokerage
firms, that is a healthy percentage gain.
Trading Tips
- If the stop level is too great a distance, lower or reduce your contract size.
- Place hard stop below the low of the hammer candle.
- Scale out of positions when the market gives you a windfall profit, and move stops on balance of position above your entry price.
The Candlestick and Pivot Point Trading Triggers : Chapter 8. Setups and Triggers : Tag: Candlestick Pattern Trading, Forex, Pivot Point : hammer pattern, Best trading Pattern, Jack Hammer - The Jack Hammer