Intraday Triggers on Stocks
Hammer candle pattern, How to trade Intraday in stocks, How to trade intraday in forex, how to trade doji setup, Daily pivot point
Course: [ The Candlestick and Pivot Point Trading Triggers : Chapter 8. Setups and Triggers ]
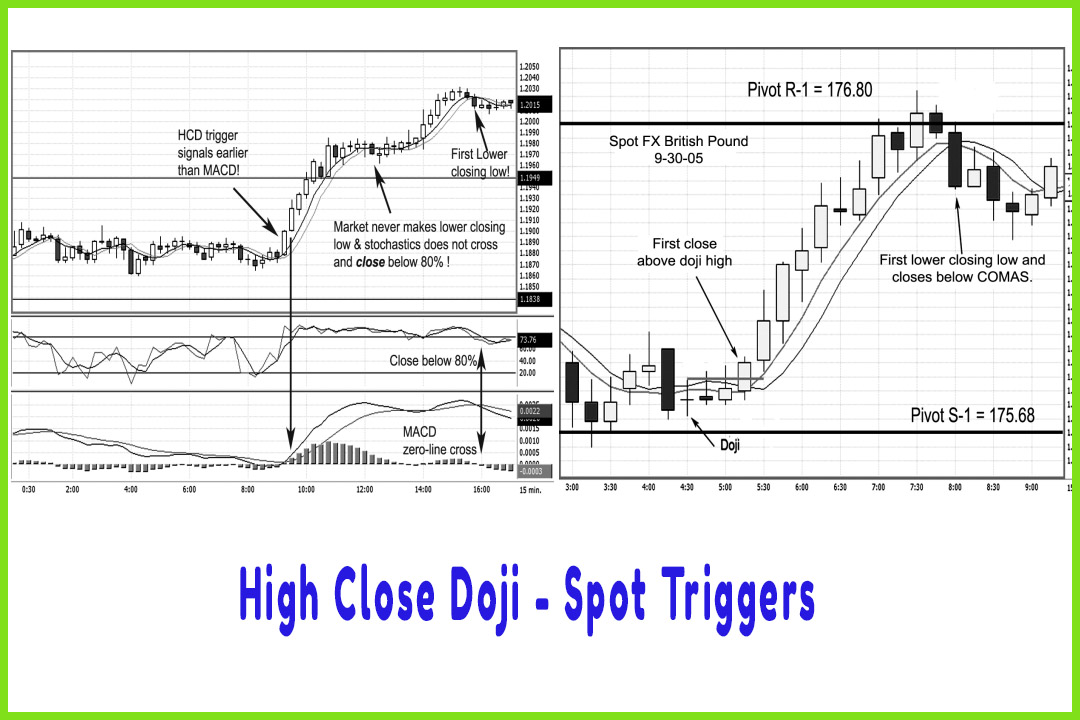
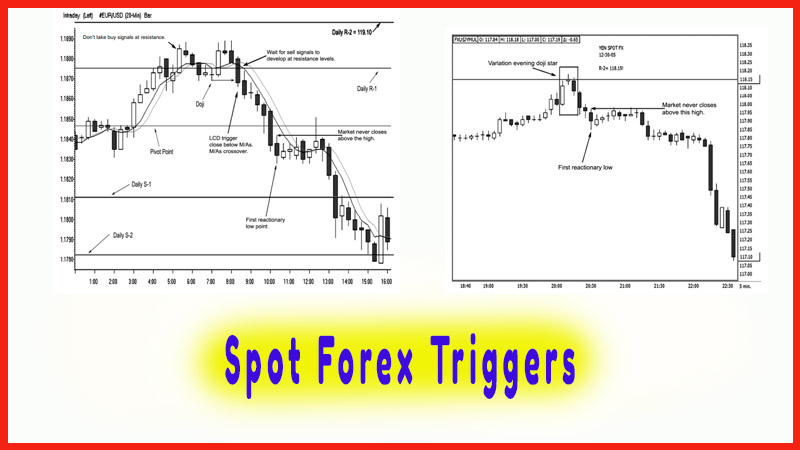
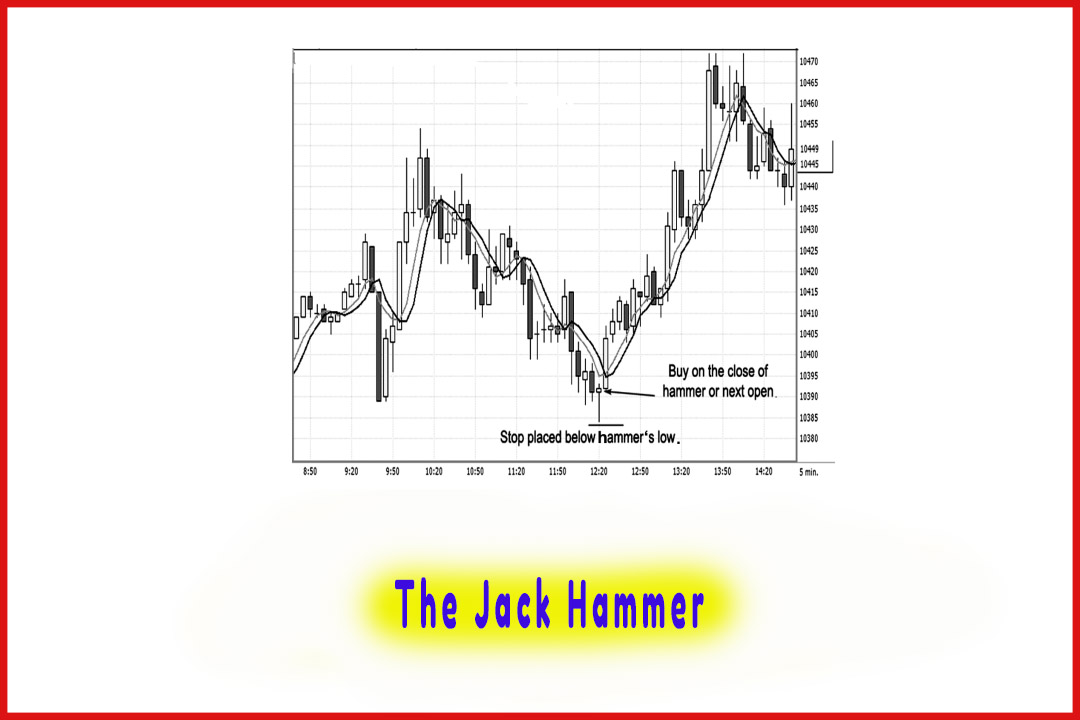
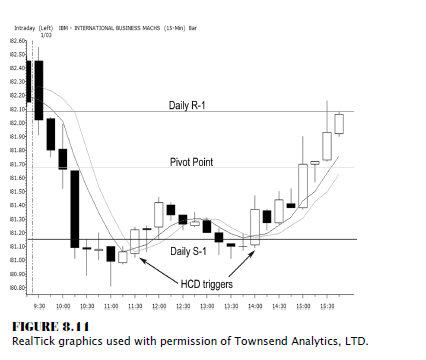
Let’s look at a 15-minute chart on IBM, a fairly popular stock, and see how this method applies for day traders. Figure 8.11 shows a double bottom formed with the primary low formed by a doji followed by a hammer.
Intraday Triggers on Stocks
Let’s
look at a 15-minute chart on IBM, a fairly popular stock, and see how this
method applies for day traders. Figure 8.11 shows a double bottom formed with
the primary low formed by a doji followed by a hammer. The higher close occurs
at 81.24, with immediate results following. Prices peak at 12 noon around
81.50, only to fade back after the crowd decides to take profits before
lunchtime. The initial risk target has not been challenged during that time
frame. Then, as volume picks up as traders return in the afternoon, another
doji forms, followed by a second HCD signal. See how the market hugs the daily
S-1 pivot support as well. The market enjoys a nice gain with the very sequence
we like when we are in a long position: higher highs, higher lows, and higher
closing highs, right up to the daily pivot point R-1 target high.
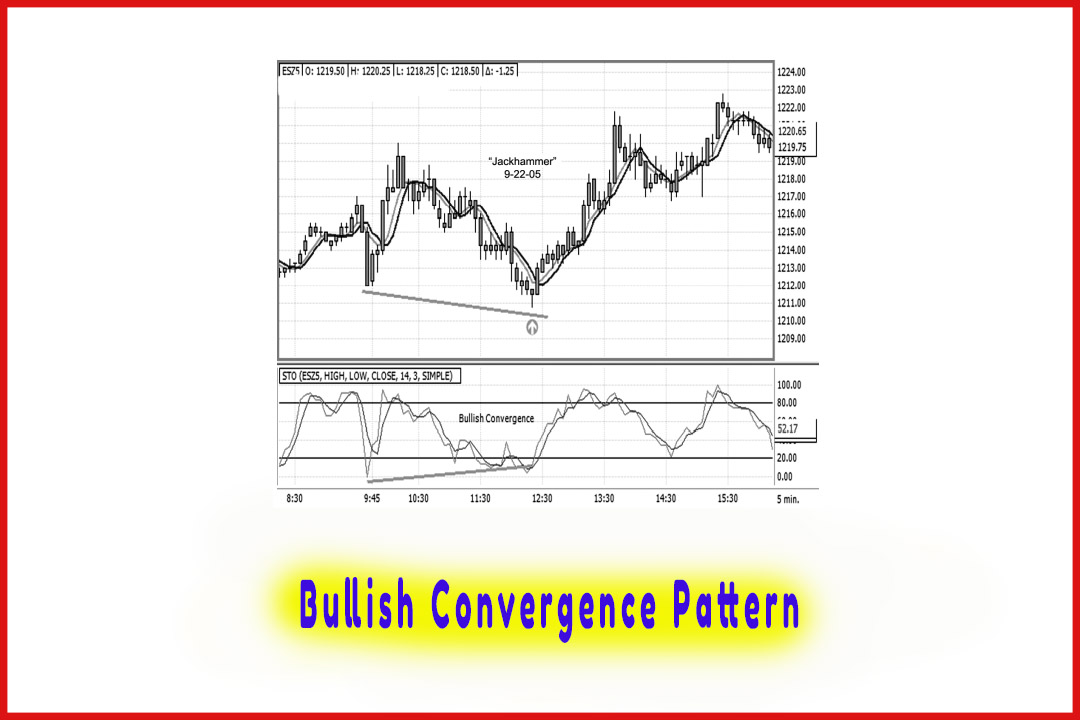
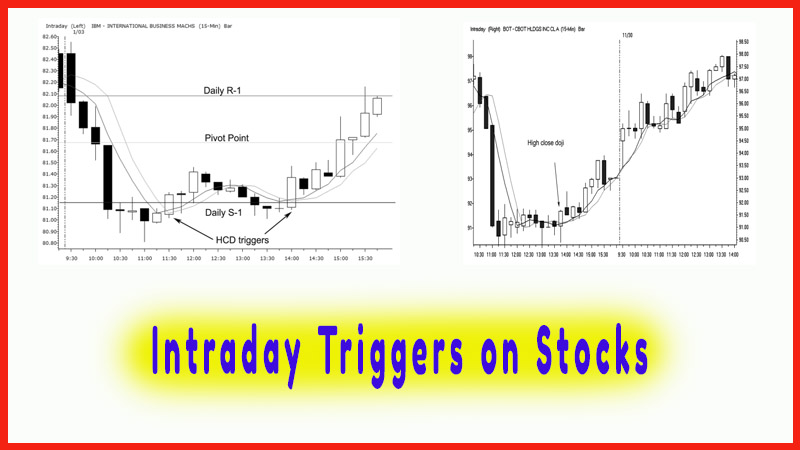
Let’s
look at another stock example. For those stock traders not looking to trade
commodities but wanting to participate in the action, here is a novel
opportunity. One consideration should be to buy stock in the Chicago Board of
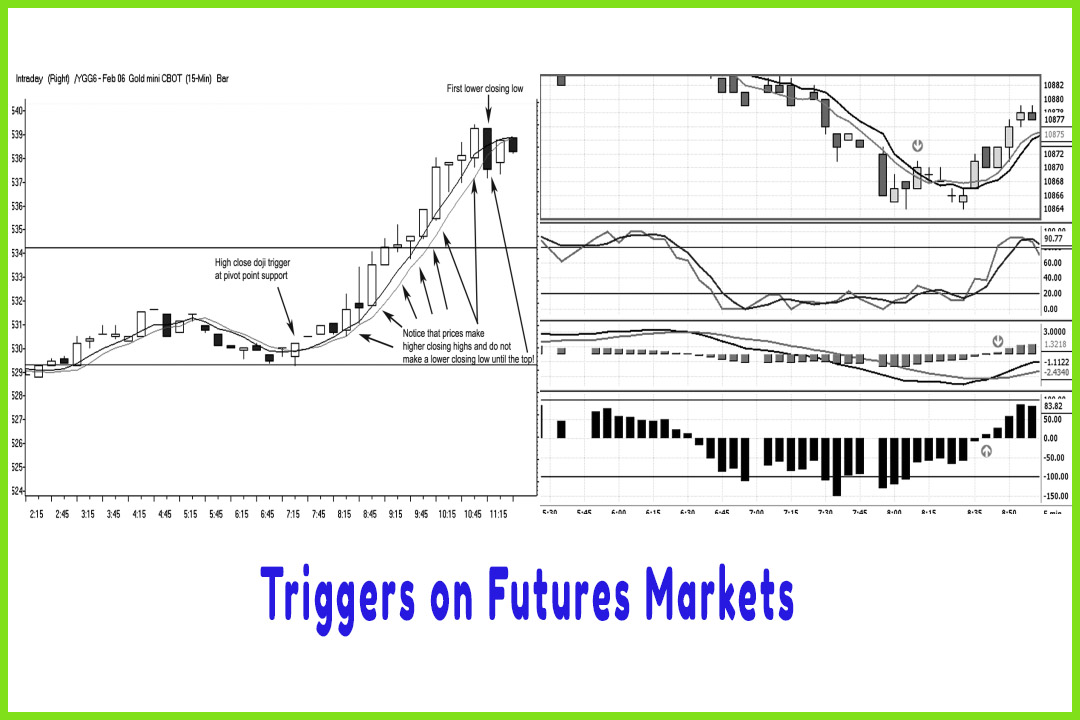
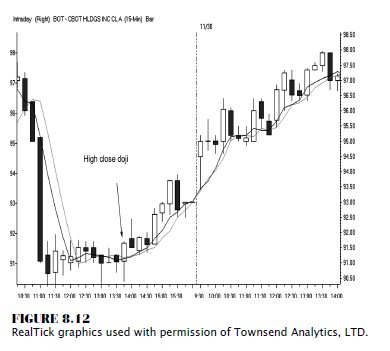
Trade. That way you will own a piece of the exchange! Figure 8.12 shows a
15-minute chart on CBOT holdings.
Notice
that the HCD trigger is made by a higher close than open hammer candle pattern;
and as you can see, the market reacted strongly as the trend sequence developed
once again with higher highs, higher lows, and higher closing highs. This stock
generated a buy at 91.70, closed at 93.00, and kept following the money trail
into the next day’s trading session. In fact, the market kept trading higher up
to 119 as of February 24, 2006, when I was editing this book. I would imagine
that as volume increases, this stock can trade higher for years to come. It has
a pretty good track record staying in business; it has been around for over 155
years.
Let’s
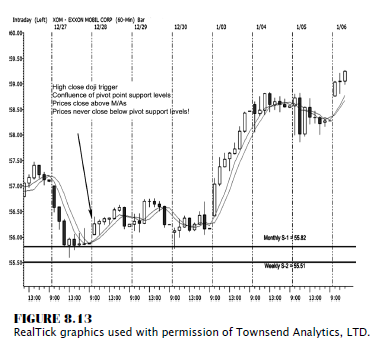
look at another commodity-related stock; this one is Exxon. By now, everyone knows
that this company generated the highest profit in a given quarter of any
company in the world. As energy prices bounced around, so did this stock. In
Figure 8.13, we have a 60-minute chart for a swing trade, showing the weekly
and monthly pivot points that are helping to illustrate and uncover the hidden
support value. As the market declines, the doji formations develop at these
confluence levels of supports. Then, as the moving average crosses and as
prices close above the doji highs, we have a confirmed buy signal.
There was
never any pressure of loss on the trade; but even if you were bored with the
trade, a secondary trigger was generated three days later at 57.00.
Notice
the trending market condition and the sequence of events that we are looking
for when in a long position; higher highs, higher lows, and higher closing
highs. Also note that the white candles signify that the market is closing
above the open on each time period, demonstrating that buyers are dominating
the market. This chart pattern resembles a “W”
bottom pattern, which is quite similar in formation to the IBM chart in Figure
8.11. It is interesting that these two stocks showed this formation on
different dates as well.
I have
illustrated how the setup and signal work for intraday time periods. Let’s take
a look at how we can apply the methods combining all the techniques, including
the pivot point moving average crossovers, pivot point support targets,
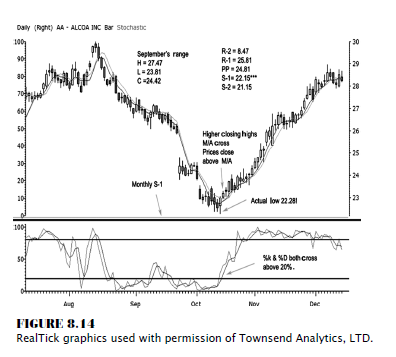
stochastics, and the high close doji. In Figure 8.14 we are looking at Alcoa;
the stock went into a nasty tailspin, as most markets did in October 2005.
However, after long price declines, you do not want to get too bearish in the
hole, so to speak, especially on high-quality companies implementing the
longer-term monthly pivot point methods. We uncovered that there was support at
22.15 and a potential bottom or end of the decline. Granted, the low was 22.28,
so we were off by a small margin. But notice how when using my methods, the
signal to go long was triggered once the market closed above the moving
averages; a high close doji trigger prompted a long position; and the
stochastics confirmed the long trigger, as %K and %D both crossed and closed
above the 20 percent line.
If you follow the flow of the market, you will
see that the sequence of events that transpire is higher highs, higher lows,
and the most important feature: higher closing highs! Now, that was a gem of a
move! The best part about this method is that it keeps you focused on specific targets
and keeps your risk to a minimum, allowing you to be a more relaxed and a more
confident trader, letting the trade mature and generating bigger profits.
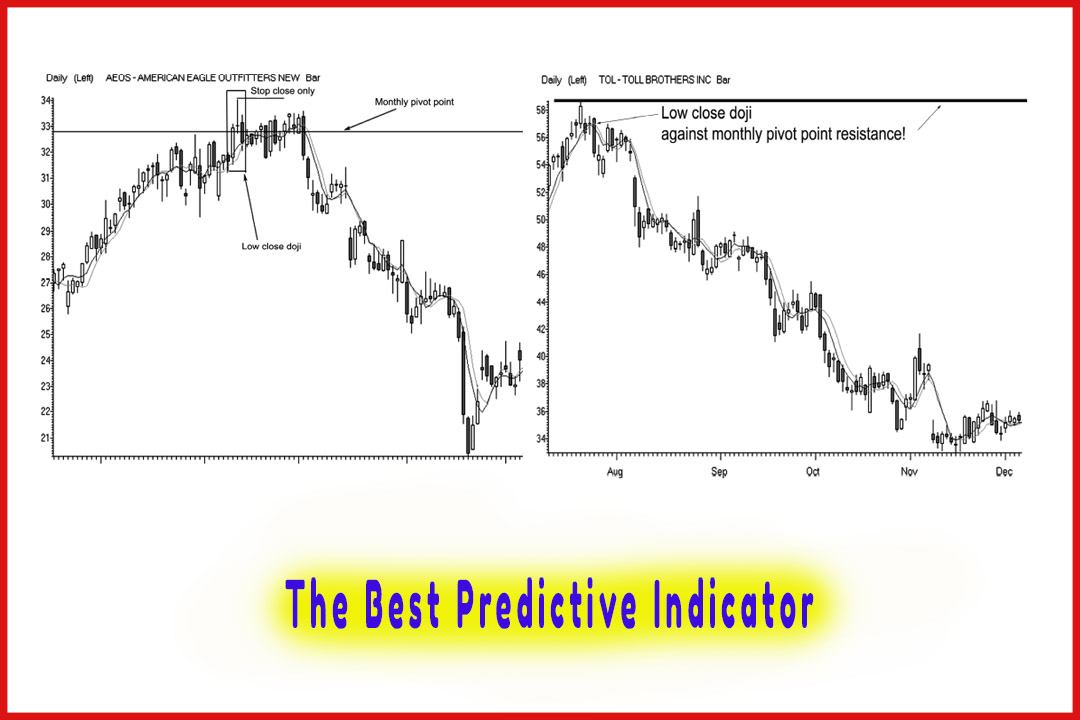
So far we
have demonstrated that dojis form more times than not at pivot point support
and resistance targets. In most of the examples, we have not seen a classic
morning doji star pattern develop at bottoms; however, high close doji setups
have developed. As you have identified the “hidden” support target by
calculating the pivot point target levels, you had a much clearer view of
timing the market reversal. Stacking the odds in your favor by including
analysis from other time frames, in addition to the aid of knowing the right
way to read the confirming indicators, will continue to help you with your
entries. Combining that with the knowledge of what to look for in identifying
trending conditions and what signals a trend to run out of momentum will help
you with your exits. That is what will increase your profits.
Figure
8.15 is a chart on Dell. As the market was plummeting, an exhaustion gap
developed. For some traders, buying sharply lower gap openings, such as those
that occurred at the end of October, is their bread and butter. Most traders
buy the lower opens and look for the gap to be “filled”
on the charts. In other words, they buy the market looking for prices to
move back up to test the prior day’s settlement. In this situation, that would
have been a bad strategy because the market remained on the defensive for
another week and a half. In fact, the market made a lower low. However, instead
of playing the “catch
the falling knife” guessing game, if you were patient and practiced
discipline by waiting to see what the market’s behavior was at the confluence
of weekly and monthly supports levels, you would have seen a high close doji
setup develop. Even the stochastics indicator confirmed the trigger to buy. As
you can see, the %K and %D crossed and closed back above the 20 percent line at
the same time as the high close doji trigger occurred.
The high
close doji helps add simplicity to your trading. Aided by the use of pivot
points analysis, stochastics, and MACD indicators and the moving average
method, you have a beautiful system that should help generate reliable buy
signals for forex, futures, and stock traders, whether they are short-term or
long-term in nature.
The Candlestick and Pivot Point Trading Triggers : Chapter 8. Setups and Triggers : Tag: Candlestick Pattern Trading, Forex, Pivot Point : Hammer candle pattern, How to trade Intraday in stocks, How to trade intraday in forex, how to trade doji setup, Daily pivot point - Intraday Triggers on Stocks