The Best Predictive Indicator
Best signal predictive pattern, Best doji pattern, Best trading pattern
Course: [ The Candlestick and Pivot Point Trading Triggers : Chapter 8. Setups and Triggers ]
The best predictive market analysis tool is the pivot point, especially when using the higher time periods, such as the monthly and weekly time frames. We did cover the power of confluence, which should never be ignored.
The Best Predictive Indicator
The best
predictive market analysis tool is the pivot point, especially when using the
higher time periods, such as the monthly and weekly time frames. We did cover
the power of confluence, which should never be ignored. Using the monthly time
frames, any investment vehicle like forex, futures, and stocks, especially
after a market starts to form a doji on a daily chart, is a sure sign that
there is a strong possibility that a price or trend change is about to occur.
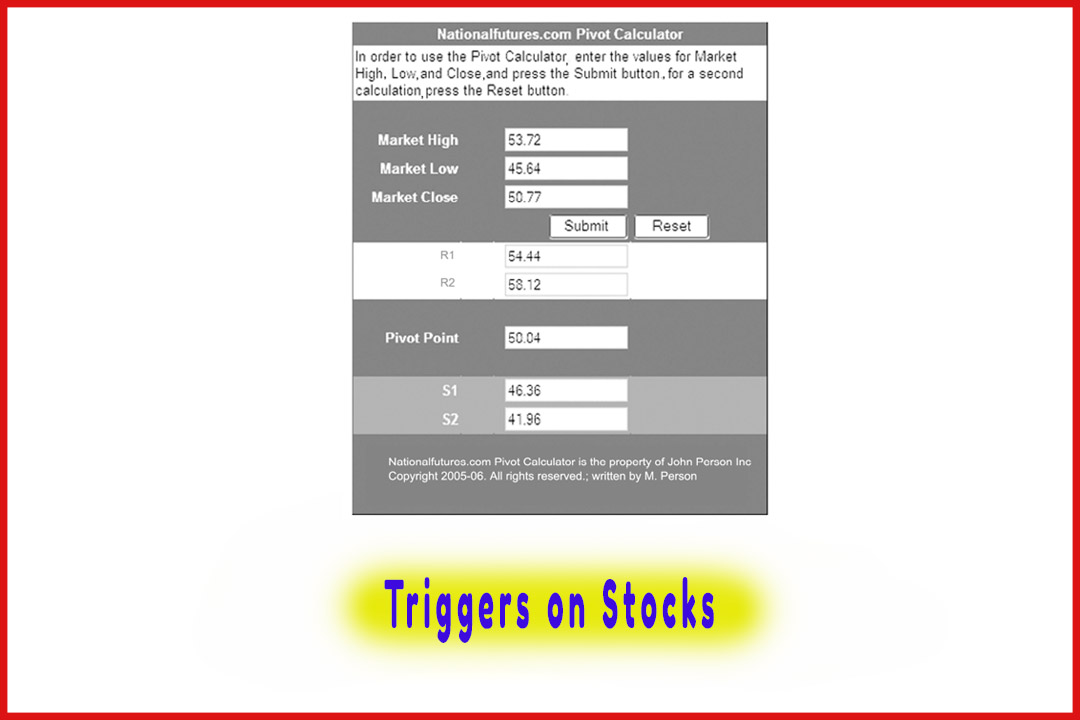
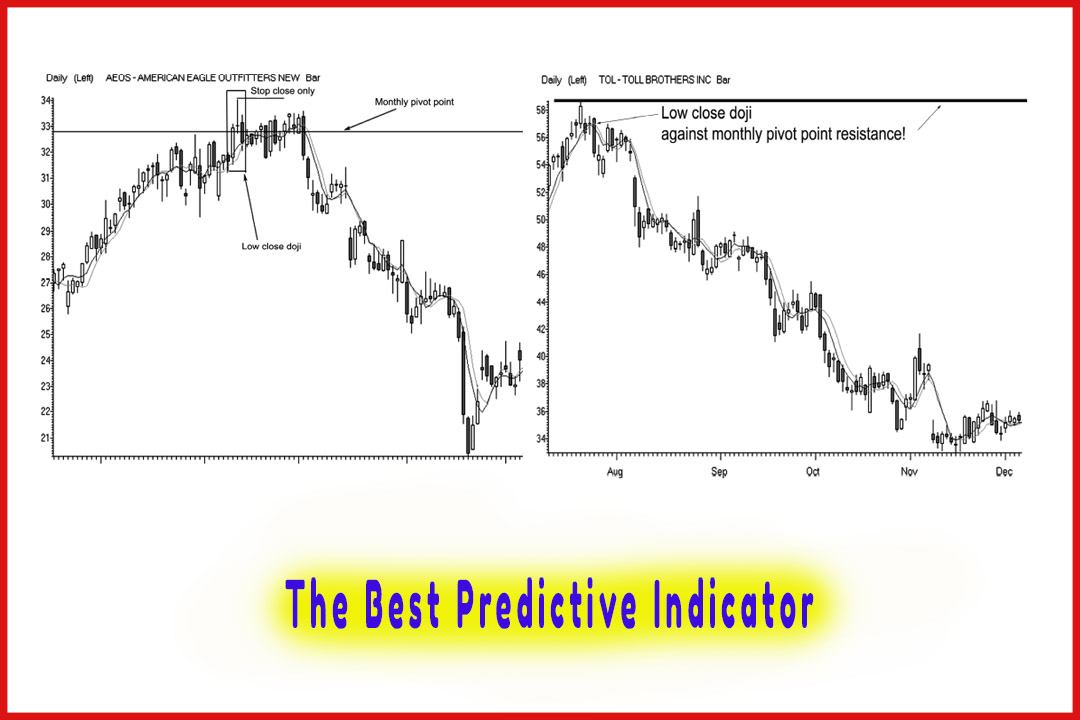
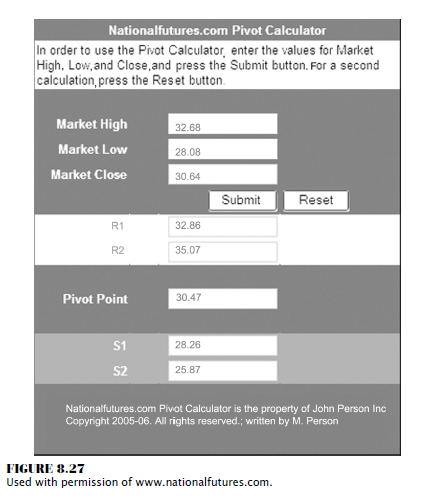
A great example of using this method to help
uncover a potential disaster in the stock of clothing retailer American Eagle
Outfitters was used in mid-July. Taking the trading data from June as shown in
Figure 8.27, the Pivot Point Calculator shows the monthly R-1 was 32.86 and the
R-2 was 35.07. The actual high was 34.04, right in the middle of the target resistance
levels.
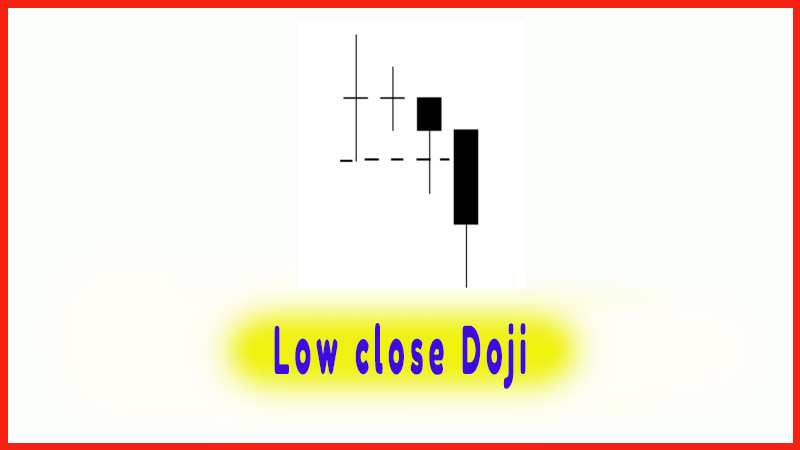
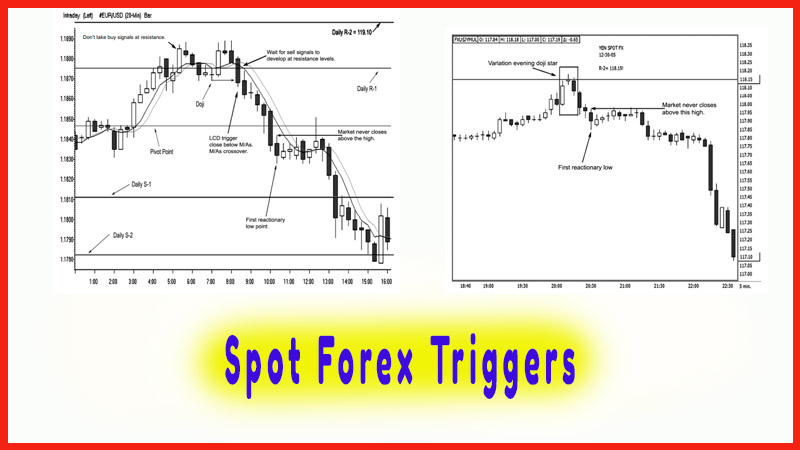
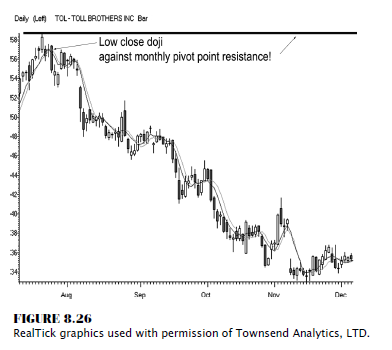
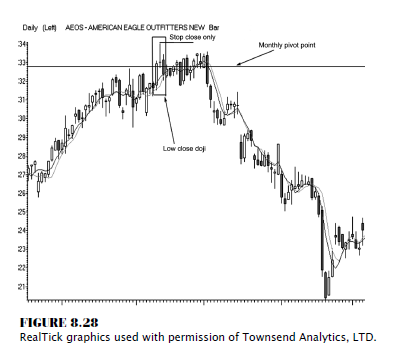
One thing
interesting here is that in Figure 8.28, the variation evening doji star does
create the low close doji setup and indicates that the bullish momentum, or
uptrend, had stopped. However, the market traded in a consolidation range for
two weeks before the trend reversal occurred. The trigger to go short was not
elected because there were two elements missing: (1) The market did not close
below both moving average values; (2) the shorter-term moving average did not
cross below the longer-term moving average. Those variables came later, as you
can see on the chart. But the fact is that the monthly pivot point kept the
market from establishing further gains; and the low close doji trigger was a
significant warning to exit longs, buy put options, or at least tighten stops
or move stop orders up to protect profits from long positions. The initiative
to sell short was also a very viable action. Using a stop-close-only above the
doji’s high, a trader would not have been knocked out of the short position at
any time.
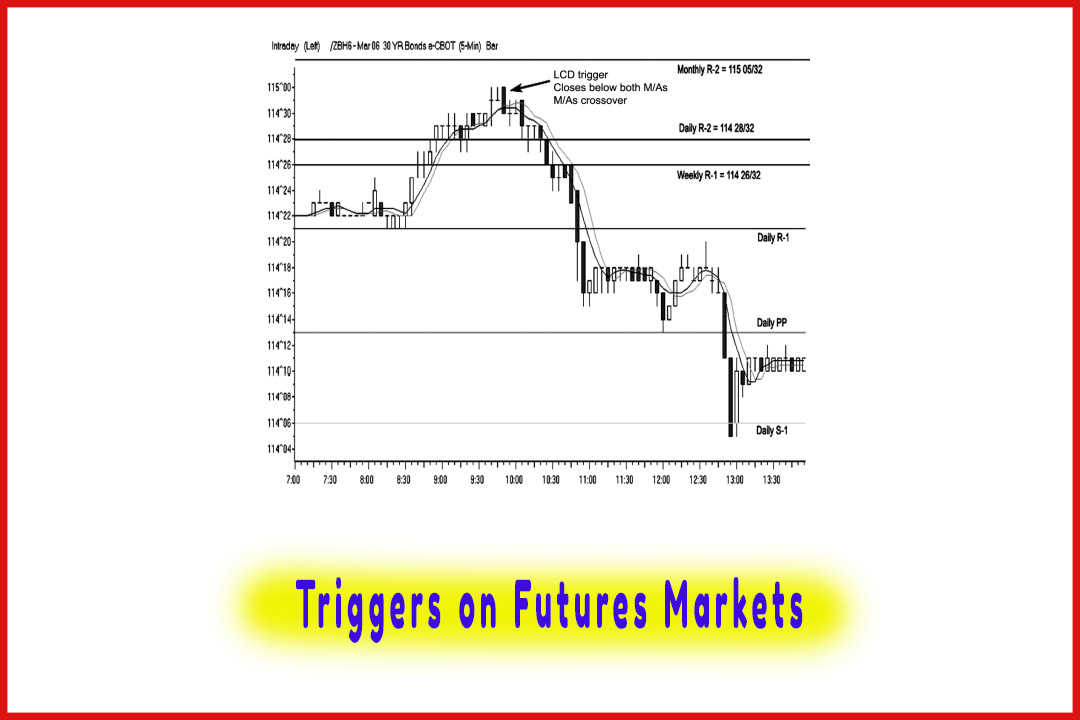
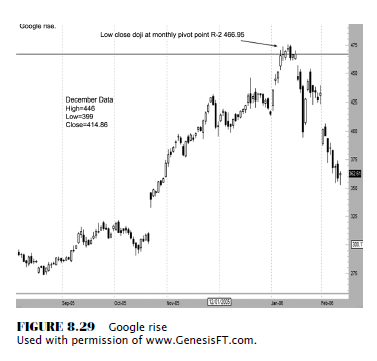
One of
the more popular stocks in 2005, which mystified traders as it made a
stratospheric rise, was Google. Figure 8.29 shows the price move that many
thought would never end. Stock analysts were making upgrades calling for 600
per share in the first week of January 2006, and some were claiming as high as
2000. As you can clearly see, the low close doji pattern foretold of the market
top; more important, it traded near the monthly R-2 resistance level of 466.95.
Once again, here was a high-profile stock that formed a major top with an LCD
trigger at a monthly pivot point target resistance number.
The Candlestick and Pivot Point Trading Triggers : Chapter 8. Setups and Triggers : Tag: Candlestick Pattern Trading, Forex, Pivot Point : Best signal predictive pattern, Best doji pattern, Best trading pattern - The Best Predictive Indicator