Triggers on Stocks
How to Triggers on Stocks, pivot point analysis, How to trade resistance target levels, How to identify doji pattern
Course: [ The Candlestick and Pivot Point Trading Triggers : Chapter 8. Setups and Triggers ]
Pivot point calculations are and how the markets react to them. The resistance target levels are “hidden,” meaning you cannot see a projected high because it is not drawn from a past chart pattern; rather, it is derived from a mathematical calculation.
Triggers on Stocks
In
Chapter 1, I gave an example of how an exchange traded fund may not react as
much or at all compared to a stock in that group or sector. One such stock I
showed was in Figure 1.15—Toll Brothers. If you broke that monthly chart down
to a weekly and then a daily time frame and used the combination of the
techniques taught so far with pivot point analysis in conjunction with these
specific candle patterns, you would have been alerted to a top in the market in
the summer of 2005.
Why don’t
traders act on these signals? Most traders do not realize what pivot point
calculations are and how the markets react to them. The resistance target
levels are “hidden,” meaning you cannot see a projected high because
it is not drawn from a past chart pattern; rather, it is derived from a
mathematical calculation. This gives a projected price expansion on a
measured-increase based on the previous time period’s range according to the
pivot point formula. Using the monthly pivot point method, taking the trading
data for Toll Brothers from June would have helped predict the high for July.
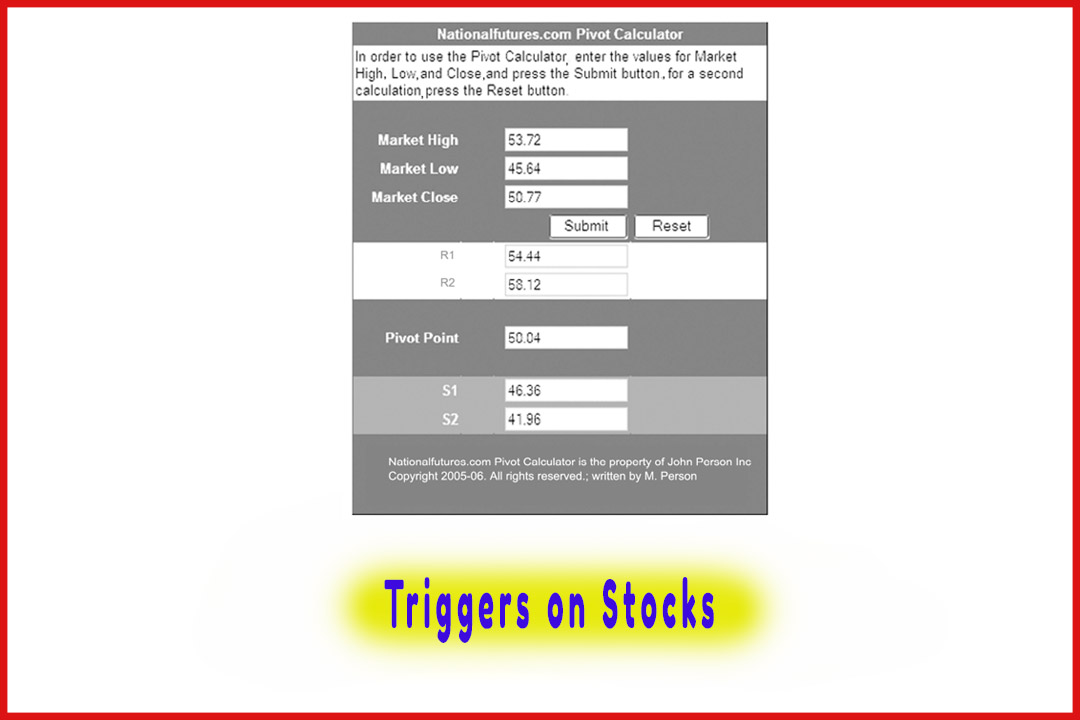
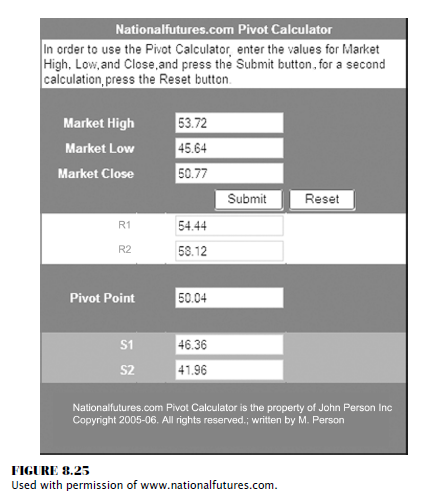
Figure 8.25 shows the Pivot Point Calculator with the high, the low, and the
close from the month of June. Notice that the R-2 target number was 58.12. The
exact high in July was 58.67!
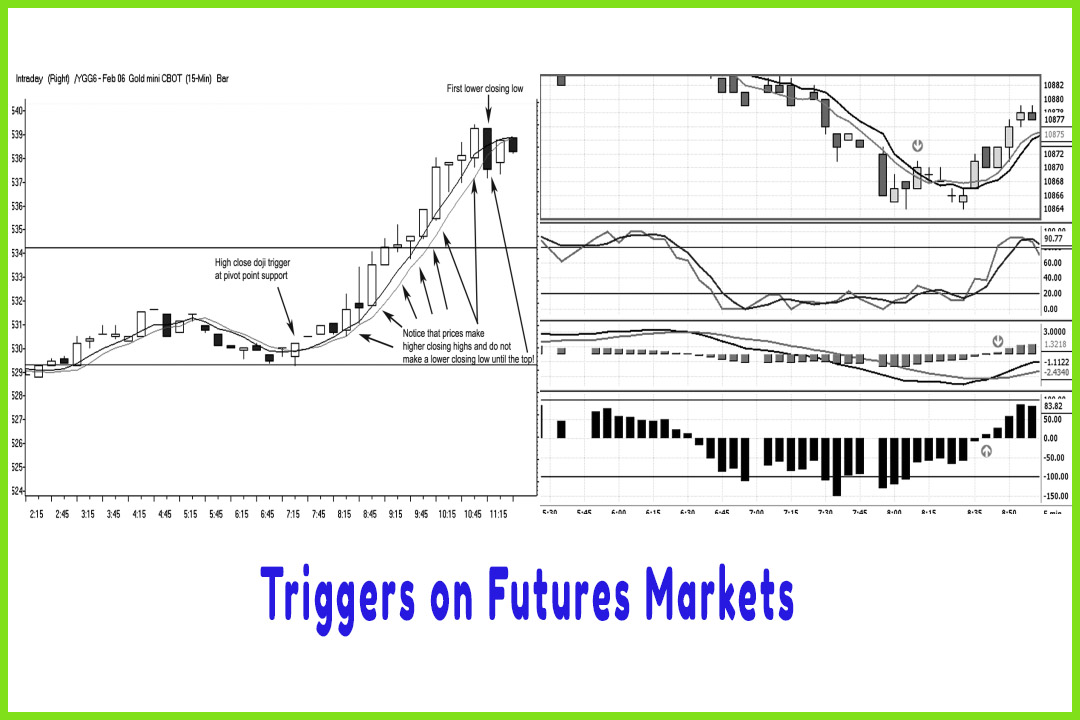
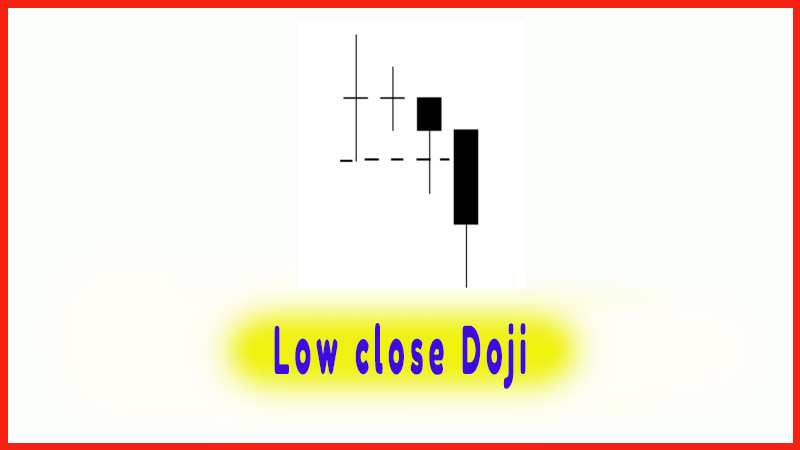
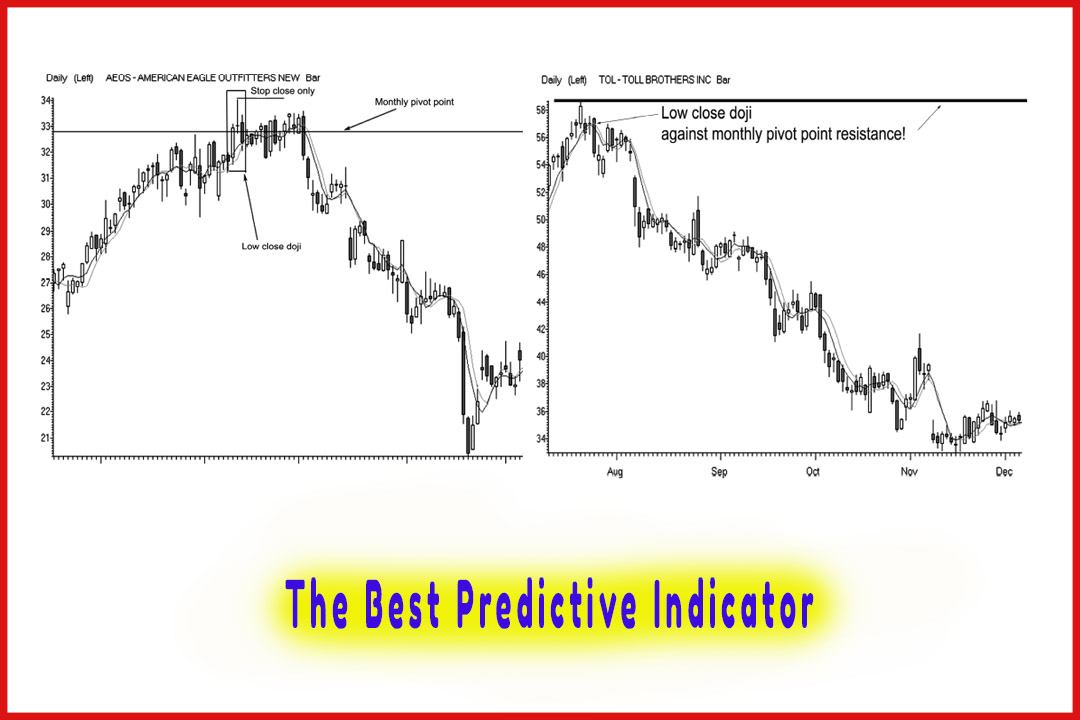
The chart
in Figure 8.26 illustrates the low close doji trigger. In addition, we had the
moving averages cross over, and prices traded beneath both moving averages to
help confirm that the market had lost its bullish momentum.
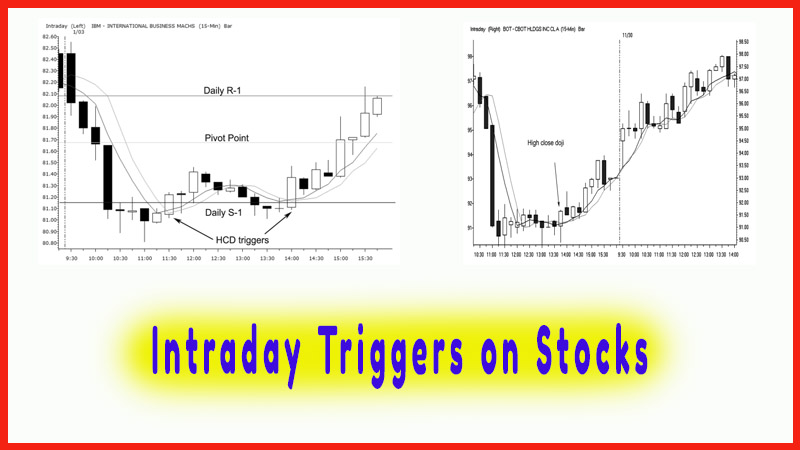
To some
traders, the tall white candle at the top may have appeared to look like a
buying opportunity, especially as the market made a slight correction. The low
close doji against the longer-term monthly pivot point resistance told a
different story.
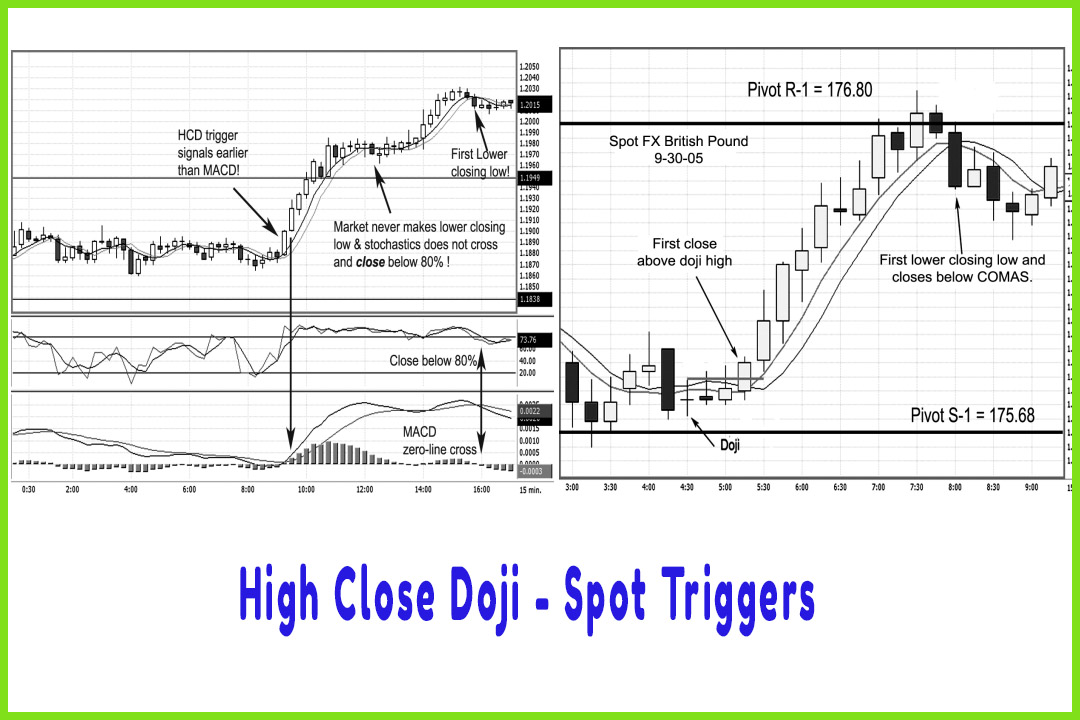
Identifying the doji at or near a pivot point
is a great guideline to alert you almost every time that there is a potential
price change or reversal coming. Once the market makes that lower closing low,
that is the trigger to sell. That will hold as a valid statement until the
market closes back above the doji’s high.
The Candlestick and Pivot Point Trading Triggers : Chapter 8. Setups and Triggers : Tag: Candlestick Pattern Trading, Forex, Pivot Point : How to Triggers on Stocks, pivot point analysis, How to trade resistance target levels, How to identify doji pattern - Triggers on Stocks