Bullish Convergence Pattern
How to trade Bullish Convergence Pattern, Market reversal Pattern, Bottom hammer pattern
Course: [ The Candlestick and Pivot Point Trading Triggers : Chapter 8. Setups and Triggers ]
The jackhammer is a formation that seems to be present in such a situation. Therefore, it is a great method for setting up a potential buy signal once the pattern is confirmed.
Bullish Convergence Pattern
In
Chapter 4, we went over how the market price makes lower lows, but not by
significant measures, and that when prices are at oversold extremes, we should
be cautious for market reversals. We went over the market condition of bullish
convergence and how to use the stochastics and MACD indicators to confirm buy
signals when that market condition exists. The jackhammer is a formation that
seems to be present in such a situation. Therefore, it is a great method for
setting up a potential buy signal once the pattern is confirmed.
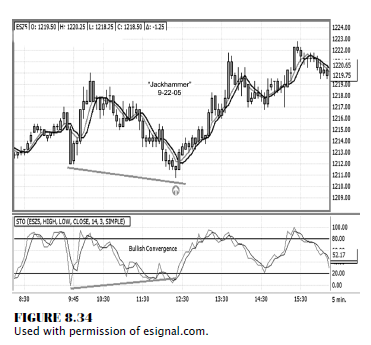
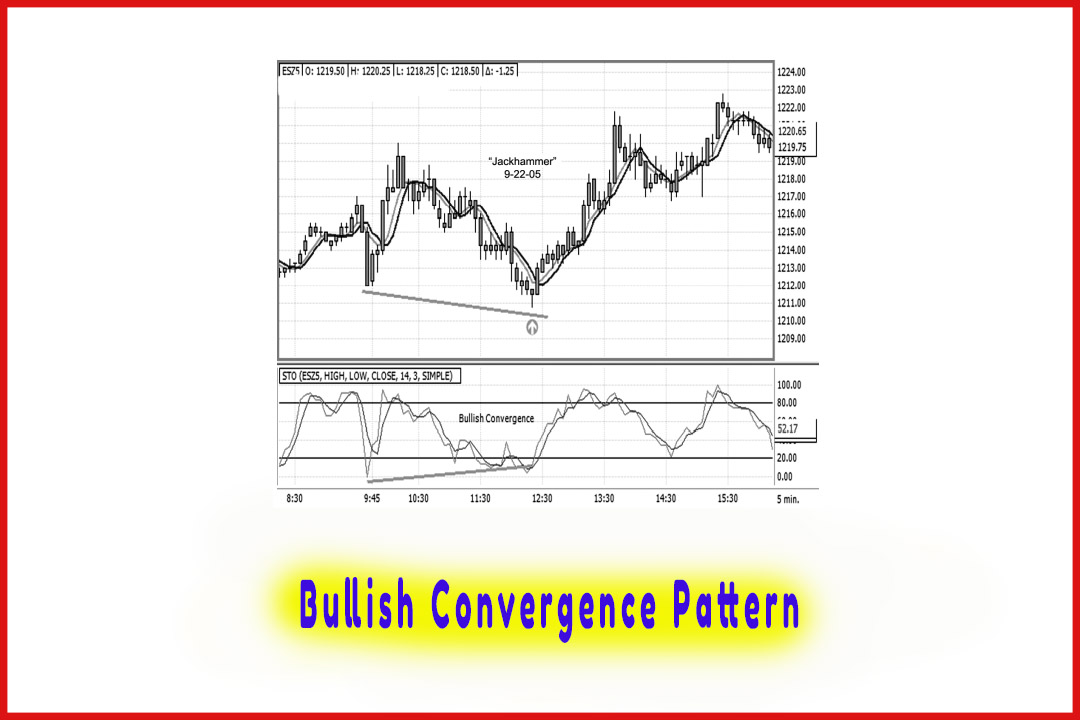
Look at
Figure 8.34, e-mini-S&P 500 futures. As you see, the midsession of the
trading day at 12:30 shows on the charts that the market takes a secondary
decline, forming that spike bottom hammer pattern. Notice that the very next
candle after the hammer is a tall engulfing candle that forms a higher high.
Prices then continue on in the sequence of higher highs, higher lows, and
higher closing highs, while continuously trading above the moving averages. If
you examine the stochastics at the bottom of the chart, notice that when the
price made a new lower low, the reading from the stochastics made a higher low,
identifying that bullish convergence existed. If you watched for the
stochastics to close back above the 20 percent line to confirm the price reversal
and the trigger to go long, you would have had a stress-free trade that
resulted in immediate returns.
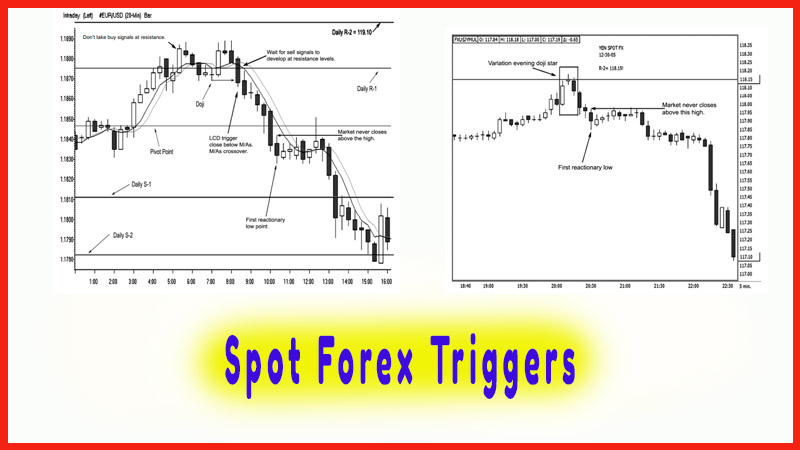
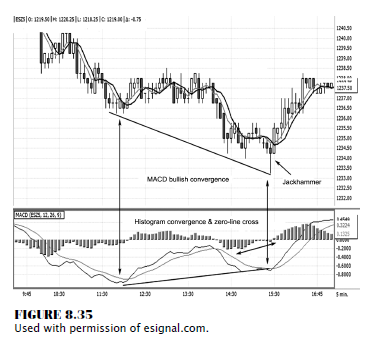
In Figure
8.35, you see another example of the e-mini-S&P, this time with the aid of
the MACD study. The jackhammer occurs past the midsession and actually closer
to the close of business. Here we see both the moving average and the histogram
components alerting us to the fact that the price action was oversold and that
a reversal was likely. The one-two combination of the jackhammer and then the bullish
engulfing pattern revealed a forthcoming price reversal.
Stocks Get Jacked, Too
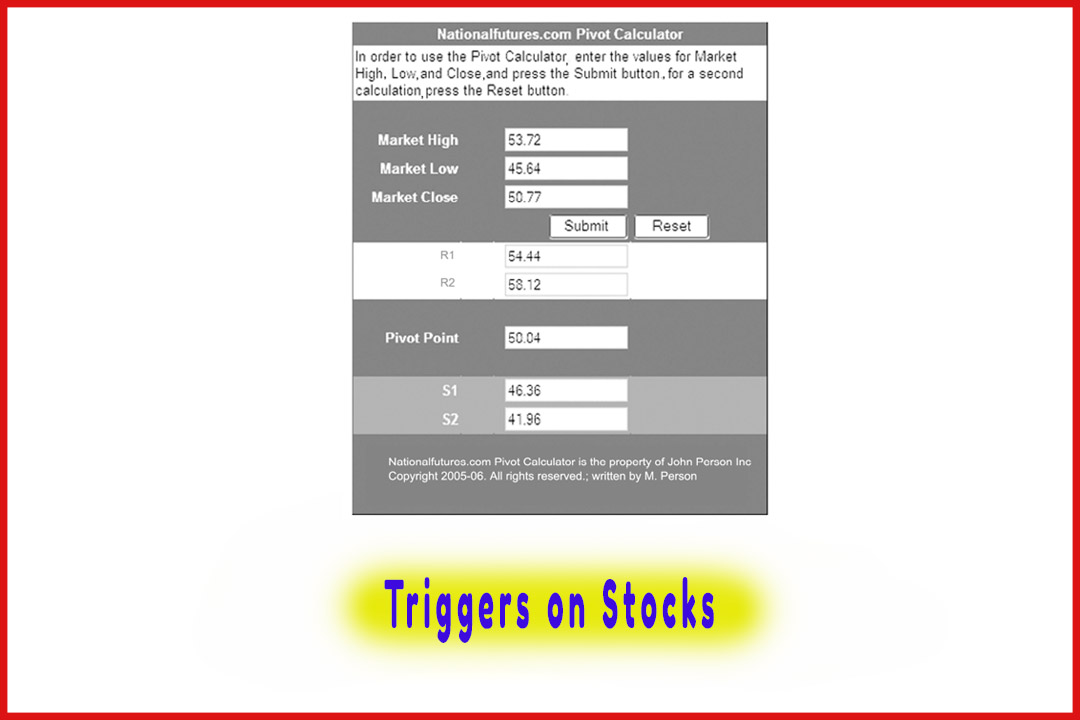
The
psychological aspect of this formation occurs in stocks as well. Believe me,
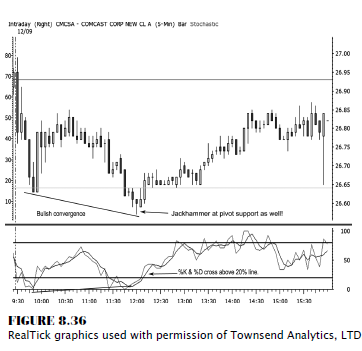
they are not immune to the ravages of human emotion. The example in Figure 8.36
is Comcast Corporation and is a great illustration of how the stochastics
indicator confirms that the jackhammer, or secondary low buy signal, was
triggered as confirmed with a bullish convergence signal. The fast stochastics
indicator shows the timing of both %K and %D closed back above the 20 percent
line, confirming a bottom was in place. The trigger to go long here is on the
close of the hammer at 26.63; and before the close at 4 p.m. (ET), the market
price is at 26.84.
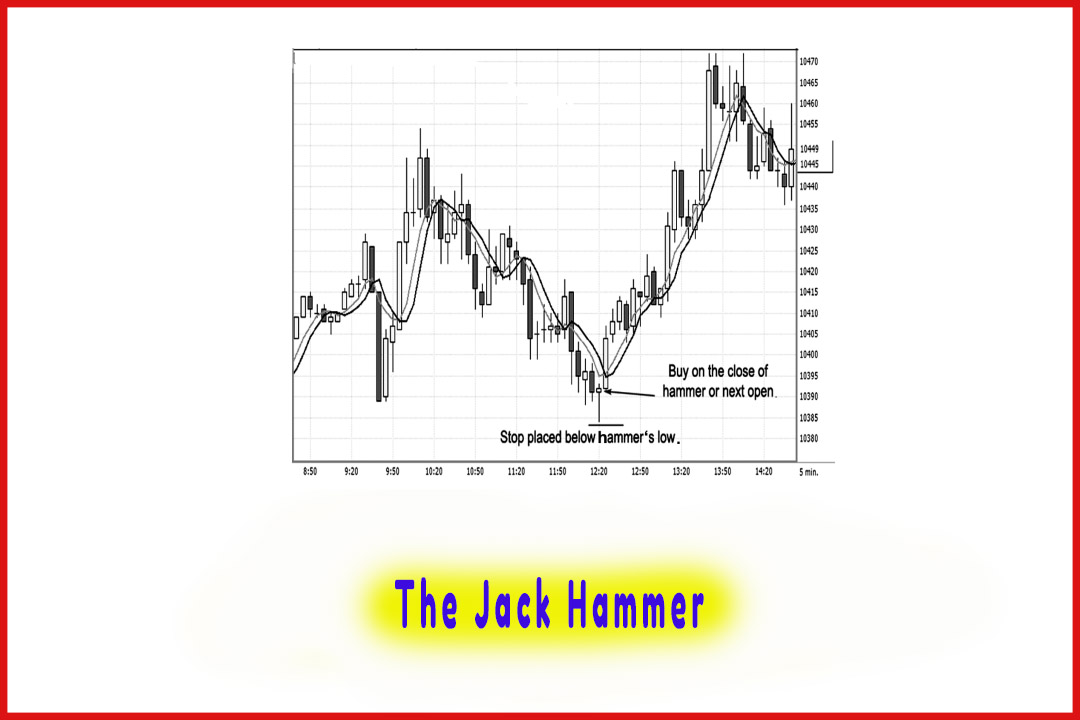
The Jackhammer’s One-Two Punch
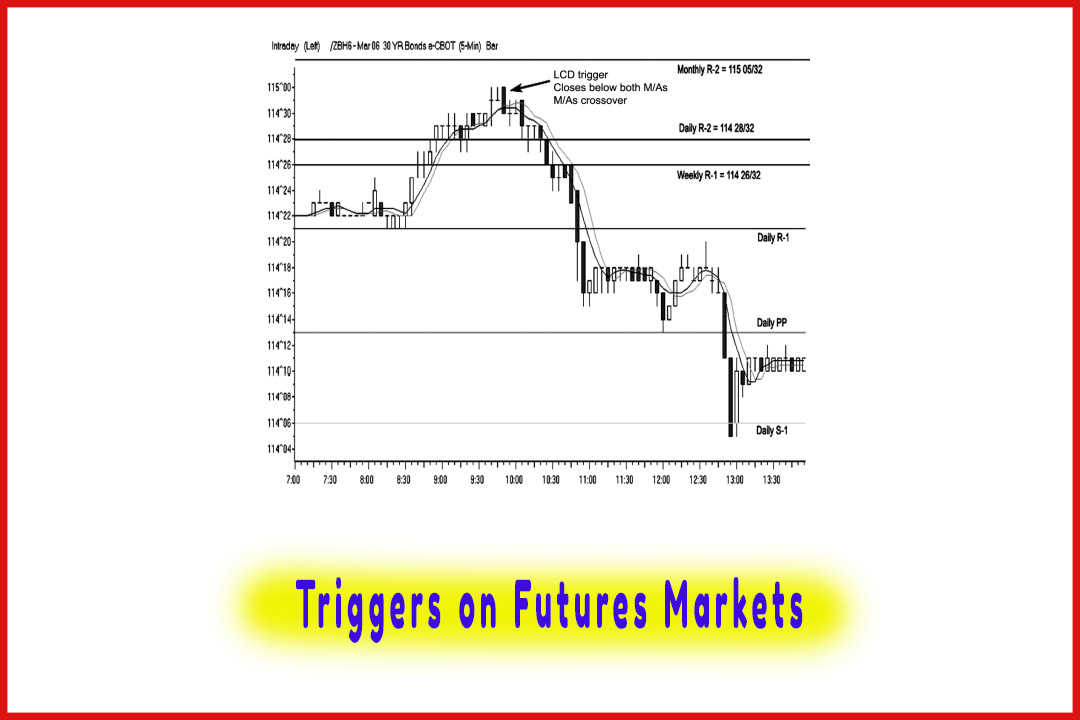
Figure
8.37 shows a 30-minute chart on United Technologies that illustrates, depending
on the time period, that the jackhammer pattern can exist from one day to the
next, like a one-two knockout punch that attacks the stops and immediately pops
up.
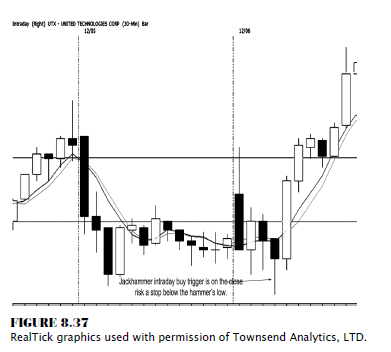
Since
many traders look at the obvious low point to place their stop-loss order, as
this example shows, the jackhammer took out the prior day’s low; and then once
again, the one-two pattern develops with the hammer and then the next candle
being the tall white, or bullish, engulfing candle. This starts the immediate
price reversal, with the sequence of higher highs, higher lows, and higher
closing highs. See how the market also closes above and continuously trades
above both the moving average values.
If you
know what to look for, trading for a living is a great opportunity; but with
opportunity comes responsibility. Prior to entering a trade, you should have
your “pregame” setup, complete with your market analysis and rules for entering
a trade. Certain rules should start with the techniques covered in this book so
far, which include:
- Identifying what the market condition is—overbought or oversold bullish, bearish, or neutral.
- Identifying the levels that the pivot points lines are at, using the various time frames—monthly, weekly, and daily periods.
- Setting up your charting software parameters with these specific pivot points moving average values.
- Experimenting with variation settings on your own.
Then you
need to watch and identify when and at what price points the dojis, hammers,
and shooting stars develop. Knowledge of these items will arm you with critical
information that can help provide protection from overtrading as well as from
adverse moves and such pitfalls as reacting on emotions rather than on actual
trading signals.
SUMMARY
The
method of market analysis described in this book is designed so you will be
educated on the importance of developing your personal trading system and so
you can apply the techniques on a consistent basis, which will allow you to
make decisions in a mechanical and non-emotional way. Common mistakes that
traders make are not testing a strategy and not making a logical determination
of whether the strategy is viable for their trading style. Many traders adopt a
new strategy, trade with it, and immediately start tweaking different
components of the strategy. The best approach that I have found in trading is
to establish trading rules and to test those rules until an outcome is
determined based on a reasonable number of trades. Also, I have several
different trading strategies for different markets or conditions. The high
close doji, the low close doji, and the jackhammer patterns are just a few of
my proprietary setups that I watch for meeting these conditions.
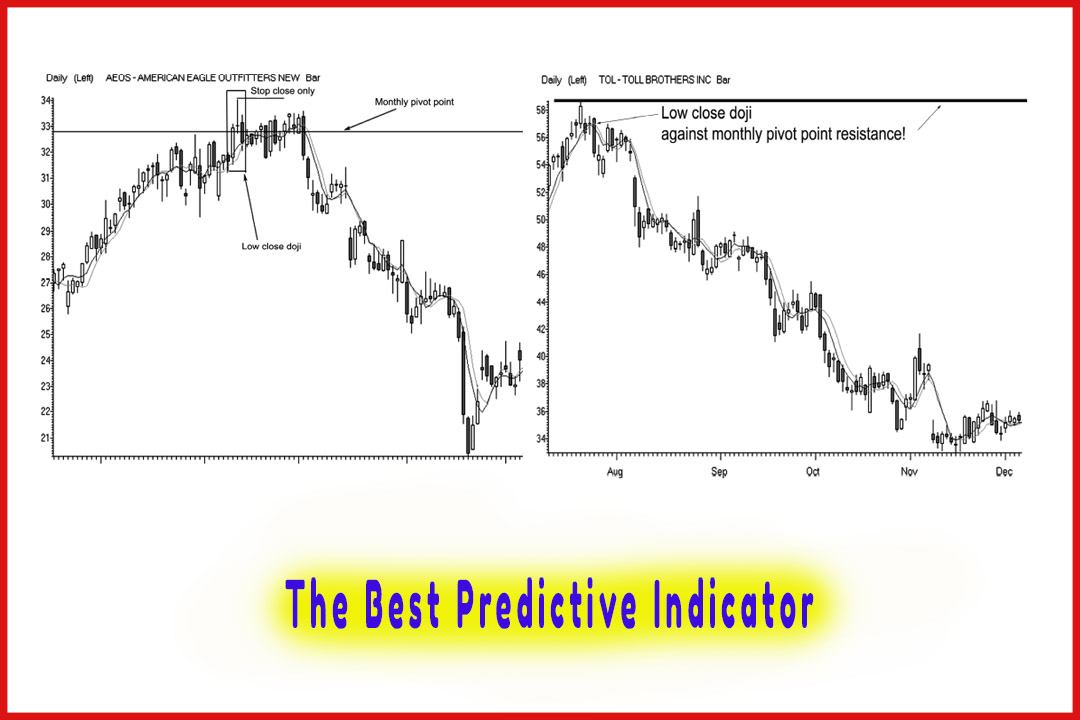
If you
are in a declining market, once an apparent bottom occurs near a pivot point
support target, watch for the high close doji or the jack hammer pattern to
develop. In a rising trend, once the market trades at or near a projected pivot
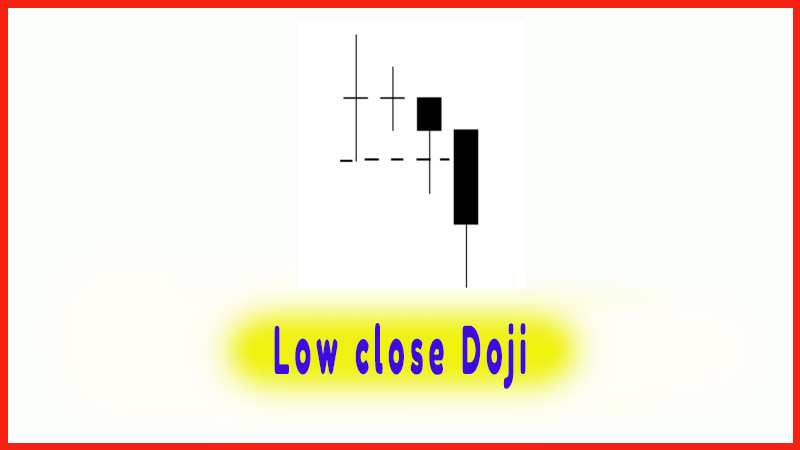
point resistance, watch for a low close doji or a shooting star pattern. These
specific patterns can be added to your personal toolbox of setups or used
exclusively as a day trading plan. By understanding the current market
conditions (uptrend, downtrend, or sideways), you can heighten your awareness
of specific patterns that can be applied to that trading environment. All that
is left after entering a position is risk and trade management, which is the
focus of the next chapter.
The Candlestick and Pivot Point Trading Triggers : Chapter 8. Setups and Triggers : Tag: Candlestick Pattern Trading, Forex, Pivot Point : How to trade Bullish Convergence Pattern, Market reversal Pattern, Bottom hammer pattern - Bullish Convergence Pattern