Triggers on Futures Markets with Pivot Points
pivot point analysis, support and resistance levels, pivot point support, pivot point resistance, Spot Forex Triggers, bullish momentum
Course: [ The Candlestick and Pivot Point Trading Triggers : Chapter 8. Setups and Triggers ]
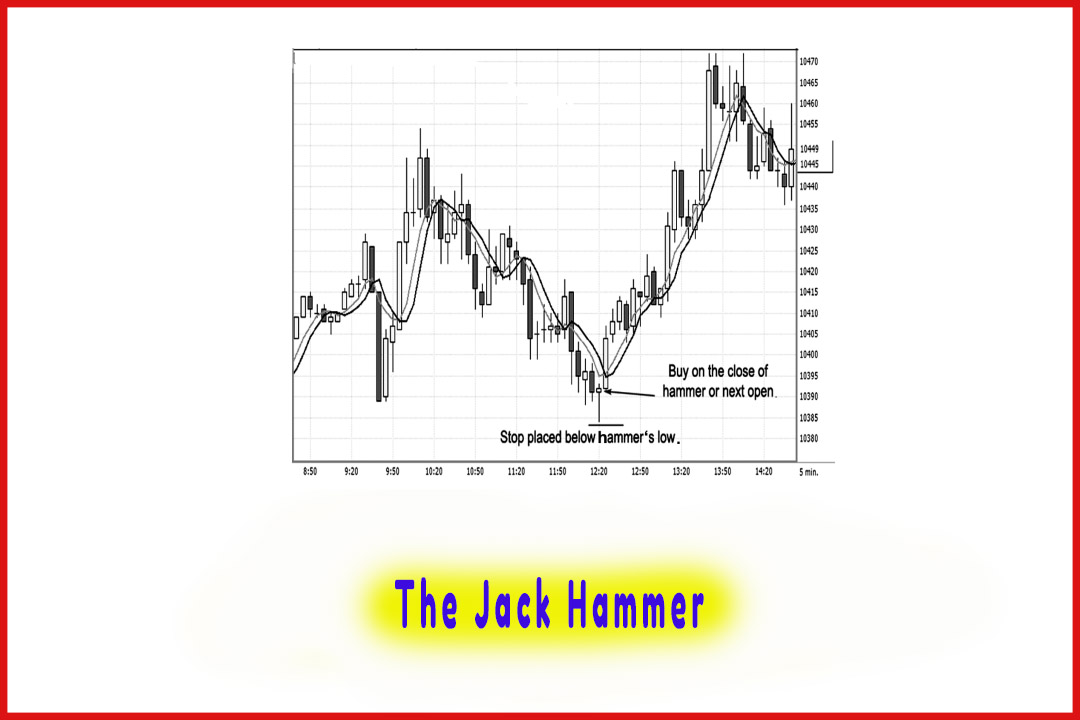
The trigger to go long is on the close of that time period or the next time frame’s open. If the market is to go into trend mode, which in this example it did, we should see the sequence of events unfold, such as higher highs, higher lows, and higher closing highs.
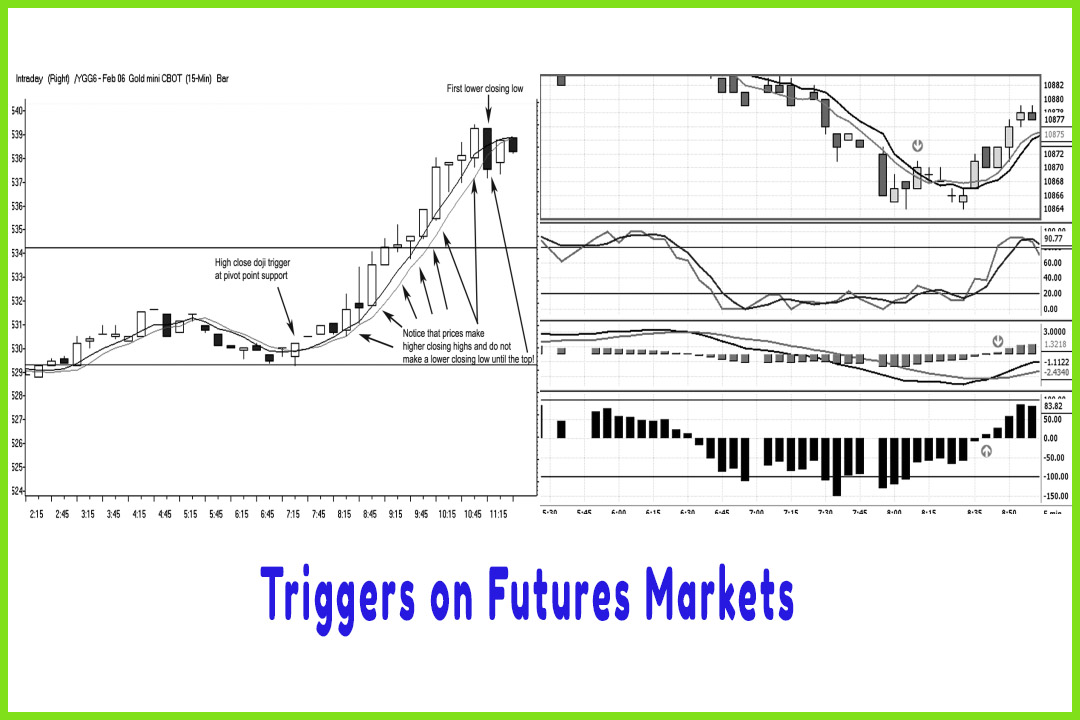
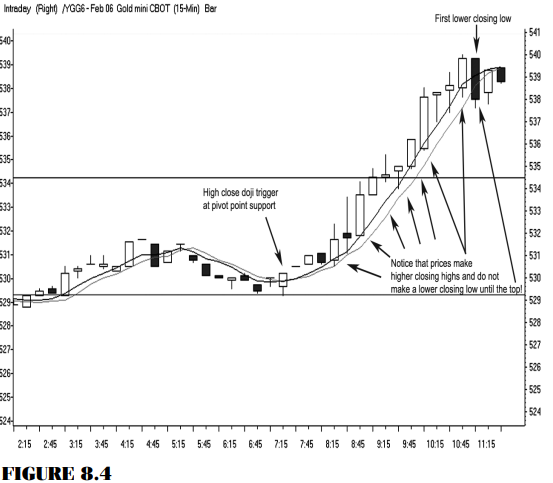
Triggers on Futures Markets
Let’s
tune our focus to the futures markets. Figure 8.4 shows a 15-minute chart on
the Chicago Board of Trade (CBOT) mini-gold contract. Notice the HCD trigger
and the small hammer like pattern that forms on the pivot point support. The
trigger to go long is on the close of that time period or the next time frame’s
open. If the market is to go into trend mode, which in this example it did, we
should see the sequence of events unfold, such as higher highs, higher lows,
and higher closing highs. As a day trader, your exit is at the least to be
calculated by the end of the day; but until the market makes the first lower
closing low near a key resistance level, you stay with the position or at least
scale out of partial positions at the first sign of a pause in the trending
condition.
The long
would be entered at 530.50, and the offset was triggered at 538. That would be
a $7.50 move per contract and would equate to $250 per contract.
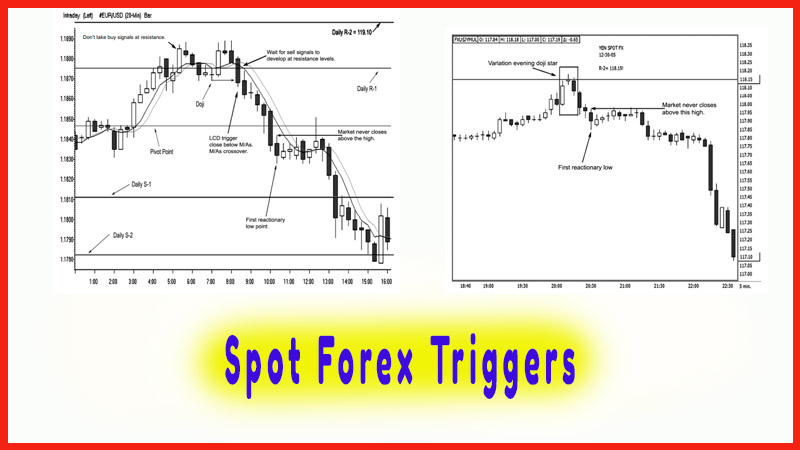
The
example in Figure 8.5 is on a five-minute chart. We see confirmation of an HCD
trigger with the fast stochastics closing back above the 20 percent line. Here
we have the same feature with higher highs, higher lows, and higher closing
highs. The trigger to go long here is 113%, and the trade was still going
strong until we see a series of dojis at the top.
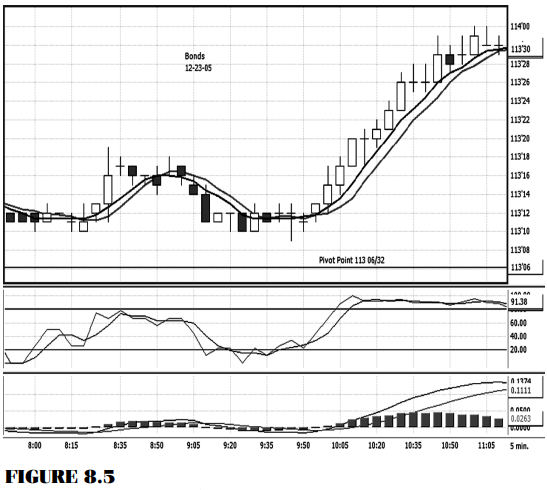
In this
case, especially as a day trader, you may do several things: Liquidate your
longs at the last price, 1133032, which equates to a juicy profit per contract
of $468.75 (each tick in bonds is $31.25). You would look to get out because
you know, based on the research covered in Chapter 7, that dojis form the day’s
highs or lows in bonds a fair amount of the time; and that is what occurred in
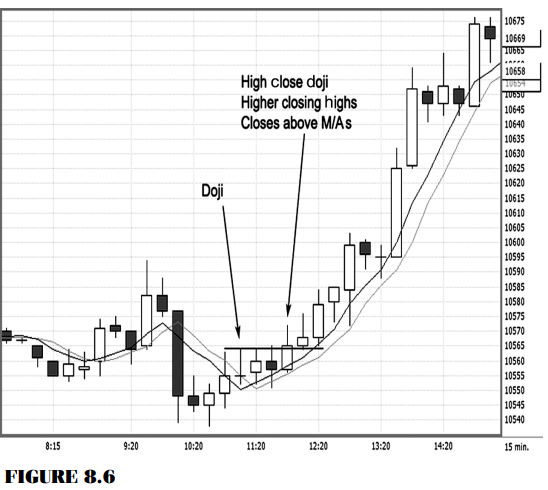
this example. Then when you see a doji form after a nice trend run or near a
pivot, getting flat is good common sense. If you had multiple positions on, the
scaling out of half to two-thirds of them would be another alternative (Figure
8.6).
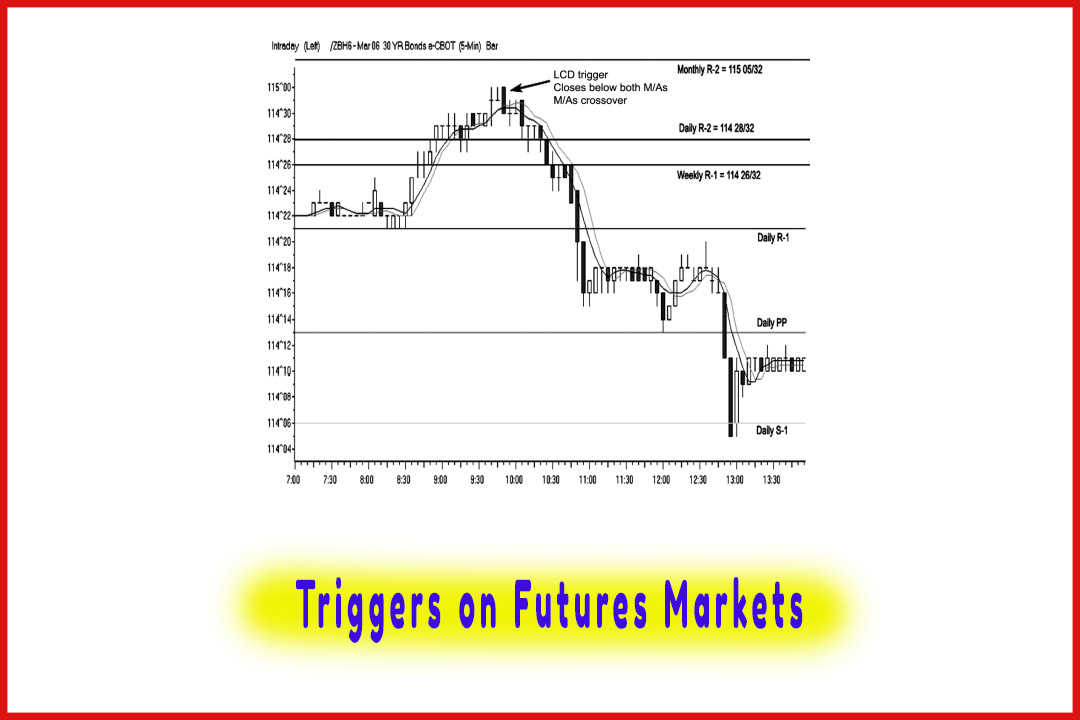
The trade
example in Figure 8.7 shows a 5-minute chart on the CBOT mini-Dow contract. The
daily pivot point support lines up at 10836. A doji forms; and the confirming
HCD trigger, which was initiated at 10846, develops. I have three identical
studies under the chart: (1) the fast stochastics, (2) the MACD study, and (3)
a commodity channel index (CCI) using a 14- period parameter setting. The
stochastics closes above the 20 percent line at the same time as the entry on
the HCD trigger; the MACD has not yet triggered a signal to go long, even as
the market soars to 10861. The CCI makes a zero-line cross signal, triggering
to buy or at least confirming that your long position is valid, but also late.
What is
important is studying how the indicators work and under-standing that if most
traders follow lagging indicators, by the time they see a bonafide buy signal,
you are already well on your way to profits.
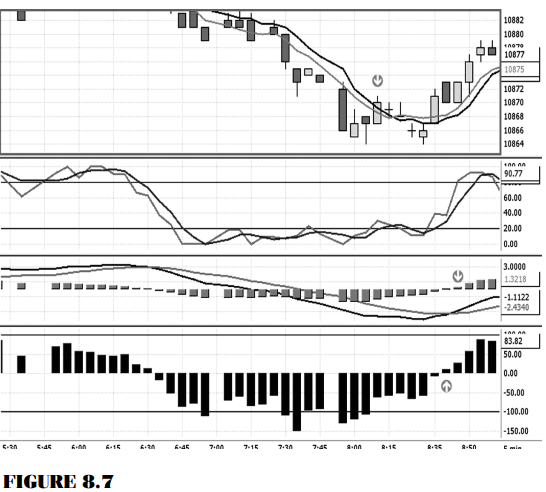
This signal gets you 15 points ahead of the
crowd, or $75 per contract. That might be not much money; but on a day trade
margin of $500, that is a 15 percent return and gives you a leading edge over
the competition.
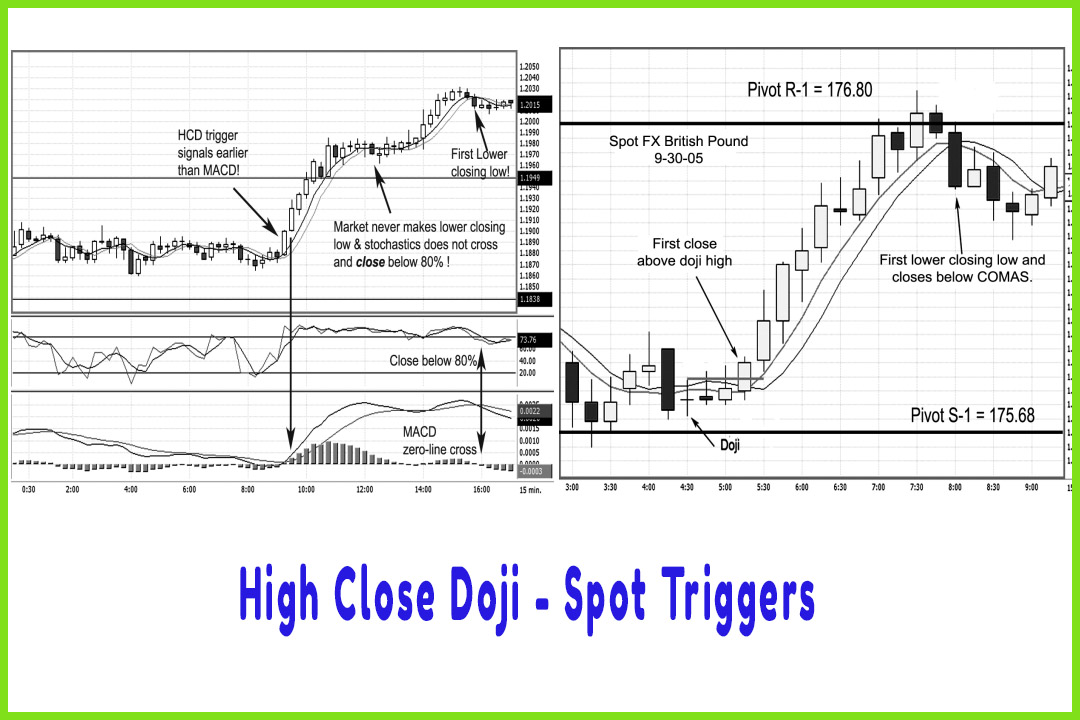
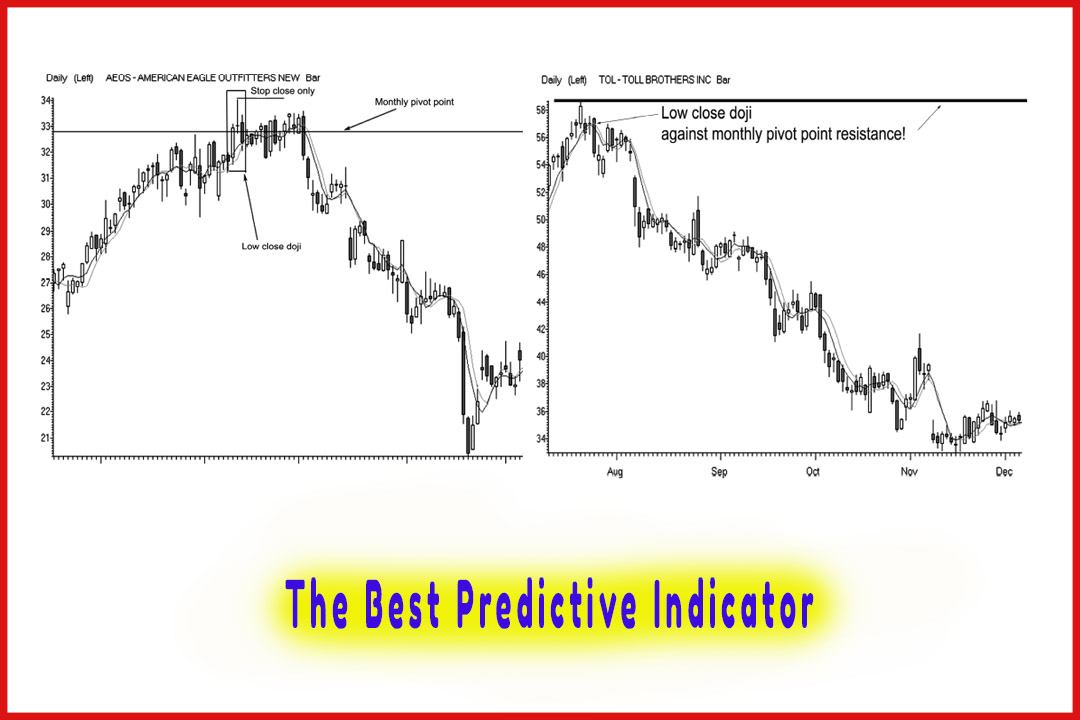
Besides
the mini-Dow, Standard & Poor’s (S&P), and the Nasdaq, there is the
Russell 2000 contract, which had a tremendous run in 2005 and early 2006. This
stock index contract responds well with the high close doji triggers combined
with the COMAS method. Remember that we do not see a bona fide doji appear all
the time; for example, when the close is not at the exact same price as the
open. A doji can assume the shape of a spinning top pattern as well, which is
why I use my judgment to determine if the close is less than 8 percent or so of
the overall range. I do consider the psychological aspect of the creation of
the doji candle pattern. After all, even a spinning top after a downtrend
indicates indecision; so a higher assigned value or a higher closing high takes
on the same meaning as a high close doji. Also confirming a trigger to go long,
as the example in Figure 8.8 shows, is seeing the HCD form at or come near to
the pivot point support level and then look for a close above both moving
average components. In addition, the shorter-term moving average crosses above
the pivot point average, confirming a conditional bullish change in the market.
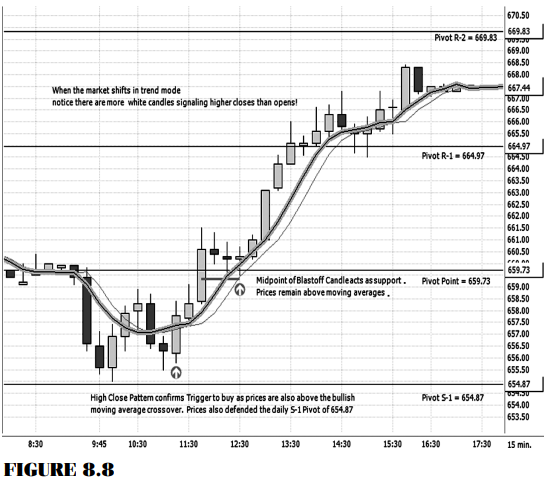
A trigger
to enter a long was established on the close above the spinning top pattern or
the open of the next period, which was at 658.00; and as you can see, higher
highs, higher lows, and higher closing highs developed. Examine the market’s
behavior at the R-1 target resistance level: The market simply paused, but yet
still closed above the R-1 price resistance level. After it penetrated the R-1
level, the market consolidated but still maintained a bullish bias be-cause the
market did not confirm an exit signal by simultaneously establishing three
criteria:
- A close below a prior low.
- The moving averages that did not cross and close below each other.
- A price that did not close below both moving average values.
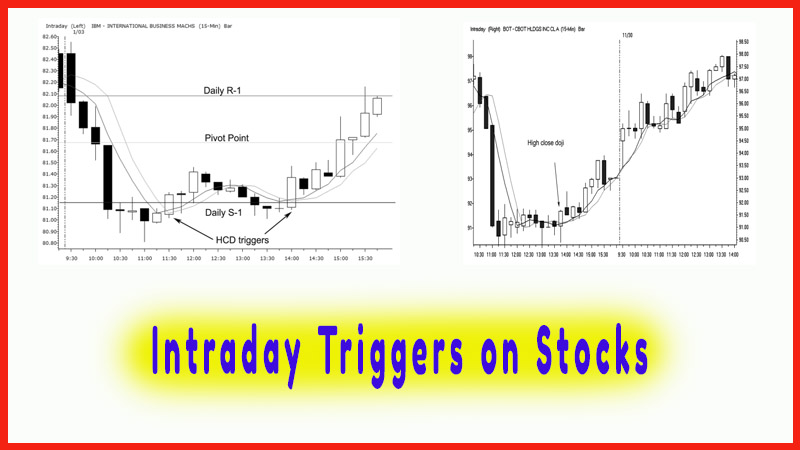
Fractal Relationships
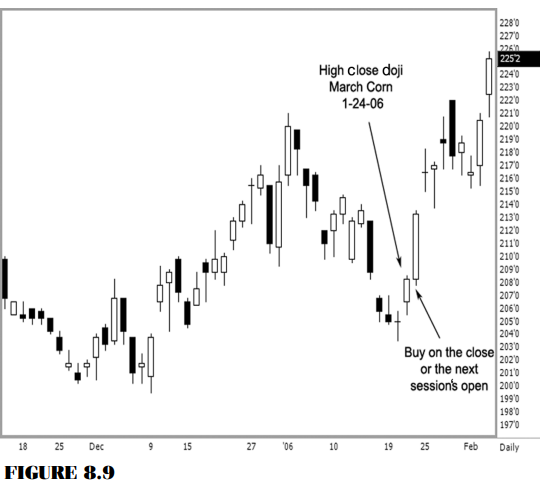
In Figure
8.9, I want to dissect a daily chart to see what the intraday pattern looked
like, as the daily chart formed a textbook high close doji trigger. The trigger
to go long was at 208.25, on the close of business on January 24 or on the open
on January 25. This example really highlights a fractal relationship as one
time period interacts with another.
My
favorite time period for intraday trading is the 15-minute time period because
it is divisible by 3, a relatively important number in the field of technical
analysis. More important, it is an extremely relevant time period to the grain
complex: Since the market opens at 9:30 a.m. (CT) and closes at 1:15 p.m. (CT)
there are 15 complete 15-minute time periods to trade.
Coincidentally,
the day the doji formed on an end-of-day chart as shown in Figure 8.9, we see
that a high close doji pattern formed on the intraday chart on a 15-minute time
period as well. Therefore, we sometimes see this pattern develop on smaller
time periods, such as the 15-minute period for end-of-day patterns for added
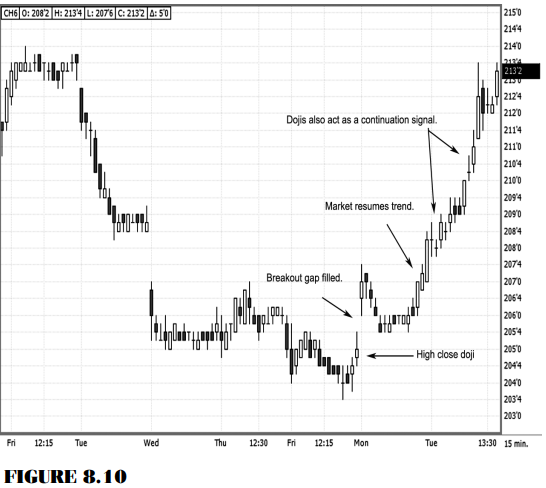
confirmation. Figure 8.10 shows the 15-minute chart for corn on January 24, the
day the doji formed. This is a great example of what a fractal relationship is
with trading signals.
As you
look at the 15-minute chart, we see a nice bullish run, complete with the
sequence of events we like when in a long position: higher highs, higher lows,
and higher closing highs. Quite a sweet setup—no pressure— no hassle—the way
trading should be all the time!
The Candlestick and Pivot Point Trading Triggers : Chapter 8. Setups and Triggers : Tag: Candlestick Pattern Trading, Forex, Pivot Point : pivot point analysis, support and resistance levels, pivot point support, pivot point resistance, Spot Forex Triggers, bullish momentum - Triggers on Futures Markets with Pivot Points